App Uninstall Rate: What It Means and How to Cut It
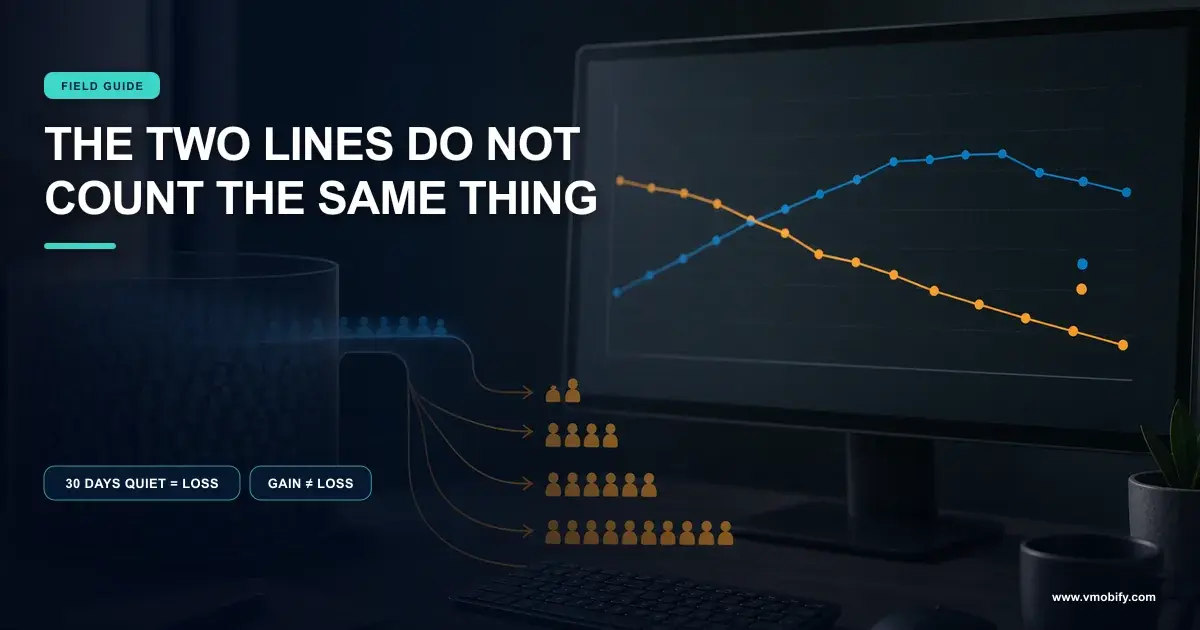
Uninstall rate is the retention metric everyone quotes and almost nobody defines. Google Play folds 30 days of device inactivity into the same number as a genuine uninstall, Firebase counts a different population entirely, and on iOS the metric you think you are reading does not exist. Here is what each source actually measures, and the one Play threshold that carries a documented consequence.
On this page
- What does uninstall rate actually measure?
- Why does Play’s user loss include people who never uninstalled?
- Is there a threshold that carries a real consequence?
- Why do Firebase and Play disagree on uninstalls?
- Can you measure uninstalls on iOS at all?
- What is a normal uninstall rate?
- What actually drives uninstalls in the first week?
- How do you cut the uninstall rate?
- How should you report this without misleading anyone?
- Frequently Asked Questions
What does uninstall rate actually measure?
Not the thing you think, and not the same thing in any two consoles you have open. "Uninstall rate" is a phrase, not a metric. Every platform that reports something under that heading defines it differently, and the differences are large enough to change what you conclude.
There are at least four populations in play, and teams routinely compare one against another without noticing:
- Devices that removed the package. A raw count of removals on individual handsets, which double-counts a user with two devices.
- Users who removed it from every device they own. A user-level count, which is the one Play uses for its headline loss figures.
- Users who removed it or simply stopped using the device. This is Play’s User loss, and the second clause is the one nobody reads.
- Removals your analytics SDK saw. A different population again, because your SDK does not know where the package came from.
Google’s View app statistics documentation sets out the vocabulary. Installed audience is "the number of users who have your app installed on at least one device and have used the device (though not necessarily your app) in the past 30 days" — note that the qualifier is device usage, not app usage. User acquisitions counts "users who installed your app and did not have it installed on any other devices at the time", and includes users who activate a device on which your app is preinstalled.
Across the 300+ apps we have managed since 2013, the most common analytics dispute is not a discrepancy between tools. It is two people in one meeting using "uninstalls" to mean two different populations, and neither saying which.
Why does Play’s user loss include people who never uninstalled?
Because Google explicitly folds device inactivity into the same metric. Play defines User loss as "the number of users who uninstalled your app from all of their devices or stopped using any devices that your app is installed on for over 30 days (making them inactive, and counting as deactivation)".
Read the second half again. A user who made no decision about your app at all — but who put that phone in a drawer and switched to a new one — is counted as lost. So is a user whose device broke, and so is a seasonal user on a secondary handset.
Teams see user loss spike, assume a product problem, and go hunting through recent releases for a regression that is not there. In markets with high device churn or a large secondary-device population, a material share of "loss" is device deactivation. Before you treat a rise as a product signal, check whether your device-level uninstall counts moved at the same time. If they did not, you are looking at deactivation, not rejection.
Play’s own Loss rate is defined on the same page as "the ratio of User loss (people who have uninstalled your app from all of their devices) to Installed Audience (people who have your app installed on at least one device that has been turned on in the last 30 days)". Both halves of that fraction carry a 30-day activity condition, which means the denominator shrinks during the same periods the numerator grows. A quiet month for your category moves the ratio in both directions at once.
This is also why the retention question and the uninstall question are not the same question. Google notes on its acquisition and retention documentation that Retained installers are "installers who kept your app on at least one of their devices for the number of days shown", and adds the line that deflates most retention dashboards: "Installation doesn’t mean that the app was opened over this period." An app can be retained and dead. Our breakdown of what retention numbers actually compare covers where that gap usually opens.
Is there a threshold that carries a real consequence?
Yes — one, and it is documented with a stated penalty. Google Play treats user loss rate as a Core Value metric alongside DAU/MAU, and publishes a number.
From Google’s technical quality documentation, quoted exactly: "User loss rate is the ratio of users who uninstalled your app from all of their devices, compared to users who have your app installed on at least one active device. A device is considered active if it has been turned on in the past 30 days." Then the consequence: "If your user loss rate exceeds Play’s threshold of 5%, a warning may be shown on your store listing, and your app may not be eligible to appear on certain surfaces on Google Play."
Three things about that 5% are worth pinning down, because they are usually lost in retelling.
- The consequence is conditional and permissive in its wording. Google says a warning may be shown and the app may not be eligible for certain surfaces. That is not the same as an automatic penalty, and quoting it as one is a false statement.
- The definition here is the uninstall-only one. On this page, user loss rate is uninstalls from all devices over users with an active device. That reads differently from the Statistics page definition, which adds the inactivity clause. If you are managing to the threshold, manage to the definition on the page that names the threshold.
- It is not a benchmark. This is a quality bar Play applies to your app, not an industry average to position against.
DAU/MAU carries its own stated bar: when it "does not meet the 8% threshold for core value", the same warning-and-surface consequence applies. Both sit in the same family as the vitals thresholds — at least 1.09% of daily users hitting a user-perceived crash overall, or at least 8% for a single device model, and at least 0.47% of daily active users hitting a user-perceived ANR overall, or at least 8% for a single device model. Google’s stated effect for exceeding a bad behaviour threshold is that your app "is likely to be less discoverable on Google Play". We cover the full set in the vitals thresholds that decide distribution, and what it costs you in the acquisition tax bad vitals create.
Why do Firebase and Play disagree on uninstalls?
Because they count different packages, on different clocks, from different install sources — and Google documents the discrepancy rather than hiding it. If your Firebase uninstall count does not match Play Console, both are probably right.
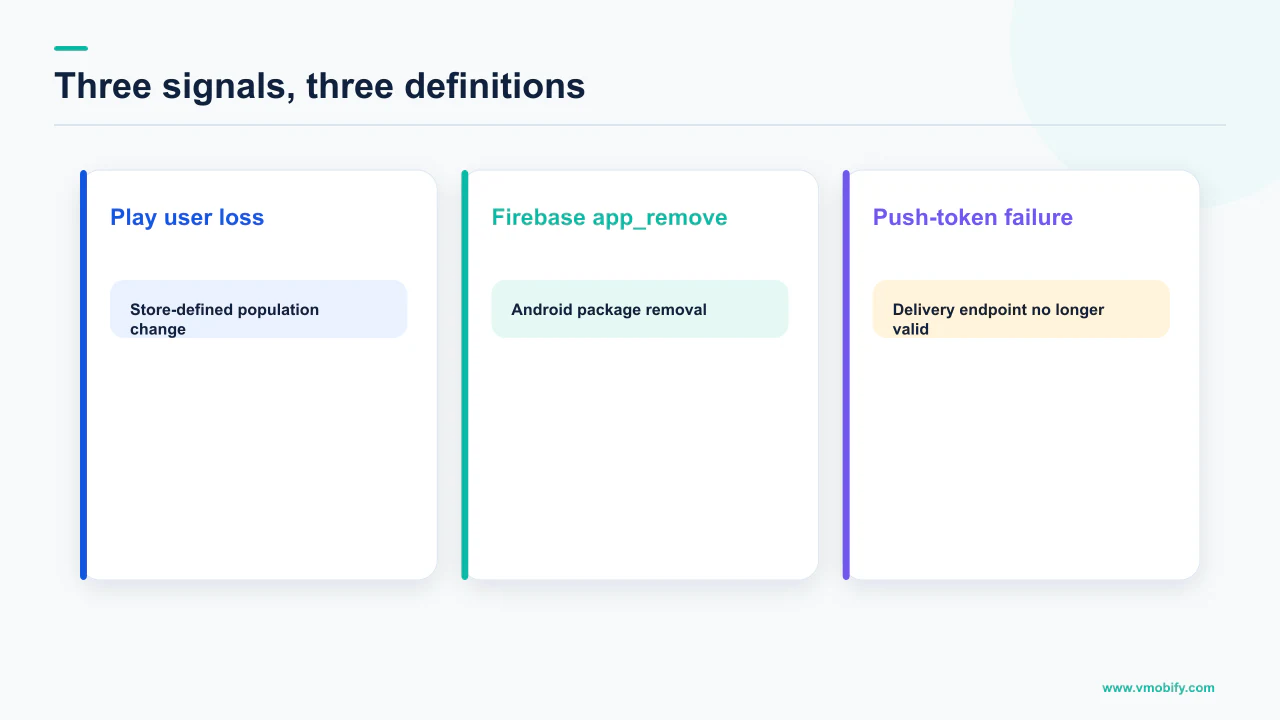
Google’s automatically collected events reference defines app_remove as firing "when an application package is removed (uninstalled) from an Android device", and marks it Android only. The page then spells out the mismatch directly: "The app_remove event counts the removal of application packages, regardless of the installation source, and the count changes depending on the date range you are using for the report. The Daily uninstalls by device and Daily uninstalls by user metrics count the removal of application packages only when they were installed from Google Play, and are reported on a daily basis."
Firebase app_remove
- Fires on package removal from an Android device
- Counts removals regardless of installation source
- Count changes depending on the report date range
- Android only — no iOS equivalent
Play daily uninstalls
- By device and by user, as separate metrics
- Counts removals only when installed from Google Play
- Reported on a daily basis
- Sits alongside user-level loss metrics
The install-source clause matters most in India and other markets where sideloading, OEM stores and preinstalls carry real volume. If a meaningful share of your base arrived outside Play, Firebase sees their removals and Play does not. That is a structural gap, not a bug, and no amount of reconciliation work will close it. Our guides to Indus Appstore and Xiaomi GetApps cover where that off-Play volume tends to come from.
The date-range clause causes more arguments. Because app_remove counts change with the range you select, the same week can report differently depending on when you query it. If you must trend both sources, fix the range and re-pull both on the same day.
The same class of problem shows up when installs and uninstalls appear to cross over entirely, which we unpack in why Play Console can show more uninstalls than installs.
Can you measure uninstalls on iOS at all?
Not the way you can on Android, and anyone selling you an exact iOS uninstall rate is selling you an inference. There is no documented App Store metric equivalent to Play’s user loss, and the analytics that do exist come with a consent condition attached.
Apple’s overview of reporting tools states the condition plainly: "App Analytics provides app developers with usage data collected from users who have agreed to share their diagnostics on devices running iOS 8 and later, macOS 11 and later, tvOS 9 and later, and visionOS 1 and later. To protect user privacy, App Analytics only shows data after a certain number of data points are available. App Analytics doesn’t include data from watchOS."
Three consequences follow, and they are not small:
- Your denominator is a self-selected subset. The population is users who agreed to share diagnostics. Any rate you compute over it is a rate over that subset, not over your users.
- Low-volume segments are suppressed. Apple only shows data once a certain number of data points exist, so exactly the small cohorts you most want to diagnose — one country, one device, one cohort week — are the ones most likely to be blank.
- Reinstalls muddy any net figure you build. Apple’s note on differences in reporting tools records that App Analytics excludes Restores — where a user restores an app to their device from a backup — from the Redownloads metric, while Sales and Trends includes Restores in its Redownload count. Two Apple tools, two counts, one app.
What is left is silence-based inference: a device that stops responding to push, or a user who stops appearing in your event stream. Both are indistinguishable from a user who disabled notifications or put the phone away for a fortnight. It is a directional signal, not an uninstall rate, and in our portfolio we do not present it as one. For a defensible iOS churn view, build it from your own logged-in activity data, where you control the definition — the approach we take in funnel analytics for apps.
What is a normal uninstall rate?
We are not going to print one, and you should be suspicious of the ones you have been shown. This is a deliberate omission, and the reasoning is more useful than the number would have been.
Every widely circulated uninstall benchmark we checked fails at least one of four tests, and most fail several:
- The definition is unstated. Device-level or user-level? Uninstall-only or inclusive of inactivity? Play-sourced installs only? A percentage with no definition is a decoration.
- The window is unstated. Thirty days after install, ninety, or lifetime? These differ by multiples, and the figure is usually quoted without any of them.
- The edition drifts. Vendor benchmark reports are reissued annually with different panels and methodologies. The same headline metric can move several points between editions covering adjacent years, and the version people quote is rarely the version they read.
- The panel is not your market. A global aggregate blends device price bands, storage constraints and category mixes that have nothing to do with a mid-market Indian fintech app.
We do not print a benchmark we cannot pin to a named source, a specific edition and a stated definition. Where a figure would not survive that test, we say so and write the claim directionally instead. A client who acts on an unpinned benchmark makes a real budget decision on a decorative number, and that is a worse outcome than an honest blank.
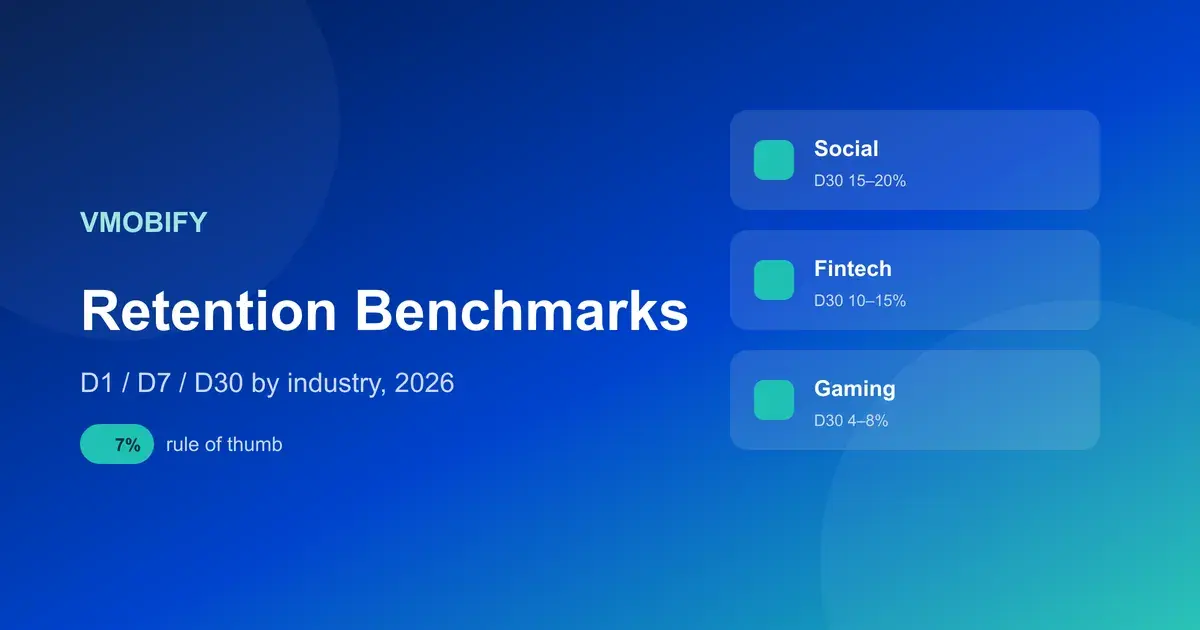
There is one number in this article you can act on with confidence, because it is published by the platform that enforces it: Play’s stated 5% user loss rate threshold, with the consequence that a warning may be shown on your store listing and your app may not be eligible to appear on certain surfaces. That is not a benchmark. It is a bar, on the definition given on Google’s own page, and it is a far more useful target than an industry average would be.
The second thing you can act on is your own history. Your uninstall curve by install cohort, source and device model tells you more in an afternoon than any cross-industry average, because it holds definition, market and product constant. Google’s statistics documentation suggests the comparison directly — your daily uninstall rate against the 30-day rolling average.
What actually drives uninstalls in the first week?
Technical failure, notification fatigue, and a first session that never reached the thing the user came for — roughly in that order of speed. The first two are measurable against documented thresholds. The third is the one that quietly does the most damage.
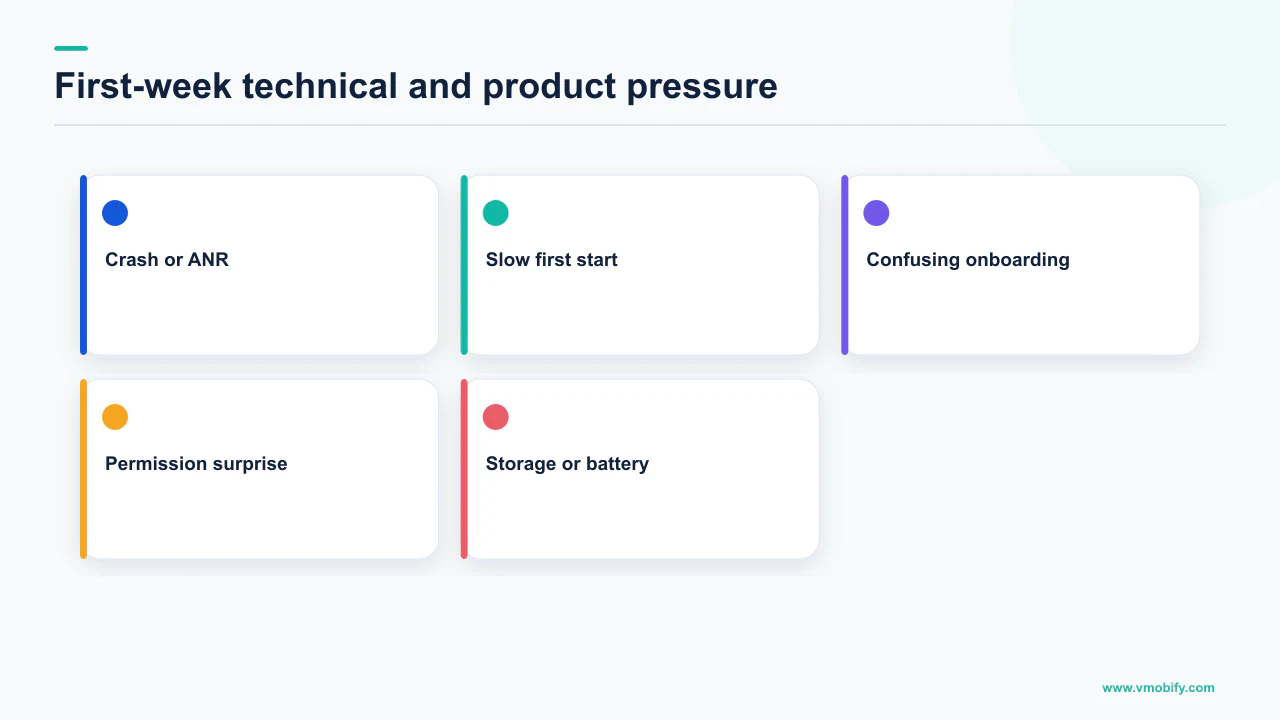
Stability is the fastest cause and the easiest to confirm. A user whose first session crashes has no investment to protect. Google’s bad behaviour thresholds give you the bar — 1.09% of daily users experiencing a user-perceived crash overall, or 8% for a single device model, and 0.47% of daily active users hitting a user-perceived ANR overall, or 8% for a single device model. The per-device figure is the one to segment on. A crash concentrated on one popular handset is invisible in your aggregate and obvious the moment you split by model, and it produces a cluster of uninstalls that no one describes as a crash.
Notification behaviour is the second cause, and the platform rules have teeth. Android’s notification runtime permission guidance is direct about the cost of asking badly: if your app targets 12L (API level 32) or lower and the user taps "Don’t allow" even just once, they are not prompted again until they uninstall and reinstall your app, or you update your app to target Android 13 or higher. And for apps that do get permission, Google’s stated caution is that users can see the number of daily notifications your app sends, and can revoke the permission at any time.
That combination sets the design constraint. If you target Android 13 or higher you control when the dialog appears, which means the request is yours to earn — ask after the user has seen why notifications would help, not on first launch. Our push strategy guide covers the sequencing, and in-app messaging versus push covers what to send in-session instead.
The third cause is the one your data will not label. A user who installs, opens once, never reaches the action they came for and removes the app four days later leaves no crash, no complaint and no review. The fix is not in the uninstall report at all — it is in the first-session funnel, which is why activation and the aha moment and onboarding design do more for this metric than anything you can build in analytics.
How do you cut the uninstall rate?
By fixing the two documented causes first, then attacking the undocumented one with product work — in that order, because the first two are cheap and provable. The sequence matters more than any individual tactic.
- Segment before you diagnose. Split uninstalls by device model, OS version, country and acquisition source, and do it before forming a hypothesis. Concentration is the whole signal. An even spread means a product problem; a spike on one model or one source means something specific and fixable.
- Clear the vitals thresholds. Get under 1.09% user-perceived crash rate overall and under 8% on every single device model, and under 0.47% user-perceived ANR overall with the same 8% per-model bar. This is the cheapest work on the list because the target is published and the fix is engineering, not judgement.
- Earn the notification permission instead of harvesting it. On Android 13 and higher the timing is entirely yours. Show the value first, ask second, and keep the daily volume defensible — users can see how many notifications you send and revoke at any time.
- Instrument the first session to the point of value. Define the single action that constitutes activation, measure the drop-off to it, and treat every step before it as removable until proven otherwise.
- Check what your acquisition is buying. A source that delivers installs with no intent produces uninstalls that look like a product failure. Compare uninstall curves by source before you rebuild onboarding — the cause may be upstream in the media plan.
- Give lapsing users a reason to return before they remove. The window between last session and uninstall is the only one where re-engagement and winback can work at all. Play reports returning users as their own metric rather than folding them into new acquisitions, so a genuine win-back is visible if you look for it.
Step one. Teams jump to onboarding redesigns because that is the interesting work, and discover months later that the uninstalls were concentrated on two device models and one paid source. Segmentation is an afternoon. A redesign is a quarter. Do the afternoon first.
Worth stating plainly: none of this touches Play’s inactivity clause. If a share of your user loss is device deactivation, no product change will move it. Isolate that share and stop reporting it as churn.
How should you report this without misleading anyone?
Name the source, the definition and the window every time the number appears — and report the device-level and user-level figures separately rather than blending them. A metric this contested cannot be reported as a bare percentage.
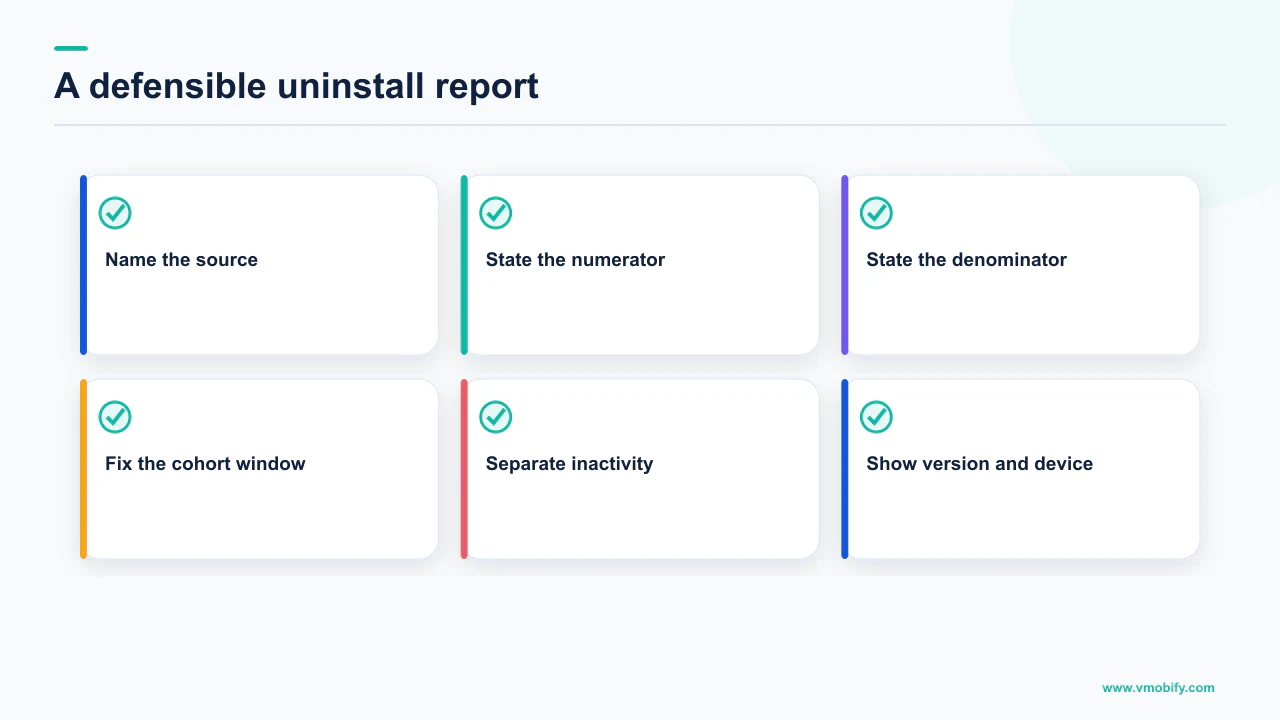
A defensible line in a board pack reads: "Play user loss rate, as defined on Google’s technical quality page — uninstalls from all devices over users with an active device — was X% this month against Play’s stated 5% threshold." Longer than "uninstall rate: X%", and the only version that survives being checked.
Three habits make the difference between a number people trust and a number people argue about:
- Never blend Firebase and Play into one series. They count different install sources and Firebase changes with the report date range. Keep them as two lines with two labels, and explain the gap once rather than reconciling it every month.
- Report iOS churn under a different name. It is inferred inactivity from your own event data over a consent-limited population. Never put it in the same column as an Android uninstall rate.
- Carry the conditions with the numbers. Every threshold in this article has a condition attached: the 8% vitals figures apply to a single device model, the 5% loss rate is measured against users with a device turned on in the past 30 days, and Play’s consequences are stated as things that may happen. A conditional threshold quoted unconditionally is a false statement, and someone will eventually check.
The underlying point is that uninstall rate is a diagnostic input, not a scorecard. It is nearly useless as a target in isolation — it is definitionally unstable across tools, and its largest component on Play may be device churn you cannot influence. Pair it with stickiness, covered in DAU/MAU and what the 8% bar means, and with cohort retention.
If your uninstall numbers disagree across consoles and you need someone to tell you which one is answering your question, that is usually a short conversation for anyone who has read the definitions — send us the two figures and the date range, or see how we approach measurement in our analytics work.
Frequently Asked Questions
What is a good app uninstall rate?+
We will not quote one, because the circulating benchmarks do not state their definition, window or source edition, and vendor reports move between editions. The number worth managing to is Play's own bar: Google states that if your user loss rate exceeds Play's threshold of 5%, a warning may be shown on your store listing and your app may not be eligible to appear on certain surfaces. Compare against your own cohorts for everything else.
Does Google Play count a user as lost if they never uninstalled?+
Yes, in the Statistics report. Google defines User loss as the number of users who uninstalled your app from all of their devices or stopped using any devices that your app is installed on for over 30 days, making them inactive and counting as deactivation. A user who switched to a new phone is counted, even though they made no decision about your app.
Why does Firebase show different uninstall numbers from Play Console?+
Because they count different things and Google documents this. The app_remove event counts the removal of application packages regardless of the installation source, and its count changes depending on the date range you use for the report. The Daily uninstalls by device and Daily uninstalls by user metrics count removals only when the app was installed from Google Play, and are reported daily. app_remove is Android only.
Can I track uninstalls on iOS?+
Not with a platform metric equivalent to Play's. Apple states that App Analytics provides usage data collected from users who have agreed to share their diagnostics, only shows data after a certain number of data points are available, and does not include watchOS data. What teams call an iOS uninstall rate is inferred from push failures or event silence, which cannot be distinguished from a user who disabled notifications or put the device away.
What happens if my user loss rate goes above 5%?+
Google's stated consequence is conditional: a warning may be shown on your store listing, and your app may not be eligible to appear on certain surfaces on Google Play. It is not described as an automatic removal or ranking penalty. The same warning-and-surface language applies when DAU/MAU does not meet the 8% threshold for core value.
Does high retention mean users are actually using the app?+
Not necessarily. Google defines Retained installers as installers who kept your app on at least one of their devices for the number of days shown, and adds that installation does not mean the app was opened over this period. An app can score well on retained installers while nobody opens it, which is why activation and session data belong next to any retention figure.
Which uninstall metric should I report to my board?+
One clearly labelled figure with its source, definition and window attached, kept separate from every other source. Report the Play user loss rate against Play's 5% threshold, keep Firebase app_remove as a separate line because it counts a different install-source population, and report any iOS view under a different name entirely. Never blend them into a single percentage.
Sources
- View app statistics - Play Console Help — Definitions of User loss, Installed audience, User acquisitions, Loss rate and the 30-day inactivity clause.
- Monitor your app's technical quality with Android vitals - Play Console Help — User loss rate as a Core Value metric, Play's 5% threshold, the DAU/MAU 8% bar, and crash and ANR bad behaviour thresholds.
- Measure your app's acquisition and retention - Play Console Help — Retained installers definition and the note that installation does not mean the app was opened.
- Automatically collected events - Firebase Help — app_remove is Android only, counts removals regardless of install source, and differs from Play daily uninstall metrics.
- Overview of reporting tools - App Store Connect — App Analytics covers users who agreed to share diagnostics, needs a minimum number of data points, and excludes watchOS.
- Differences in reporting tools - App Store Connect — App Analytics excludes Restores from Redownloads while Sales and Trends includes them.
- Notification runtime permission - Android Developers — A single Do not allow tap on apps targeting 12L or lower blocks re-prompting until reinstall or a target update; users can revoke at any time.
About the author
Amol Pomane — Founder, Vmobify
Amol leads Vmobify, a mobile app growth agency that has driven 30M+ downloads and ranked 54K+ keywords across 300+ apps since 2013. He writes about ASO, paid user acquisition, retention, and the operational reality of scaling mobile apps in India and global markets.