Bad Vitals Are a UA Tax: What Crashes Cost You
Nobody puts crash rate on the growth dashboard, so nobody sees it charging rent. Google reduces the visibility of apps that cross its published thresholds, can put a warning on the store listing visitors are reading, and says outright that a larger app hurts install success. Every one of those raises what you pay for a user — and Google Ads itself tells advertisers to go and check vitals.

On this page
- Why is technical quality an acquisition problem?
- What exactly does Google do when you cross a threshold?
- Where does the cost actually enter?
- Does crash rate affect your Google App campaign directly?
- How does app size tax you at the moment of install?
- Why does startup time end up in your ratings?
- What should you fix first if you are spending on UA?
- What margin should you run below Google’s thresholds?
- How do you put a number on the tax for your own app?
- Frequently Asked Questions
Why is technical quality an acquisition problem?
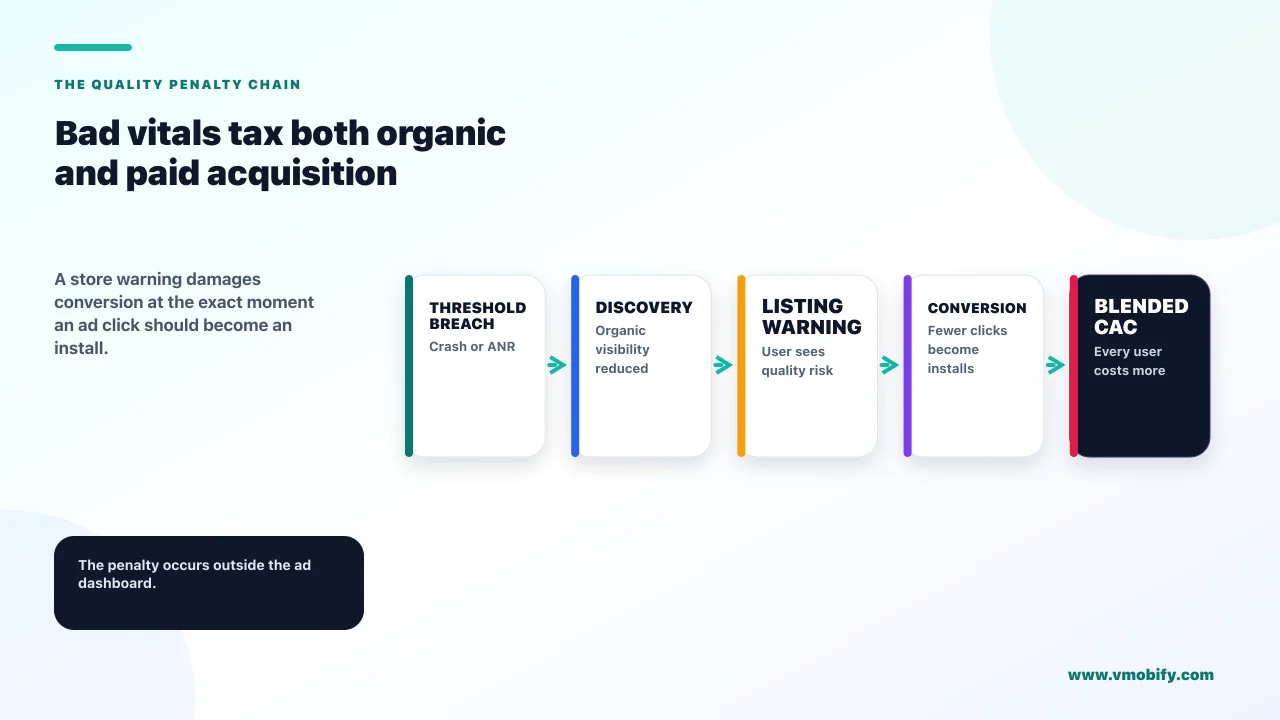
Because Google has made it one explicitly — poor vitals reduce your visibility on the Play Store and can put a warning in front of the people your ads just paid to send there. Crash rate is not only an engineering metric. It sits directly in the path between your spend and your installs.
Google states the mechanism plainly in its Android vitals documentation: if your app or game exceeds a bad behaviour threshold, Play may reduce the visibility of your title, and Play may also show users a warning on your store listing. The same page states that your app's core vitals affect your app's visibility on Google Play.
Read that second consequence as a marketer rather than as an engineer. You are buying clicks to a page, and Google reserves the right to put a quality warning on that page. Every rupee of paid traffic then lands on a listing actively arguing against installation. There is no bid that compensates for that.
Across the 300+ apps we have managed since 2013, technical quality is the most under-attributed driver of acquisition cost we encounter. It never appears in the growth review because it belongs to a different team, and its effects arrive as a worse conversion rate that gets blamed on creative.
A crash rate above threshold is not a bug backlog item. It is a permanent surcharge on every install you buy, applied silently, that compounds for as long as it goes unfixed.
What exactly does Google do when you cross a threshold?
Two things, both published: it may reduce your discoverability, and it may display a warning on your store listing. These are different penalties with different commercial consequences, and the second one is far more expensive for anyone running paid acquisition.
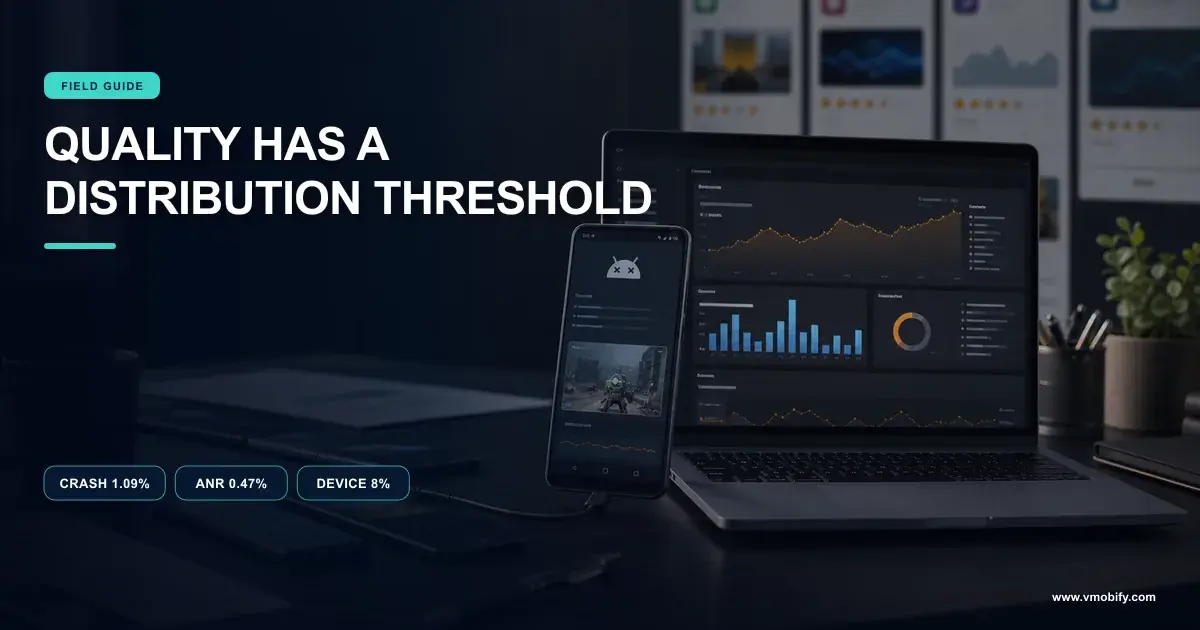
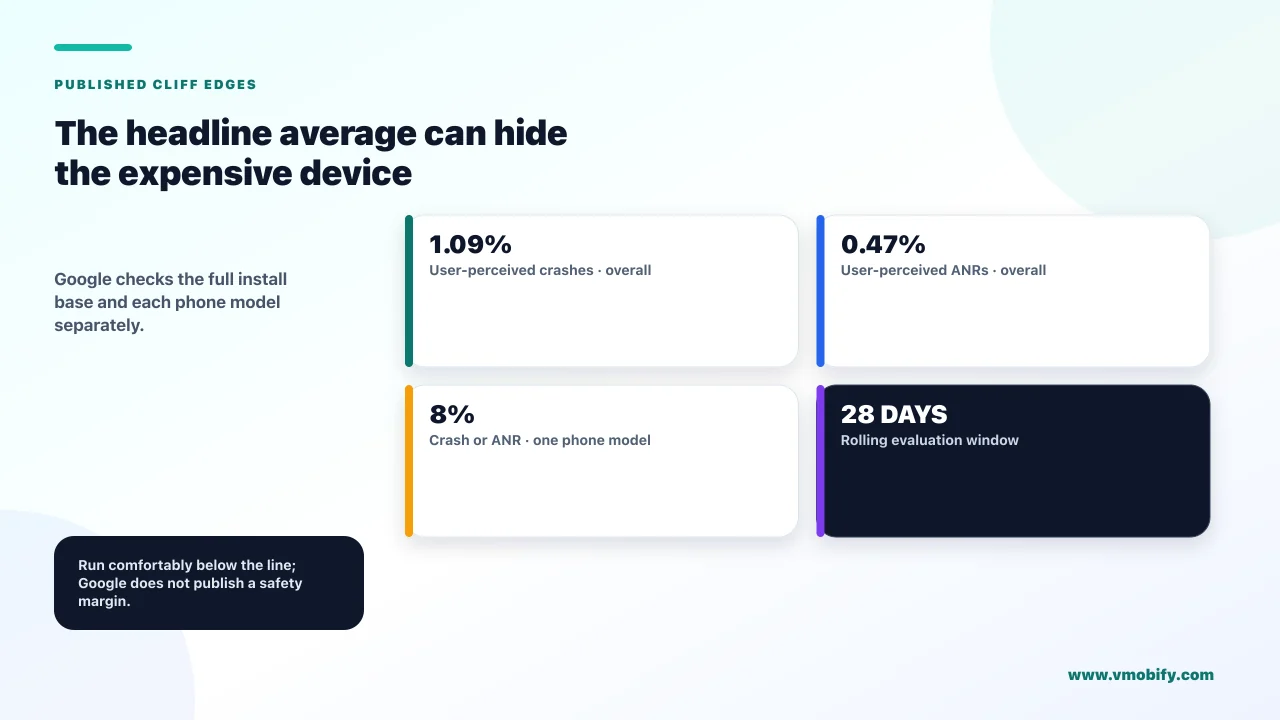
The thresholds themselves are specific. Google's Play Console guidance on monitoring technical quality sets a user-perceived crash rate bad behaviour threshold at 1.09% of daily users across all device models, and 8% for a single device model. The user-perceived ANR rate threshold is 0.47% of daily active users across all models, and 8% for a single device model.
The per-device threshold deserves attention from anyone selling into India, because it is how a fundamentally healthy app gets penalised. An app can sit comfortably under 1.09% overall while a single popular budget handset crashes for 8% of its users. That device is often a meaningful share of your addressable market, and the problem is invisible in the headline number.
The distinction between the two penalties is what matters commercially. Reduced discoverability costs you organic installs, which is painful but slow. A warning on the store listing degrades the conversion rate of every visitor including the ones you paid for, which is immediate and applies to your whole media budget at once. Our piece on the vitals thresholds that decide distribution covers the engineering response in detail.
Where does the cost actually enter?
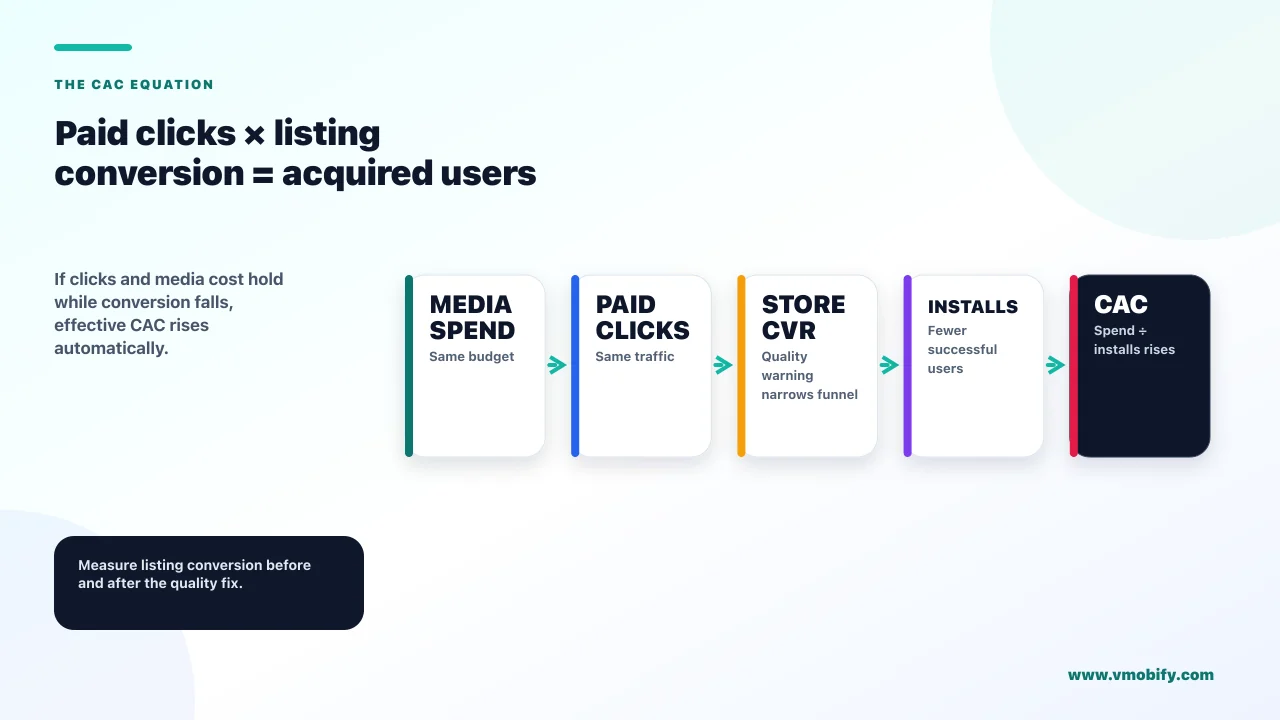
Through store listing conversion rate, which is the multiplier sitting between every click you buy and every install you get. This is the whole mechanism, and once you see it the tax becomes arithmetic rather than theory.
Your effective cost per install is the price of a click divided by the share of clickers who install. Nothing in your campaign settings changes the denominator. The store listing does, and Google's quality signals act directly on it:
- A warning on the listing lowers conversion. Google says it may display one when you exceed a threshold. A visitor reading a quality warning is less likely to install, and you have already paid for that visitor.
- Reduced visibility removes your cheapest installs. Organic installs cost nothing. Losing them raises your blended acquisition cost even if your paid CPI never moves — the number your board sees gets worse while every campaign metric looks unchanged.
- Poor quality suppresses ratings, and ratings are on the listing. The rating is one of the most prominent conversion elements on the page, and it is downstream of the experience your app delivers.
- Uninstalls destroy the downstream signal your bidding depends on. Campaigns optimising toward in-app actions need those actions to happen. An app that crashes before users reach the event starves the optimiser, which is a second-order cost on top of the first.
That fourth point is why bad vitals and rising CPI so often arrive together and get diagnosed separately. The campaign looks like it is degrading. It is responding correctly to a product that stopped producing the signal it was optimising for. Our diagnostic on why a Google App campaign stops spending covers the campaign-side symptoms this produces.
Does crash rate affect your Google App campaign directly?
No documentation says crash rate is an input to bidding or delivery — but Google Ads itself tells advertisers to go and check Android vitals when a campaign underperforms, which is as close to an official acknowledgement of the link as exists. We are careful about this claim because the popular version of it is stronger than the evidence supports.
Google's help page on troubleshooting App campaign performance fluctuations lists ten common reasons for performance to move: recent changes to account or campaign settings, conversion tracking setup and delay, bids and bid targets, budget settings, low creative coverage and diversity, targeting settings and overlaps, policy and ad review status, app status, other account issues, and auction dynamics.
Under app status, the guidance is direct: check Android vitals in the Google Play Console for technical issues such as high crash rates or Application Not Responding errors. That is the advertising product pointing advertisers at the Play Console's quality dashboard as a diagnosis for campaign performance.
What it is not is a statement that crash rate feeds the auction. We have not found any Google documentation making that claim, and we do not make it here. The honest formulation is that the chain is indirect and every link in it is documented — vitals affect visibility and listing presentation, those affect conversion, and conversion affects what an install costs. You do not need a direct bidding signal for the tax to be real.
Claiming "Google penalises your CPI for crashes" is easy to disprove and will lose you the argument with an engineering lead who reads the docs. Claiming "Google may reduce our visibility and warn visitors on our listing, and Google Ads tells us to check vitals when campaigns fluctuate" is accurate, cited, and much harder to wave away.
How does app size tax you at the moment of install?
By adding friction at the exact moment your paid click is converting — and Google says directly that increasing size can negatively impact install success and increase uninstalls. Size is the one quality dimension whose cost lands entirely inside the acquisition funnel.
Google's guidance on reducing your app size states that increasing your app's size can negatively impact install success and increase uninstalls, and recommends reducing download size as much as possible. Play Console's own size guidance goes further, stating that app size is an important aspect of technical quality that can affect your app's install and uninstall metrics.
Two concrete mechanisms make this real rather than advisory:
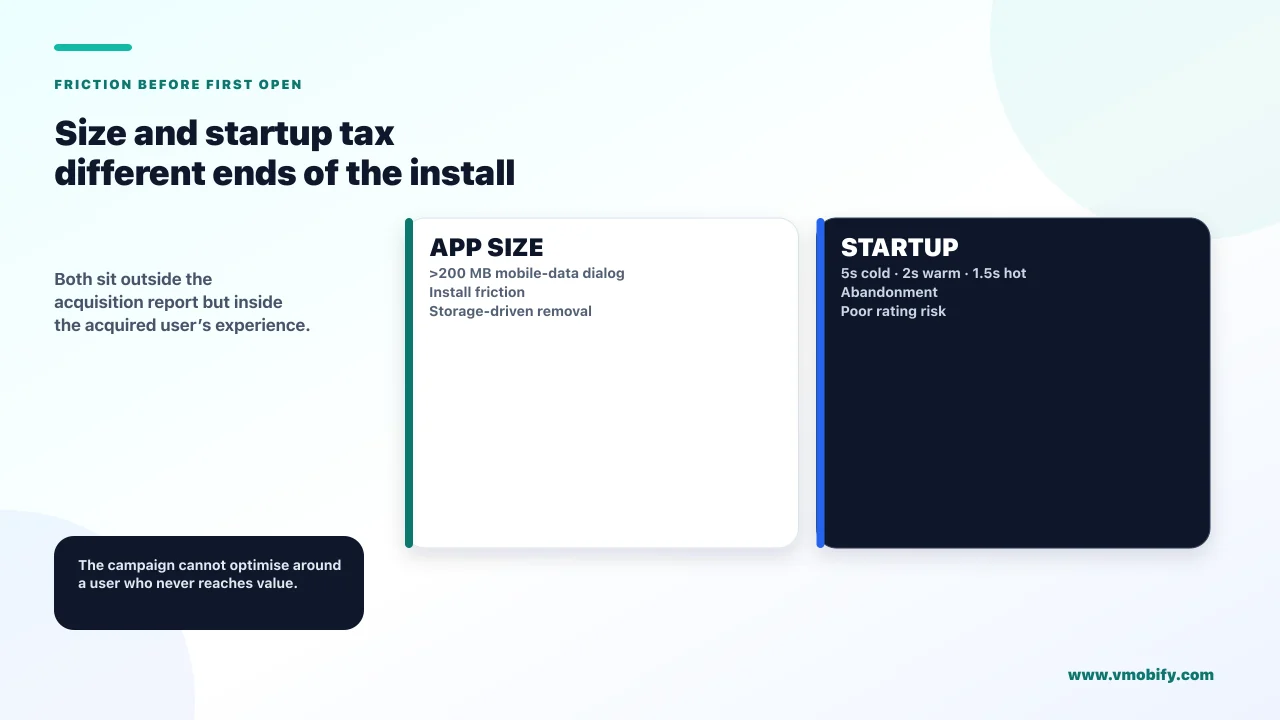
- The mobile-data dialog. Google documents that if your app is above 200MB, users on a mobile data connection see a non-blocking dialog when installing from Google Play informing them of the app's large size. That is an interstitial between your paid click and your install, shown to exactly the users least able to absorb a large download.
- Storage pressure, which you can measure. Play Console reports "Active devices with under 2GB free" and "Uninstalls on devices with under 2GB free" as separate figures. If the second is disproportionate to the first, size is costing you retained users in your specific install base rather than in general.
We deliberately publish no percentage here. The widely-repeated figures linking each additional few megabytes to a specific drop in install conversion all trace back to a single Google Play post that is not reachable, and we could not confirm the wording, sample or year. The direction is documented by Google; the numbers in circulation are not, so they do not appear in our work.
One live oddity worth knowing if you are near the limit: Google's own pages disagree on the app bundle ceiling, with the size-reduction page stating a 200MB compressed download restriction while the App Bundle FAQ states a 500MB maximum for a base module, exceeded via Play Asset Delivery or Play Feature Delivery. We cover that contradiction and what to do about it in our vitals article.
Why does startup time end up in your ratings?
Because Google says so — slow startup can cause a user to rate your app poorly on the Play Store or abandon it altogether, and your rating is one of the most prominent conversion elements on the listing you are buying traffic to. This closes the loop between an engineering metric and a marketing one.
Google's documentation on app startup time defines excessive startup as 5 seconds or longer for a cold start, 2 seconds or longer for a warm start, and 1.5 seconds or longer for a hot start, measured as Time to Initial Display — the time to display the first frame of the app's UI.
The reasoning it gives is the useful part: users expect apps to load fast and be responsive, an app with a slow start time does not meet this expectation and can disappoint users, and this sort of poor experience can cause a user to rate your app poorly on the Play Store or even abandon your app altogether. It adds that faster startups lead to more sustained interaction and fewer early exits.
For a paid acquisition team this is the most actionable sentence in the whole vitals corpus, because cold start is the first experience every single acquired user has. You paid for that moment. A five-second cold start on a mid-range Android handset is where a meaningful share of your media budget quietly stops converting into anything — and unlike a crash, it produces no error, no report and no ticket.
Cold start on a flagship developer handset tells you nothing about the experience you are buying. Measure Time to Initial Display on the cheapest device in your top three by install volume. In our portfolio that number is routinely two to three times worse than the one the team believed, and nobody had checked because nobody owned the metric.
What should you fix first if you are spending on UA?
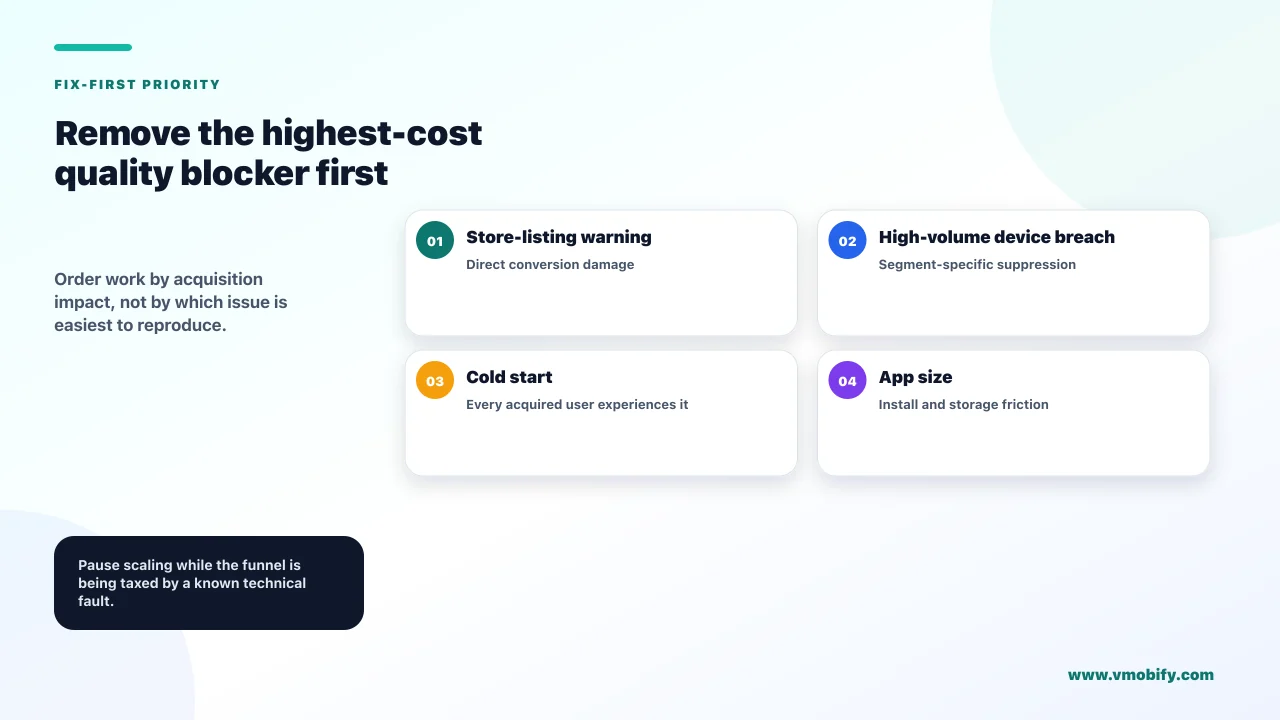
Anything that triggers a store-listing warning, then anything that hits a single high-volume device model, then cold start, then size. The order is set by how directly each one touches the money you are already spending.
- Get under the bad behaviour thresholds. A warning on the listing degrades conversion for every visitor you buy, so this is the only item on the list that taxes your entire media budget simultaneously. Nothing else competes with it.
- Fix the worst single device model. The 8% per-model threshold means one popular handset can penalise you while your overall numbers look fine. Sort crashes by device and check your install mix against that list — if the device failing you is a top-three device in your market, this is your highest-leverage fix.
- Attack cold start. It is the first experience of every acquired user and the one Google explicitly links to poor ratings and abandonment. It also produces no error signal, so it will never surface on its own.
- Then size. Real, documented, and the slowest of the four to move. Worth doing, rarely worth doing first.
The sequencing argument to make internally is a financial one rather than a technical one. If you are spending meaningfully on acquisition every month, a quality problem that suppresses conversion is consuming a percentage of that spend continuously. Engineering time spent on it has a return you can actually estimate, which is more than can be said for most backlog items competing for the same sprint.
This is also why we treat product quality and acquisition as one workstream rather than two in our user acquisition work. A campaign optimised on top of a listing carrying a quality warning is optimising the wrong variable.
What margin should you run below Google’s thresholds?
Comfortably below, and treat the published figures as a cliff edge rather than a target — but be clear that any specific safety margin is a recommendation and not a Google threshold. The distinction matters because plenty of content presents invented margins as official numbers.
Google publishes exactly two overall figures: 1.09% for user-perceived crash rate and 0.47% for user-perceived ANR rate, with 8% per device model. Those are the points at which the documented consequences may apply. They are not quality goals, and Google does not publish a recommended operating level.
Our recommendation, as an agency and not as a Google rule, is to treat roughly half the published threshold as your operating ceiling and to alert when you approach it. The reasoning is practical rather than statistical: these are averaged measures, a single bad release can move them faster than you can ship a fix, and the penalty for crossing lands on your acquisition spend rather than on your engineering roadmap. You want the alert to fire while you still have room, not after the consequence has arrived.
Two operational notes make that workable. Play assesses these metrics on a 28-day basis, so both the deterioration and the recovery are slow — you cannot ship a fix on Friday and expect the warning gone on Monday. And because the per-model threshold is far higher than the overall one, a device-level alert needs its own monitoring rather than being inferred from the headline figure.
If you are already over a threshold and running paid acquisition, the honest sequencing is to reduce spend while you fix rather than to spend through it. You are buying traffic to a page that Google may be warning people away from, and that is the one situation where pausing is cheaper than optimising.
How do you put a number on the tax for your own app?
Measure your own store listing conversion rate before and after a quality change, rather than importing anyone's benchmark — including ours. The tax is real and its size is specific to your app, your market and your device mix.
- Record store listing conversion now. Play Console gives you store listing visitors and acquisitions. That ratio is the multiplier the whole argument turns on.
- Record the storage-pressure split. Uninstalls on devices with under 2GB free, against active devices in that state. This turns the size question into a measurement instead of a debate.
- Record your worst device model. Crash and ANR rate for your top three devices by install volume, checked against the 8% per-model threshold rather than the overall one.
- Ship the fix, then wait out the 28-day window before reading the result. Anything you conclude sooner is noise.
- Compare conversion, blended CPI and retention across the two periods. The gap is your tax, in your own currency, defensible in your own board pack.
Do this once and the argument for quality work stops being a matter of engineering conviction and becomes a line item with a return. In our experience that is the only version of this argument that survives contact with a roadmap prioritisation meeting.
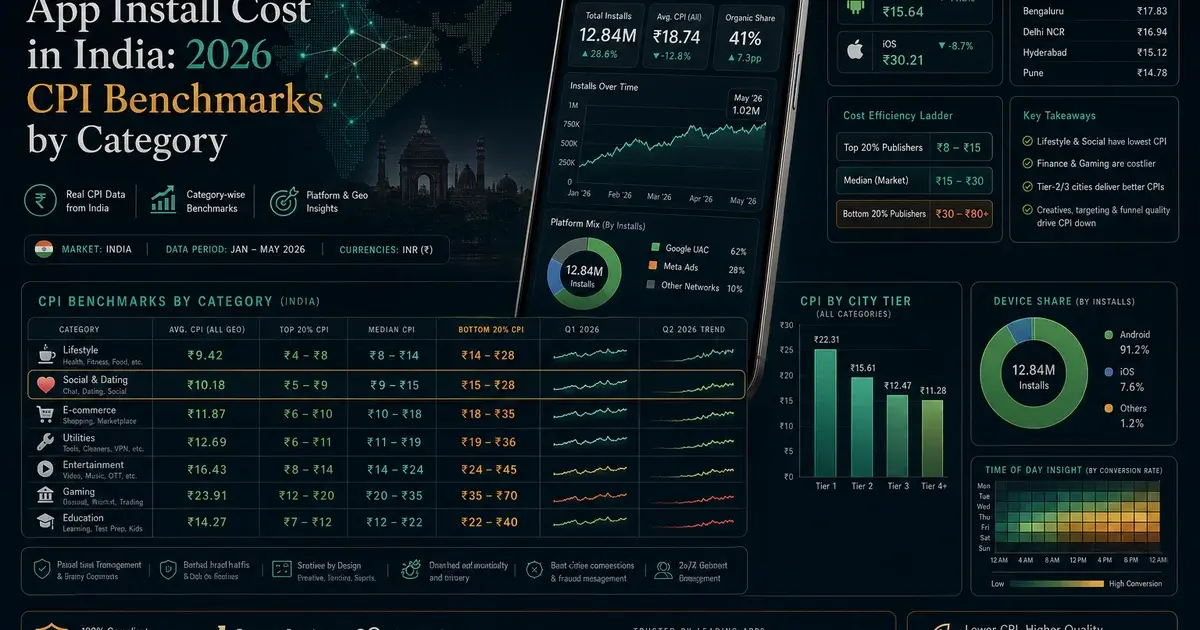
It is also worth checking the retention side at the same time, since the same causes drive both — our piece on why Play Console shows more uninstalls than installs covers how to read those numbers without being misled by the definitions, and what an install actually costs in India covers the benchmarking context. If you want a second opinion on whether quality is what is moving your CPI, send us the two numbers and we will tell you what we would check.
Frequently Asked Questions
Does a high crash rate actually increase my cost per install?+
Indirectly, and every link is documented. Google may reduce your visibility and show a warning on your store listing, which lowers the conversion rate between clicks you buy and installs you get, which is what determines effective CPI. No Google documentation says crash rate feeds the ad auction, and you should not claim that it does.
What are the Android vitals thresholds I need to stay under?+
A user-perceived crash rate of 1.09% of daily users across all device models and 8% for a single device model, and a user-perceived ANR rate of 0.47% of daily active users across all models with 8% for a single model. Play assesses these on a 28-day basis, so both damage and recovery are slow.
My overall crash rate is fine but one device is bad. Does that matter?+
Yes, and it is a common way to get penalised while looking healthy. The per-device-model threshold is 8%, so a single popular handset can breach it while your overall rate sits comfortably under 1.09%. If that device is significant in your install mix, it is usually the highest-leverage fix available.
How much does app size affect installs?+
Google states that increasing your app’s size can negatively impact install success and increase uninstalls, and that above 200MB users on mobile data see a dialog about the app’s size at install. We do not publish the per-megabyte conversion figures that circulate widely, because the primary Google source for them is not reachable and the numbers cannot be confirmed.
Is there a recommended crash rate to aim for below Google’s threshold?+
Google does not publish one. Our own recommendation, as an agency rather than as a Google rule, is to operate at roughly half the published threshold and alert on approach — because the metrics are averaged over 28 days, a single bad release moves them faster than you can ship a fix, and the penalty lands on acquisition spend.
Should I pause paid spend while fixing a vitals problem?+
If you are already over a threshold, usually yes. You are buying traffic to a listing Google may be warning visitors about, and no bid or creative change compensates for that. It is the one situation where pausing is cheaper than optimising.
How do I prove the cost of this internally?+
Measure your own store listing conversion rate, storage-pressure uninstall split and worst device model before the fix, ship it, wait out the 28-day assessment window, then compare conversion, blended CPI and retention. That produces a defensible number for your app rather than a borrowed benchmark.
Sources
- Android Developers — Android vitals overview — Play may reduce visibility and show a store listing warning; core vitals affect visibility.
- Google Play — Monitor technical quality with Android vitals — The 1.09% crash, 0.47% ANR and 8% per-model thresholds.
- Google Ads — Troubleshoot App campaign performance fluctuations — The ten causes, and the instruction to check Android vitals under app status.
- Android Developers — Reduce your app size — Increasing size can negatively impact install success and increase uninstalls.
- Android Developers — App startup time — Cold, warm and hot thresholds, and the stated link to poor ratings and abandonment.
- Google Play — Optimize your app’s size — Size affects install and uninstall metrics; the 200MB mobile-data dialog; storage-pressure metrics.
- Android Developers — Android App Bundle FAQ — The 500MB base module limit and Play Asset or Feature Delivery for exceeding it.
About the author
Amol Pomane — Founder, Vmobify
Amol leads Vmobify, a mobile app growth agency that has driven 30M+ downloads and ranked 54K+ keywords across 300+ apps since 2013. He writes about ASO, paid user acquisition, retention, and the operational reality of scaling mobile apps in India and global markets.
Model an install budget
Turn CPI and activation assumptions into acquisition scenarios.
Open free tool