Why Play Console Shows More Uninstalls Than Installs
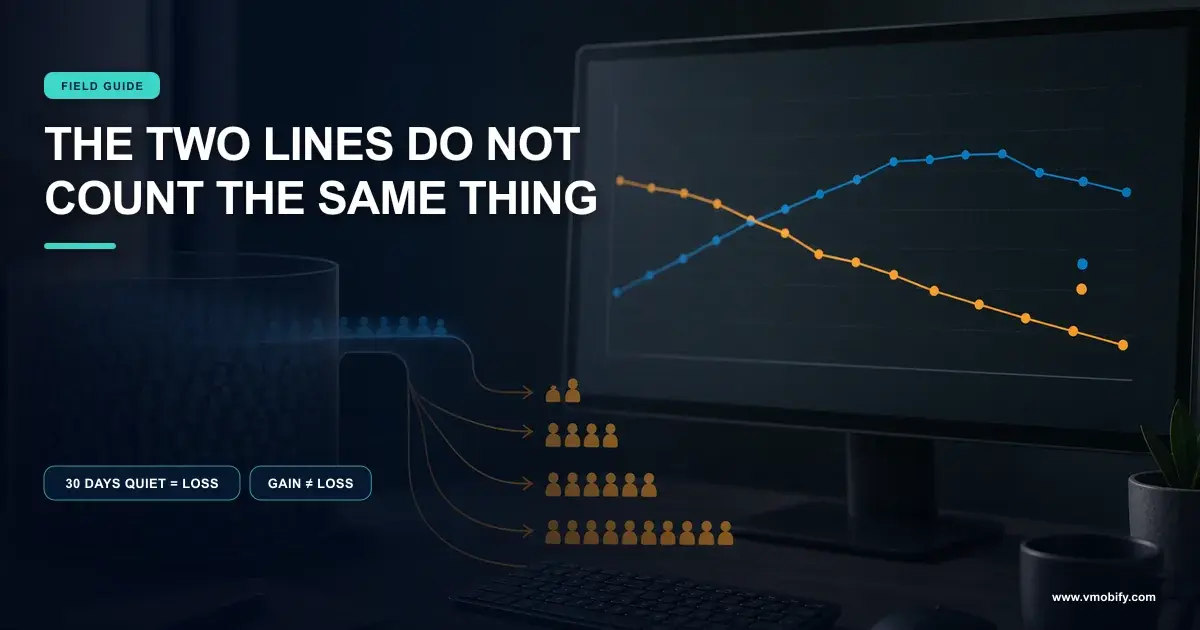
The chart says you lost more users than you gained, and your app is not dying. Play Console counts a device that has simply gone quiet for 30 days as a loss, and counts an acquisition far more strictly than it counts a departure. Both definitions are published. Once you read them, the crossing lines stop being alarming and start being useful.
On this page
- How can uninstalls exceed installs at all?
- What does Play actually count as a loss?
- Why is your install number smaller than you think?
- Did something change to make this look worse?
- Why does Apple not show you this number at all?
- How do MMPs detect uninstalls, and what do they miss?
- Which causes show up in Play Console’s own data?
- Which number should you actually track?
- When is this genuinely a problem?
- Frequently Asked Questions
How can uninstalls exceed installs at all?
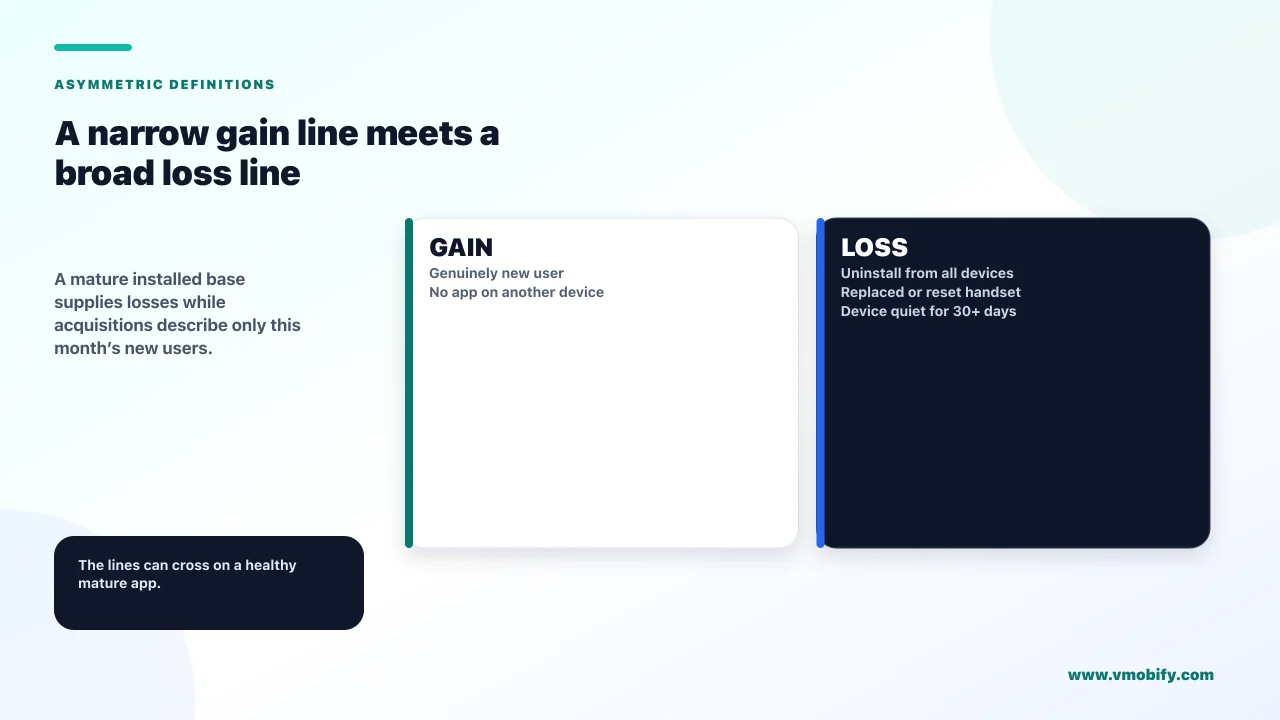
Because Play Console applies a strict definition to what counts as gaining a user and a loose one to what counts as losing them — and because a device that simply goes quiet is counted as a loss. The lines can cross on a perfectly healthy app, and in a mature app with a large install base they eventually will.
The asymmetry is structural, not accidental. A gain has to be a genuinely new user. A loss can be a phone that was replaced, reset, or left in a drawer. Those are not comparable events, and the chart plots them against each other anyway.
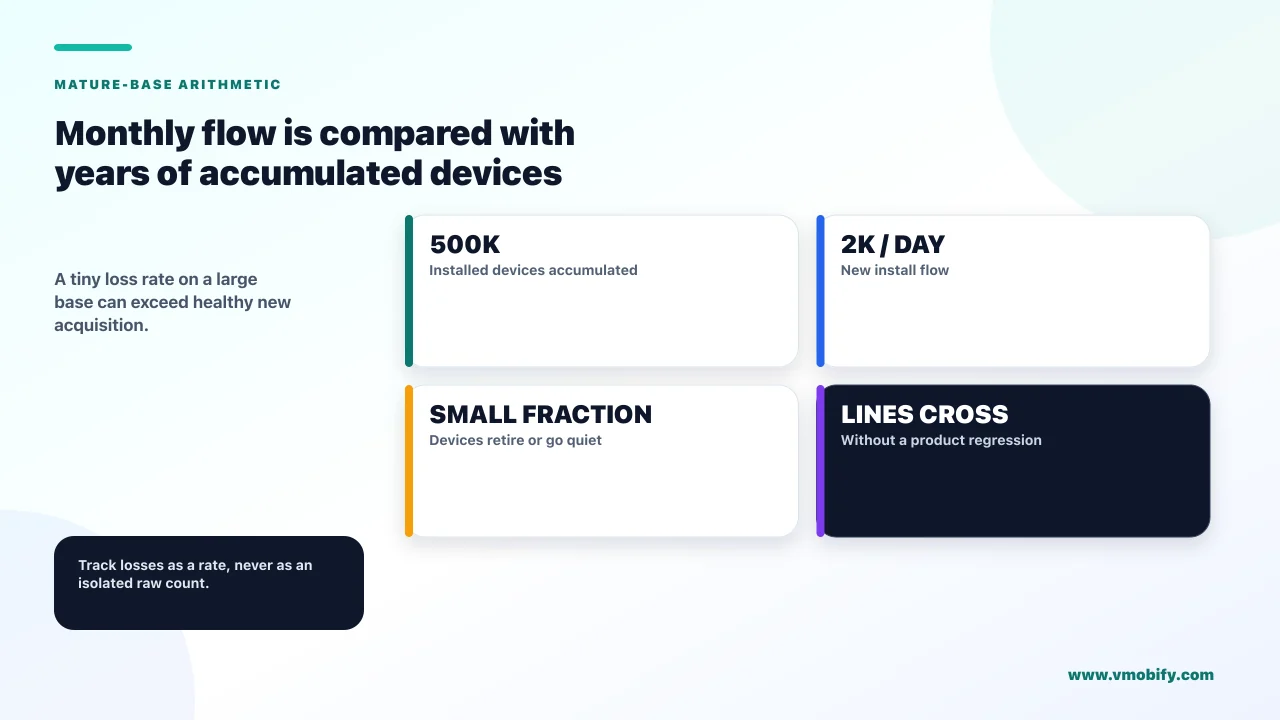
There is also a base-rate effect that makes this inevitable over time. New installs are a flow that depends on your marketing this month. Losses are drawn from an install base accumulated over years. An app with 500,000 installed devices and 2,000 new installs a day does not need anything to go wrong for daily losses to exceed daily gains — it only needs a small fraction of a large accumulated base to retire their handsets.
In our portfolio this chart causes more unnecessary alarm than any other single number in Play Console, and it is nearly always raised by someone reading it for the first time before a board meeting. The correct response is to read the definitions, which Google publishes, and then to look at the metrics that actually answer the question being asked.
Play counts 30 days of device silence as a loss. It does not count a returning user or a second device as a new acquisition. You are comparing a strict numerator against a generous denominator, on an install base far larger than your monthly install flow.
What does Play actually count as a loss?
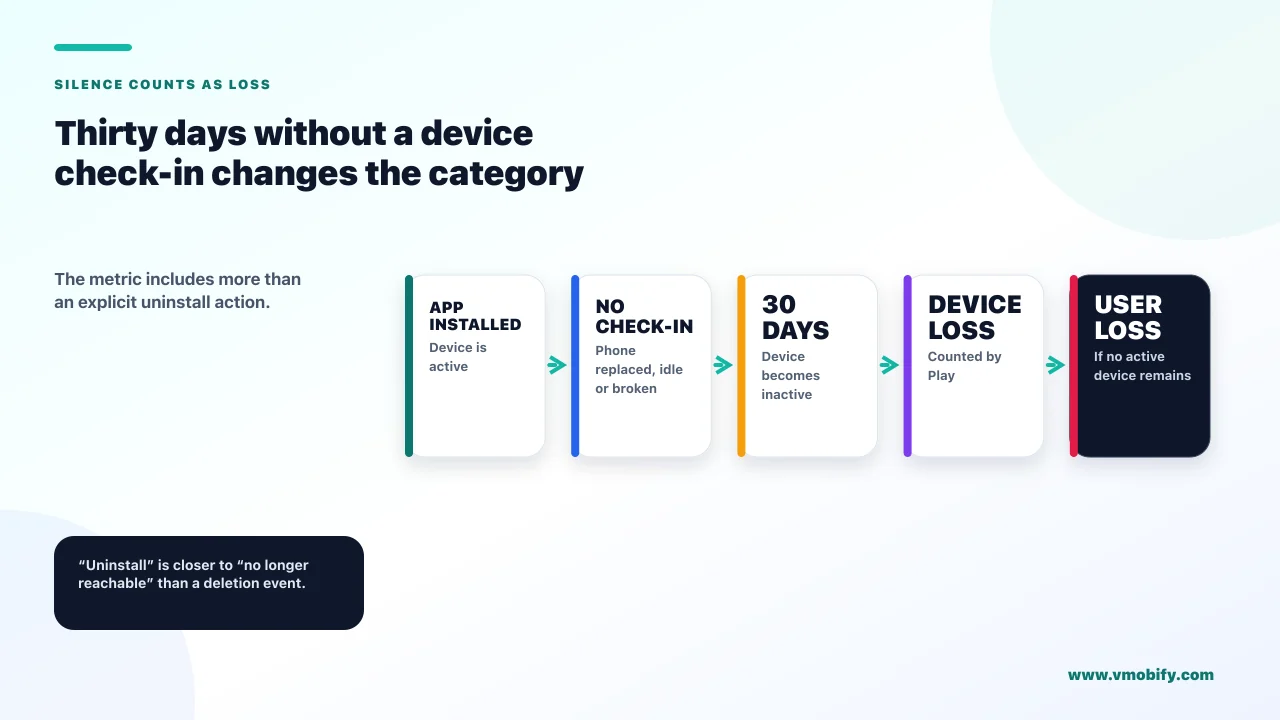
Not just uninstalls — Google's own definitions fold long inactivity into both of its loss metrics, which means "uninstalls" on your chart include people who never uninstalled anything. This is the single fact that resolves the whole question, and it is stated plainly in Google's documentation.
From Google's page on viewing app statistics, quoted exactly:
- User loss is "the number of users who uninstalled your app from all of their devices or stopped using any devices that your app is installed on for over 30 days".
- Device loss is "the number of devices from which users uninstalled your app. This includes when a device has not been used in over 30 days".
Read those clauses again. A user who buys a new phone and leaves the old one in a drawer generates a device loss on the old handset. A user whose phone breaks generates a loss. A second, rarely-used tablet that goes a month without being switched on generates a loss. In none of those cases did anyone decide to remove your app.
The same definitional logic runs through the install base: it is "the number of active devices on which your app is installed", where an active device is "one that has been turned on at least once in the past 30 days". Play's whole model treats a device that has not checked in for a month as gone. That is a defensible modelling choice — it just is not the same thing as an uninstall, despite what the chart label implies.
Where secondary handsets, shared devices and older hardware are common — which describes much of the India install base we work with — the share of "losses" that are really device retirement is higher. An app with an identical uninstall rate will look worse in Play Console in those markets than in a single-flagship-phone market. Do not compare your loss chart against a competitor operating in a different device economy.
Why is your install number smaller than you think?
Because the metric on the other side of the chart deliberately excludes anyone who already had your app on another device — so returning users and second devices count on the loss side but not on the gain side. The two lines are not symmetrical measures of the same population.
Google defines user acquisitions as "the number of users who installed your app and did not have it installed on any other devices at the time". That exclusion is doing a lot of work. The person who installs your app on a new phone while still having it on their tablet is not an acquisition. If the tablet later goes quiet for a month, that is a loss.
Compare it with the more permissive metric alongside it. Install events are "the number of times your app was installed, including devices on which the app had been installed previously" — reinstalls included. This is why teams comparing Play Console against an ad platform get different answers even before attribution enters the picture, a problem we cover in detail in our piece on why Meta and your MMP report different installs.
Counted as a gain
- A genuinely new user, with your app on no other device
- That is the whole list
Counted as a loss
- A real uninstall from every device the user has
- A device unused for over 30 days
- A replaced, broken or reset handset
- A secondary device that sits idle
Put those two columns side by side and the crossing lines stop being mysterious. You are watching a narrow definition of gain plotted against a broad definition of loss.
Did something change to make this look worse?
Yes — Google improved its inactivity detection, and told developers directly that this would increase reported uninstall and device loss figures. If your loss numbers stepped up without a matching product change, a methodology change is a real candidate and worth ruling out before you go looking for a cause in your app.
Google's page on understanding recent changes to report metrics is explicit about the direction of the effect. On users, it notes you may see an increase because Google can now more accurately pinpoint when a user becomes inactive. On devices, it says you may see an increase because a greater number of signals are used to generate a more accurate measure. The stated basis is that active devices are those that have checked in with Google at least once in the past 30 days.
Better detection of inactivity means more inactivity detected. The underlying behaviour of your users did not change; Google's ability to observe it did.
Google's troubleshooting page for app statistics is worth knowing about for the same reason. It documents a series of historical corrections and outages — including a systems change in mid-2022 that caused missed data across installs, acquisitions and engagement metrics, with some of it unrecoverable, and a period where some app updates were being counted as device installs before the calculation was changed.
The practical rule that follows: before investigating a step change in any Play Console metric, check whether Google changed how it was measured. We have watched teams spend a fortnight hunting a retention regression that was a reporting change, and the check that would have saved them takes five minutes.
Why does Apple not show you this number at all?
Because Apple measures retention rather than loss, and reports no uninstall metric — which means the comparison you are trying to make across platforms does not exist. Founders regularly ask why their iOS uninstall rate looks so much better than Android. It does not look better; it is not reported.
Apple's App Store Connect analytics documentation on app retention defines the metric it does provide: retention "tells you the percentage of active devices that installed the app on the selected day and opened the app a certain number of days later". Day 1 retention is the percentage that opened your app one day after installation, and so on.
One exclusion in that definition is worth holding on to, because it is the mirror image of Play's approach. Apple states that users who install your app but never open it "do not qualify, and are not counted in the numerator or the denominator of the calculation". Play counts that device in its install base until it goes quiet. Apple removes it from the retention calculation entirely.
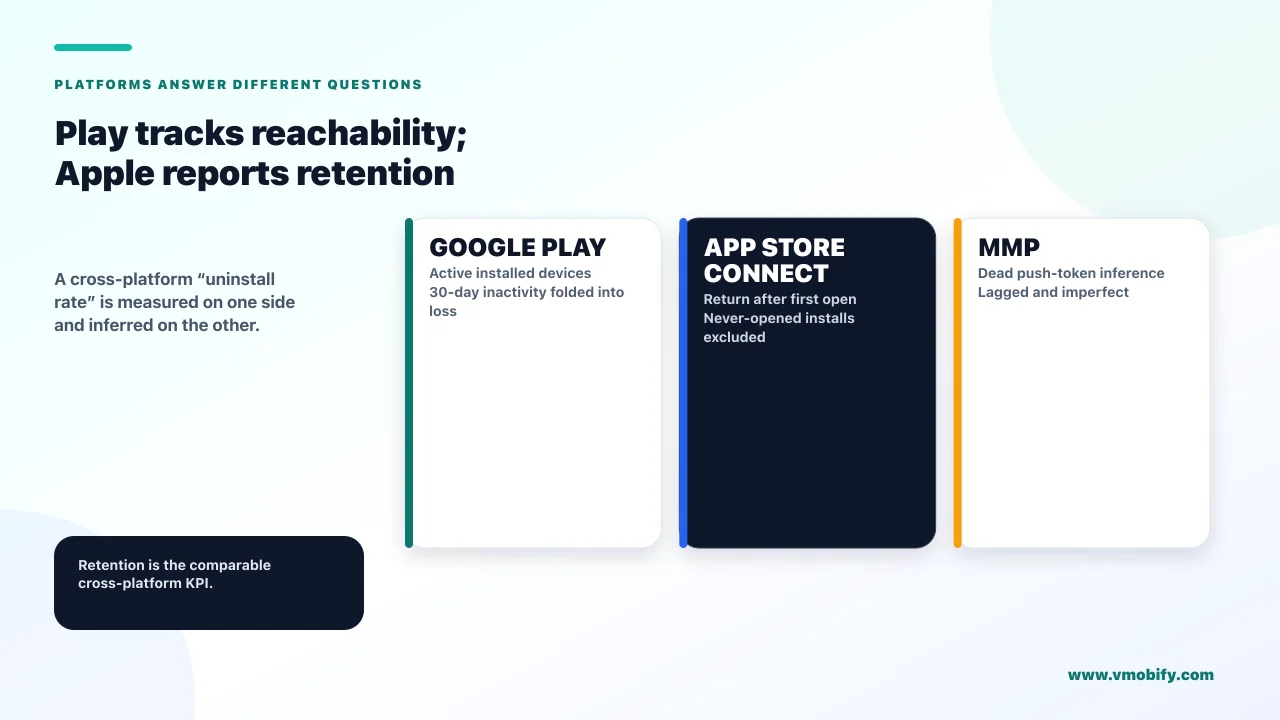
So the two platforms are not reporting the same thing in different formats — they are answering different questions. Play asks how many devices still have the app. Apple asks what share of people who opened it came back. Both are useful. Neither converts into the other, and any cross-platform "uninstall rate" comparison you build is comparing a measured number against an inferred one.
Retention is the only concept both stores support natively, and it is the one that actually predicts revenue. An uninstall figure that exists on one platform and is modelled on the other is a reporting liability, not an insight. Our retention strategy guide covers what to do with the number once you have it.
How do MMPs detect uninstalls, and what do they miss?
By watching push tokens die — which means they detect an app that can no longer receive messages, not an app that was definitively removed. Third-party uninstall tracking is an inference from a delivery failure, and understanding that tells you exactly where it is unreliable.
The mechanism rests on push infrastructure. Firebase's documentation on managing registration tokens describes the signals available: a send request targeting an invalid or expired registration returns UNREGISTERED (HTTP 404) or INVALID_ARGUMENT (HTTP 400). A tool that pings tokens periodically and records which ones stop accepting messages can build an uninstall figure from that.
Three limitations follow directly, and they are the reason your MMP and Play Console will never agree either:
- It is a poll, not an event. Detection happens on the next check, so there is an inherent lag between the uninstall and the record of it.
- It cannot distinguish removal from other causes of a dead token. A token can stop working for reasons other than uninstallation.
- Inactivity gets folded in here too. Firebase notes that by default it considers a registration stale if its app instance has not connected for a month, and that any registration older than one month is likely to be an inactive device.
That last point is the striking one. Play Console treats 30 days of silence as a loss. Firebase treats roughly a month of silence as a stale registration. Two independent systems have reached the same conclusion — that after about a month of no contact, the difference between "gone" and "quiet" stops being worth modelling. Your uninstall number, from whichever source, is really a "no longer reachable" number.
Which causes show up in Play Console’s own data?
Two of them are measurable inside Play Console itself — storage pressure and app size, and technical quality — which makes them the right place to start because you can prove or dismiss them without guessing. The broader question of why users leave is a product one; this section is about the causes Google will show you directly.
Storage and size. Google's guidance on optimising your app's size states outright that "App size is an important aspect of technical quality that can affect your app's install and uninstall metrics". More usefully, Play Console reports "Active devices with <2GB free" and "Uninstalls on devices with <2GB free" as distinct figures. If the second is disproportionate to the first, storage pressure is a real cause for your app rather than a theory about apps in general.
Google also documents the size threshold that changes the install experience: above 200MB, users on a mobile data connection see a non-blocking dialog when installing from Google Play informing them of the app's large size. That is friction at the moment of acquisition, applied to exactly the users least able to absorb it.
Technical quality. Google's bad behaviour thresholds are published numbers: a user-perceived crash rate of at least 1.09% of daily users across all device models, and a user-perceived ANR rate of at least 0.47% of daily active users, with an 8% threshold for a single device model in both cases. Exceeding them makes an app likely to be less discoverable on Google Play, and a warning may be displayed on the store listing. We cover what to do about that in our piece on the vitals thresholds that decide distribution.
Deliberately absent from this section: the widely-repeated figures linking each additional megabyte to a specific percentage increase in uninstalls, and the various "X% of users uninstall within 30 days" statistics. We traced the popular ones and could not reach a primary source for any of them. The direction is well supported by Google's own statement above; the specific numbers in circulation are not, so we do not print them.
Which number should you actually track?
Retention of the cohort you acquired, not the net line between gains and losses — because the net line is dominated by the size and age of your install base rather than by anything you did this month. Switching which number you watch is the actual fix here.
- Track retention by acquisition cohort. Of the users who arrived in a given week, how many are still opening the app at day 1, 7 and 30. This is the only measure that isolates your recent work from your accumulated history, and it is comparable across platforms.
- Track loss as a rate against install base, never as a raw count. A growing app will show growing losses forever. The rate tells you whether anything changed; the count only tells you that you are bigger than you were.
- Separate the first-week uninstall from the long-tail loss. Someone who removes your app within a day of installing it is telling you about onboarding or expectation mismatch. A device going quiet after eleven months is telling you about the handset replacement cycle. Averaging them produces a number that describes neither.
- Watch the storage-pressure split. Uninstalls on devices with under 2GB free, against active devices in the same condition, converts a vague hypothesis into a measurement.
Across the 300+ apps we have managed since 2013, the teams with a real handle on churn are the ones tracking cohort retention weekly and treating the Play Console loss chart as context rather than as a KPI. The teams in trouble are usually reporting the net line to a board, which produces panic in mature apps and false comfort in young ones — a young app has almost no accumulated base to lose from, so its net line looks wonderful right up until it does not.
When is this genuinely a problem?
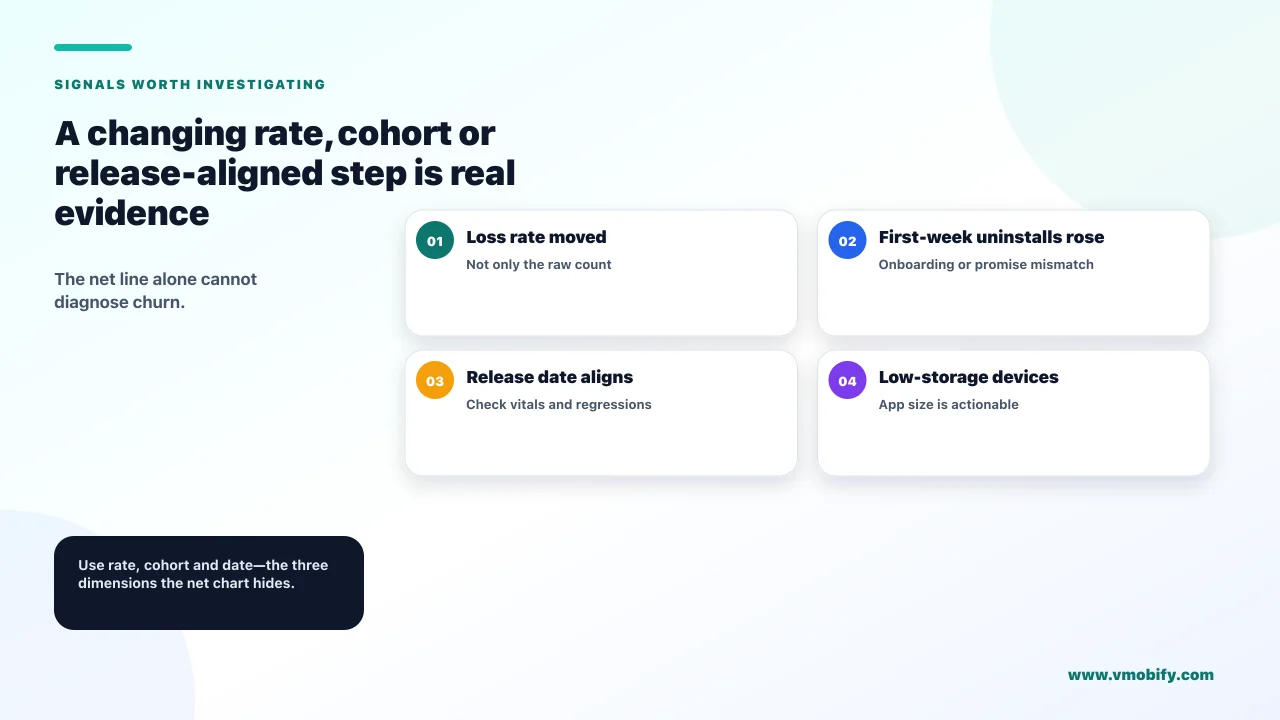
When the loss rate moves rather than the loss count, when early-life uninstalls climb, or when a release date lines up with the change. Everything else on this page is definitional; this section is the short list of things that should actually worry you.
- The rate changed. Losses as a share of install base moving materially, with no methodology change to explain it, is a real signal. Check Google's change and troubleshooting notes first, then look at your own releases.
- First-week uninstalls rose. This is the most actionable signal in the whole area, because it is about the experience you control most tightly. It usually points at onboarding, permissions asked too early, or a mismatch between what the store listing promised and what the app delivered.
- It starts on a release date. Line the loss chart up against your release history. A step change that begins the day a build rolled out is a regression, and vitals are the first place to look given the published thresholds above.
- Storage-pressure uninstalls are over-represented. If uninstalls on devices with under 2GB free are disproportionate to your active devices in that state, app size is worth engineering time rather than debate.
None of those is diagnosed from the net line. All of them are diagnosed from a rate, a cohort or a date. If your uninstall picture is moving and you cannot tell which of the four you have, that is a worthwhile conversation to have with someone who has seen the pattern before — tell us what the chart is doing, or read how we approach the retention side in our analytics work and our guide to re-engagement and winback.
Frequently Asked Questions
Is my app dying if Play Console shows more uninstalls than installs?+
Usually not. Play counts a device unused for over 30 days as a loss, counts an acquisition only when the user had your app on no other device, and draws losses from your whole accumulated install base while installs are only this month’s flow. A healthy mature app can show crossing lines indefinitely.
Does Play Console count a device going inactive as an uninstall?+
Effectively yes. Google defines device loss as devices from which users uninstalled the app and states this includes when a device has not been used in over 30 days. User loss similarly covers users who stopped using any device the app is installed on for over 30 days.
Why do my Play Console and MMP uninstall numbers disagree?+
They use different mechanisms. Play works from device check-ins with Google. MMPs infer uninstalls from push tokens that stop accepting messages, which is a poll rather than an event, cannot distinguish removal from other causes of a dead token, and folds in its own staleness window of roughly a month.
What is the iOS uninstall rate for my app?+
Apple does not report one. App Store Connect analytics provides retention — the percentage of active devices that installed on a given day and opened the app a certain number of days later — and excludes users who install but never open. Any iOS uninstall figure you have is modelled, not measured.
My uninstall numbers jumped with no product change. What happened?+
Check Google’s methodology notes first. Google has stated that more accurate inactivity detection would increase reported uninstall and device loss figures, and its troubleshooting page documents historical corrections and outages including a 2022 systems change that lost some data permanently.
Does app size really cause uninstalls?+
Google states that app size is an important aspect of technical quality that can affect install and uninstall metrics, and Play Console reports uninstalls on devices with under 2GB free as a separate figure so you can test it against your own data. Above 200MB, users on mobile data see a dialog about the app’s size at install time.
What should I report instead of net installs minus uninstalls?+
Cohort retention at day 1, 7 and 30, plus loss expressed as a rate against install base rather than a raw count. Cohort retention isolates the effect of recent work, is comparable across iOS and Android, and is the measure that actually predicts revenue.
Sources
- Google Play — View app statistics — Verbatim definitions of install events, user acquisitions, user loss, device loss and install base.
- Google Play — Understanding recent changes to report metrics — Improved inactivity detection and its stated effect on reported losses.
- Google Play — Troubleshoot app statistics problems — Historical corrections, outages and updates once miscounted as installs.
- Google Play — Optimize your app’s size — Size affects install and uninstall metrics; the 200MB mobile-data dialog.
- Google Play — Android vitals bad behaviour thresholds — The 1.09% crash and 0.47% ANR thresholds and the discoverability consequence.
- Apple — App Store Connect Analytics, app retention — How Apple defines retention and why installs never opened are excluded.
- Firebase — Manage FCM registration tokens — UNREGISTERED responses and the one-month staleness assumption behind uninstall inference.
About the author
Amol Pomane — Founder, Vmobify
Amol leads Vmobify, a mobile app growth agency that has driven 30M+ downloads and ranked 54K+ keywords across 300+ apps since 2013. He writes about ASO, paid user acquisition, retention, and the operational reality of scaling mobile apps in India and global markets.