Mobile App Analytics by App Studio with 30M+ Downloads
Learn from a mobile app studio that's scaled to 30M+ downloads. 13+ years experience, data-driven insights. Event mapping, cohort analysis, LTV modeling for predictable growth.
Analytics Services
Comprehensive analytics solutions that provide clean data and actionable insights for growth.
Event Tracking
Comprehensive event mapping and tracking implementation
- Event taxonomy
- Data collection
- Quality monitoring
- Attribution setup
Cohort Analysis
User behavior and retention analysis
- Retention tracking
- Behavior analysis
- Segmentation
- Journey mapping
LTV Modeling
Predictive lifetime value modeling
- LTV prediction
- Revenue forecasting
- Value segmentation
- Predictive insights
Attribution Tracking
Multi-channel attribution and conversion tracking
- Multi-touch attribution
- Conversion tracking
- Channel analysis
- ROI measurement
Our Analytics Solutions
Advanced analytics solutions that transform raw data into actionable insights for growth.
Event Schema Design
Design and implement comprehensive event tracking systems for accurate data collection.
- Event taxonomy design
- Data collection implementation
- Attribution tracking setup
- Data quality monitoring
Cohort Analysis & Retention
Deep dive into user behavior patterns and retention analysis for growth insights.
- Cohort analysis setup
- Retention tracking
- User journey mapping
- Behavioral segmentation
LTV Modeling & Prediction
Build predictive models for user lifetime value and revenue forecasting.
- LTV prediction models
- Revenue forecasting
- User value segmentation
- Predictive analytics
Attribution & Conversion Tracking
Comprehensive attribution tracking across all marketing channels and touchpoints.
- Multi-touch attribution
- Conversion tracking
- Channel performance analysis
- ROI measurement
Our Analytics Process
A systematic approach to analytics implementation that ensures clean data and actionable insights.
Analytics Audit
Week 1
Analyze current analytics setup and identify gaps in data collection and insights.
Event Schema Design
Week 1-2
Design comprehensive event tracking schema and data collection framework.
Implementation
Week 2-3
Implement event tracking, attribution, and analytics infrastructure.
Dashboard & Reports
Week 3-4
Create custom dashboards and automated reporting systems.
Optimization
Ongoing
Continuously optimize analytics setup and provide actionable insights.
Proven Analytics Results
Real results from our analytics implementations across different app categories.
Fintech App: 99% Attribution Accuracy
Achieved 99% attribution accuracy and 3x faster decision-making through comprehensive analytics setup.
Gaming App: Predictive LTV Models
Built predictive LTV models that improved user acquisition ROI by 40% through better targeting.
Real Campaign Performance Data
Click on any performance data to view the full image and campaign details.

ASO Performance Dashboard
Real ASO optimization results showing keyword rankings, organic traffic growth, and conversion improvements.

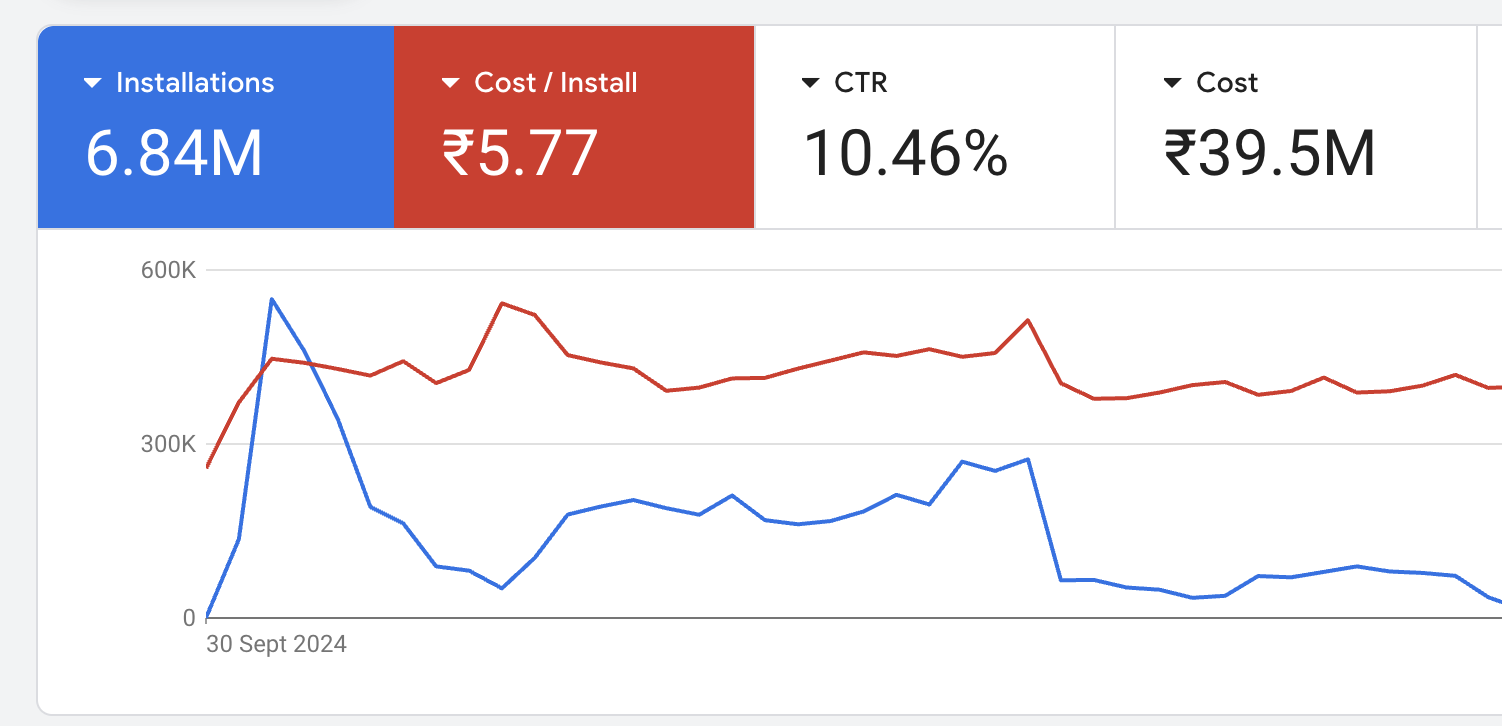
CPI Campaign Performance - Part 1
Cost Per Install campaign results showing efficient user acquisition and scaling capabilities.
Google Ads Performance
Google Ads campaign results showing UAC optimization, targeting precision, and conversion tracking.

Meta Ads Install Results
Facebook and Instagram advertising performance focused on app installs and user engagement.

Vmobify Advertising Results
Our own advertising performance showcasing the effectiveness of our growth strategies.
Showing 5 performance data examples
Get Your Performance AnalysisFrequently Asked Questions About Mobile App Analytics
Common questions about MMP attribution, event tracking, and mobile analytics.
Which MMP do you recommend — AppsFlyer, Adjust, or Branch?▾
How does iOS attribution work under SKAdNetwork?▾
What is cohort analysis and why does it matter?▾
What KPIs should I track for my mobile app?▾
What is the difference between MMP attribution and store analytics?▾
How do you measure LTV accurately?▾
How do you identify drop-off in the user onboarding funnel?▾
How do you set up event tracking for user behaviour?▾
What does a good mobile app analytics dashboard look like?▾
What is organic vs paid install split and how should I optimise it?▾
Ready to Get Data-Driven Insights Like a Successful App Studio?
Learn from a mobile app studio with 30M+ downloads. Get your free analytics audit and discover how we can help you get data-driven insights like we do.