App Retention Strategy: How to Keep Users Past Day 7
Spending more on acquisition while retention is broken is the most expensive mistake in app growth. Here is the D1, D7, D30 retention playbook — benchmarks by vertical, onboarding optimisation, push strategy, churn prediction, and re-engagement sequences that actually compound LTV.

Why does retention beat acquisition as a growth lever?
Retention is a compounding multiplier on every rupee of acquisition spend you have ever made — and no other lever in app growth has comparable mathematical leverage over an 18-month horizon. A 5-percentage-point lift in D7 retention typically raises LTV by 30–60%, which is mathematically equivalent to halving your CAC without changing a single campaign or creative.
The compounding mechanism is what makes it decisive. Better D7 retention drives better D30 retention, which drives better referral rates, which improves store ranking signals, which reduces paid CPI through organic compounding. AppsFlyer's State of App Marketing consistently shows that apps in the top quartile of category retention spend 30–50% less per retained user than peers — not because they negotiate better media rates, but because their organic compounding lowers blended acquisition cost while rivals pay full price for every install.
The cost arithmetic tells the same story. If your blended CAC is ₹80 and D30 retention is 8%, you are effectively paying ₹1,000 per D30-retained user. Lift D30 to 16% and the same CAC delivers retained users at ₹500 — a halving of every media bill you have ever signed. No paid optimisation on the user acquisition side, no creative testing programme, and no bid-curve tuning comes close to that scale of unit-economics improvement.
Despite the maths, most teams obsess over acquisition because it is easier to measure, easier to brief, and easier to spend money against. Retention requires product work, sequencing decisions, and patience for cohorts to age into meaningful data. Across our 300+ apps managed since 2013, the clearest pattern is that apps which graduate from struggling to scaling do it by fixing retention first and then opening the paid taps — not the other way around. Every successful scaling story has the same shape: solid retention foundation followed by aggressive paid amplification.
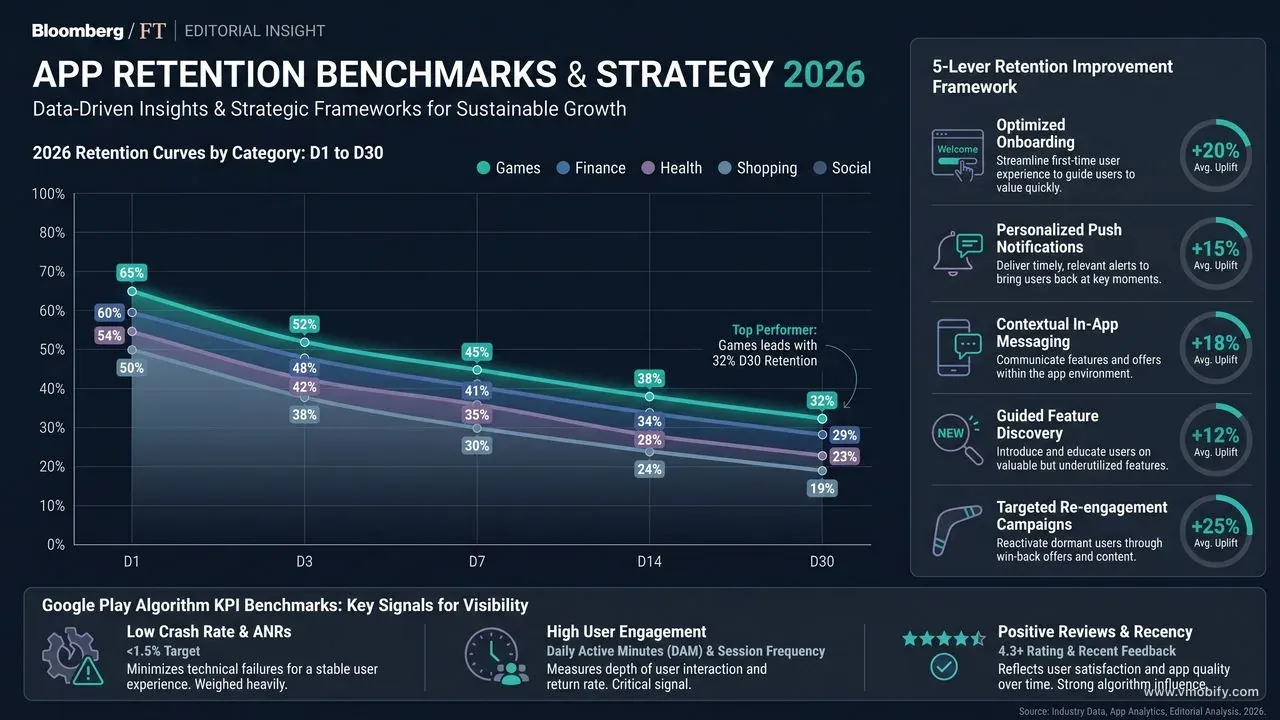
What are D1, D7, and D30 retention benchmarks by vertical?
Retention benchmarks vary 5–10x across app categories — comparing your app to a global average is operationally useless; comparing it to your category median is the only exercise that produces actionable decisions. The data below is aggregated from AppsFlyer's State of App Marketing, Adjust's mobile benchmarks, and our own portfolio data across 300+ India-and-global apps:
- Hyper-casual games: D1 33% / D7 12% / D30 4%
- Mid-core & strategy games: D1 45% / D7 22% / D30 10%
- Social & messaging: D1 55% / D7 35% / D30 22%
- Fintech & banking: D1 28% / D7 18% / D30 12%
- Health & fitness: D1 27% / D7 10% / D30 4%
- Shopping & ecommerce: D1 24% / D7 11% / D30 5%
- OTT & video streaming: D1 50% / D7 30% / D30 18%
- EdTech (K-12 & upskilling): D1 55% / D7 30% / D30 18%
- News & content: D1 45% / D7 25% / D30 15%
- Productivity & utility: D1 50% / D7 28% / D30 15%
How to read these operationally: if your D7 is more than 30% below your category median, retention work is unambiguously your highest-ROI activity — paid scaling will multiply the leak and burn cash. If your D7 is at or above median, you have earned the right to scale paid acquisition aggressively. The benchmark is the decision gate, not just a vanity comparison.
The Indian market adds a device-tier dimension most benchmarks ignore. Low-end Android (sub-₹10,000 devices) consistently retains 20–40% worse than mid-tier and premium Android in the same cohort, due to app performance constraints, storage pressure, and notification reliability. We routinely see apps that appear well below benchmark overall but are performing fine on premium tiers and catastrophically on entry-level Android. The fix is engineering — APK size reduction, startup time optimisation, lite-mode features — not marketing. Data.ai's State of Mobile identifies device fragmentation as the primary retention differentiator in Southeast Asian and South Asian markets through 2026.
How do you compress onboarding to maximise D1 retention?
D1 retention is decided in the first 90 seconds of the first session — if a user does not experience meaningful value before they would otherwise switch back to social media, they will not return tomorrow. Every minute added to time-to-value drops D1 retention by 5–10 percentage points in our portfolio data. The remedy is ruthless onboarding compression.
The five interventions that move D1 retention fastest:
- Reach the "aha moment" within 90 seconds: Identify the single experience that defines what your app does well — the match that loads, the transaction that completes, the lesson that unlocks, the playlist that plays. Engineer the first session so users hit it without tutorial overlays or narration.
- Compress to 3 screens or fewer: Every additional onboarding screen drops completion by 10–15%. A 6-screen onboarding typically loses more than half of users before they see any core value. Count splash screens, permission prompts, value-prop carousels, and tutorial slides — all count against your budget.
- Defer authentication: Let users experience 2–3 sessions before forcing account creation. Pre-authentication engagement is dramatically higher because the friction of sign-up arrives only after the user has decided they want the app. Apple's App Store Review Guidelines section 5.1.1 explicitly requires that apps allow access to non-account-specific features without registration — Apple agrees with this pattern strongly enough to enforce it.
- Time permission requests contextually: Never request push, location, and contacts simultaneously at session start. Present the push permission prompt after the user has experienced their first value moment — opt-in rates typically double compared to upfront prompts, and users who opt in after experiencing value retain 30–50% better than those who grant permissions blindly at launch.
- Pre-populate empty states: A new user's feed, library, dashboard, or catalogue should show curated starter content — not a blank canvas with a "Get started" CTA. Empty states are the most under-designed surface in mobile apps and one of the highest-leverage fixes available.
The fastest diagnostic: instrument every onboarding step as an individual event and look at the funnel. The single step with the largest drop-off is almost always your highest-ROI fix. In our portfolio, the median app has one onboarding step costing them 20–30% of installs that they did not know existed until they instrumented properly. One sprint to add event tracking, one week of data, one week of fixes — and D1 retention typically moves 15–30%.
Progress indicators deserve special mention. A simple step counter ("Step 2 of 3") during personalisation flows reduces abandonment by 20–35% because users can see the end of the tunnel. Duolingo's onboarding is the canonical example: three questions, an immediate lesson, a streak initialised at 1. Users arrive at their first value moment in under 60 seconds and their first "investment" (the streak) is already in place.
What push notification strategy actually improves retention?
Push notifications are the single highest-leverage retention tool in mobile — and also the easiest to abuse into negative ROI. The difference between a +20% D7 lift and a +15% uninstall rate is almost entirely frequency discipline, personalisation depth, and timing precision.
The rules that hold consistently across our portfolio:
- One push per day maximum for most apps. News and messaging apps are the only legitimate exceptions. Anything above that frequency raises uninstall rates faster than engagement rates — in our portfolio we have seen apps cut daily push volume by 60% and lift D7 retention by 12 points in the same quarter.
- Personalisation lifts CTR 3–5x. "Pick up where you left off in Lesson 3" beats "Don't miss out!" by an order of magnitude. Generic blasts train users' fingers to swipe-dismiss without reading — and each dismiss lowers the probability of the next open.
- Send at the user's typical app-open hour. AppsFlyer benchmark data shows time-of-day personalisation alone lifts open rates 40–80%. Most MMP and CRM platforms support per-user time-of-day targeting; fewer than one in five teams actually use it.
- Behavioural triggers beat scheduled blasts. "Your shipment is out for delivery" outperforms "Today's deals are live" by 10–20x in CTR and post-open session depth. Build transactional and social trigger infrastructure before building any campaign-blast infrastructure.
- Optimise the push opt-in rate aggressively. iOS requires explicit opt-in for push — the median opt-in rate is 44% but well-optimised apps reach 65–75% by requesting permissions after the first value moment. A 30-point opt-in improvement multiplies the reach of every push you ever send. See our full push notification strategy guide for the opt-in sequence that works.
The audit we run on every new portfolio app: pull 30 days of push logs, segment by push category (transactional, social, promotional, content, behavioural), and measure 7-day retention of recipients vs a matched holdout. Consistently, one in three apps has at least one push category that is actively hurting retention. Killing it is a free improvement — no product work required. Swiggy's notification personalisation is the Indian market benchmark: push timing, content relevance, and frequency are all calibrated per user behaviour segment, delivering open rates that sit 3–4x above category average.
When does in-app messaging outperform push notifications?
In-app messaging wins whenever you need to communicate with users who are already in the app — and it is categorically superior to push for onboarding guidance, feature announcements, and upsell moments because it cannot be blocked and cannot be dismissed without engagement.
The decision framework for choosing between push and in-app messaging:
- Use push when: the user is out of the app and you have a time-sensitive, high-relevance trigger (delivery update, friend activity, expiring deal, streak reminder). Push is the mechanism for re-activating dormant users and bridging the gap between sessions.
- Use in-app messaging when: the user is already in a session and you want to contextually surface a feature, offer a personalised recommendation, announce a new capability, or guide them through a high-value action. In-app messaging at the right moment in the session converts at 2–5x the rate of push-driven traffic to the same destination.
- Use both in sequence: Push re-activates the user → they open the app → in-app message surfaces the relevant contextual prompt. This is the pattern Swiggy, PhonePe, and CRED use for high-conversion upsell flows. The push creates the session; the in-app message monetises it.
In-app messages should be triggered by behavioural events, not calendar schedules. A user who has opened the app three times without completing a key action (uploaded a profile photo, linked a bank account, completed a first transaction) is an ideal in-app message recipient — the message is contextual, the timing is right, and the user's intent is present. A user who opened the app for the first time yesterday should not see the upgrade upsell modal. Sequence matters.
From a retention analytics perspective, in-app messages are measurable at higher fidelity than push because every impression, dismissal, and conversion happens inside your tracked session — no notification permission required, no external delivery failure, no lock-screen friction. Teams that instrument in-app message performance properly typically find 3–5 high-converting trigger opportunities they did not know existed within their existing session flows.
How do tooltips and coach marks drive feature discovery?
Features that users do not discover do not retain them — and research consistently shows that the majority of app churn at D30 comes from users never engaging with the features that would have given them long-term value. Contextual feature discovery is one of the most under-invested retention levers available.
The three mechanisms that drive feature discovery most effectively:
- Contextual tooltips: A one-line tooltip surfaced the first time a user approaches a high-value feature in context (not during onboarding) converts into feature engagement at 3–8x the rate of a general walkthrough. The key word is contextual — triggered by proximity to the feature, not by a tutorial sequence.
- Coach marks for power features: Coach marks (semi-opaque overlays highlighting a specific UI element with a single action prompt) work well for features that are invisible until used — advanced search filters, keyboard shortcuts, batch actions, and gesture-based navigation. A single well-timed coach mark after the user has completed 5 sessions often unlocks a feature that doubles their session depth.
- Empty state design as discovery surface: An empty state (zero results, empty library, fresh dashboard) is the moment of highest user intent paired with the most risk of abandonment. Great empty states tell users exactly what to do next — not with a generic "Get started" button but with a specific, personalised prompt. In our portfolio, apps that redesign their empty states with direct action prompts see D14 retention lift of 8–15% from the change alone.
Feature discovery also needs measurement discipline. Track which features correlate with D30 retention — then trace backward to identify where users who never discovered those features first dropped off. That drop-off point is where your tooltip or coach mark belongs. Google Play's launch best practices specifically call out feature discovery as a key lever for improving the D7 retention signal that their algorithm weights heavily. Investing in discoverability is not just a product improvement — it directly feeds the ranking signal.
How do you build a re-engagement campaign that wins back lapsed users?
Lapsed users — last-active 7–21 days ago — are consistently the cheapest re-acquisition cohort available, typically costing 5–10x less per re-engaged retained user than fresh paid installs because they already have the app installed, already have an account, and already have some memory of your value proposition.
The re-engagement sequence that performs reliably across categories:
- Day 7 after last session (early lapse): A single personalised push referencing their last meaningful action — "You were 2 lessons from finishing your Python course" or "3 new arrivals in your saved category." No promotional angle. Pure continuity signal. This cohort has the highest re-engagement rate (typically 30–45% open rate) because the app memory is still fresh.
- Day 14 (mid lapse): Add a re-engagement incentive — a free credit, an unlocked premium feature for 48 hours, a streak reinstatement offer. The incentive must be genuinely valuable; a 5% discount for a user who has not opened in two weeks is not a compelling return argument.
- Day 21 (deep lapse): Email + push combination with a strong value proof — a "look what's new" message that shows concrete product improvements since their last session. This cohort re-engages at lower rates (8–15%) but the volume of lapsed users in most apps makes it worth running.
- Deep-link payloads in every re-engagement message: Every push, email, and paid re-engagement ad should deep-link directly to the relevant content, not the home screen. Deep-linked re-engagement users complete their target action at 4–7x the rate of users dropped on the home screen. This is one of the most consistently under-implemented re-engagement improvements we see in portfolio audits.
For paid re-engagement, both Google App Campaigns and Meta Advantage+ support custom audience targeting for lapsed installs with deep-link destination URLs. The creative brief for re-engagement is different from acquisition creative: lead with the update or improvement, not the original value proposition — the user already knows what the app does. The message that works is "here is what has changed since you left." See our referral programme guide for how re-engagement cohorts interact with referral mechanics to amplify win-back efficiency.
Which behavioural signals predict churn before it happens?
Churn is not a sudden event — it is a gradual signal detectable 7–14 days before the user stops returning, if you know which behavioural patterns to watch. Catching it early means you can intervene with personalised messaging, feature prompts, or win-back incentives while the user is still reachable via push.
The five leading churn indicators that appear earliest and most reliably in our portfolio data:
- Session length decline: A user whose average session has dropped by more than 40% over the past 7 days is exhibiting early disengagement. This precedes churn by 10–14 days on average. Trigger: a personalised re-engagement prompt referencing something specific from their usage history.
- Feature abandonment after adoption: A user who used a specific feature (playlist creation, portfolio tracking, route planning) consistently and then stopped is signalling that the feature failed to deliver sustained value. Trigger: a coach mark or tooltip surfacing a complementary feature they have never tried.
- Push opt-out: Notification opt-out is a strong churn signal — users who turn off push notifications are 3–4x more likely to churn within 30 days than users who keep them on. Trigger: a gentle in-app prompt (not another push) offering notification preference customisation rather than the binary all-or-nothing iOS/Android toggle.
- Store rating prompt dismissal: Dismissing the Apple SKStoreReviewRequest or Android In-App Review API prompt is a mild churn signal on its own, but combined with declining session length it is highly predictive. These users are not yet churned but are emotionally disengaged.
- Support contact without resolution: A user who contacted support (in-app, email, or social) and did not receive a timely or satisfactory response is among the highest-churn-risk segments in any app category. Trigger: a direct follow-up message from the product team 48 hours post-contact.
Building a churn prediction model does not require a dedicated data science team. A simple rules-based system combining 3–4 of the signals above, scored daily per user, and triggering personalised CRM actions is sufficient to recover 15–25% of at-risk users in our portfolio experience. The more sophisticated ML-based scoring builds on this foundation — but the signals are the same. From a mobile analytics infrastructure perspective, all five signals require event tracking that most apps already have but are not acting on — the gap is the downstream workflow, not the data.
How does retention data feed back into ASO rankings?
Google Play's ranking algorithm weights D7 retention as one of its primary quality signals — a 5-point D7 improvement consistently delivers more organic discovery surface than an equivalent uplift in raw install volume. Retention is not just a product metric; it is directly an ASO metric for Android apps.
The retention-to-rankings feedback loop works as follows:
- Google Play Launch Best Practices explicitly state that apps with higher Day 1 and Day 7 retention receive broader discovery surface, better category placement, and improved featured eligibility. Google's own documentation names retention as a first-class ranking input — something that was not publicly confirmed until 2023 but has been visible in ranking data for years.
- App Store ratings as retention proxy: Both stores use average rating, recent rating velocity, and review sentiment as ranking signals. Apps with strong retention naturally generate more voluntary positive reviews — users who return on D30 are 6–8x more likely to leave a review than D1 churners. The timing of the ratings prompt matters enormously: Apple's SKStoreReviewRequest and Android In-App Review API should be triggered after the user has completed their third meaningful session and experienced measurable value — not on first open. Prompting at the right moment typically lifts store rating by 0.3–0.7 stars, which is a meaningful conversion lift on the store listing page.
- Session depth and engagement time: Both stores measure post-install engagement signals — apps with longer average sessions and higher return rates surface more prominently in "Suggested for You" and editorial placements. This means every retention improvement directly feeds back into organic discovery volume.
The compounding consequence of poor retention is therefore double: you pay more to acquire users (poor LTV kills unit economics) AND you rank lower organically (poor signals suppress discovery). Improving retention simultaneously unlocks both levers. For the full ASO picture see our App Store conversion rate optimisation guide, which covers how retention signals interact with listing conversion to determine total organic install volume. The flywheel between retention and ranking is one of the most powerful in app growth — and it is entirely within your control.
What India-specific factors shape app retention in 2026?
India's app market has structural characteristics that make several global retention playbook assumptions incorrect — ignoring them produces interventions that work in North American or European contexts but fail or underperform in the Indian market.
The five India-specific retention factors that matter most in 2026:
- Device-tier fragmentation: India's smartphone mix skews heavily toward sub-₹10,000 Android devices, where RAM constraints, storage pressure, and aggressive battery-saver modes kill background processes and interrupt notification delivery. Apps must offer a deliberate "lite experience" — lower-bandwidth content loading, reduced animation load, and compressed APK size — to retain this segment. In our portfolio, India-market apps that implement a lite mode see D7 retention improve 15–25% on low-tier Android cohorts with no changes to the product experience on premium tiers.
- Regional language content: Apps that surface content in the user's preferred regional language (Hindi, Tamil, Telugu, Bengali, Marathi) in the first session retain 20–35% better at D7 than apps offering English-only onboarding to the same user. Language personalisation in the onboarding flow — even a single "Select your language" screen before the first value moment — is one of the highest-ROI retention investments for India-market apps.
- Data-light modes: India's mobile data consumption patterns, particularly outside metropolitan areas, mean that users on limited data plans actively manage app storage and background data usage. An app with a "data saver" mode that is prominently discoverable in settings retains Tier-2/3 users 10–20% better than apps with no data-conscious option. This applies to all content-heavy verticals: OTT, news, gaming, social, and EdTech.
- UPI-native flows: In fintech, ecommerce, and any app with an in-app transaction layer, native UPI integration (not just a redirect) dramatically improves D7 and D30 retention because it reduces transaction abandonment — the single largest D1→D7 churn driver in commerce and fintech apps. A UPI-native checkout flow versus a redirect flow typically produces 25–40% lower transaction abandonment.
- Festival and seasonal retention spikes: India's app retention follows strong seasonal patterns around Diwali, IPL season, Eid, and regional festivals. Apps with contextualised in-app events and seasonal personalisation — Apple In-App Events and Android's equivalent seasonal badging — see D7 and D14 retention spikes of 15–30% around major festivals versus apps that ignore the seasonal calendar. Planning retention campaigns around the Indian festive calendar is as important as planning paid acquisition campaigns around it.
For a fuller view of how India-specific acquisition economics interact with these retention patterns, see our app downloads growth guide and our analytics service page for how we instrument and segment India-market retention cohorts. Talk to our team if you want a retention audit scoped specifically to the Indian device and demographic mix — most India-market apps have at least one correctable structural retention leak that is invisible in blended metrics.
How do you build a retention measurement framework that produces decisions?
Blended retention numbers — "our D7 is 18%" — are operationally useless because they aggregate patterns that move in opposite directions and hide every actionable insight. A productive retention measurement framework cuts data on three dimensions simultaneously: acquisition source, first-session behaviour, and device tier.
The framework we deploy for every new portfolio engagement:
- Cohort retention by acquisition source: Paid Meta vs paid Google vs organic ASO vs CPI network vs referral vs influencer. Different sources retain very differently — often 2–3x apart in the same app. Knowing which source produces your best-retaining users tells you where to increase spend and which channels are profitable on install CPA but lose money on retained-user economics. We routinely find paid channels that look strong on surface CPA that are actually unprofitable once retention is factored in — and only cohort-by-source analysis surfaces this.
- Cohort retention by first-session behaviour: Users who reached the "aha moment" vs users who completed onboarding vs users who exited early. If aha-moment users retain at 40% D7 and non-aha users retain at 8%, your entire retention problem is a funnel problem — getting more users to aha. This is the diagnostic that tells you what to fix and in which order.
- Cohort retention by device tier: Low-end Android, mid-tier Android, premium Android, iOS. Data.ai's research confirms India's device mix skews heavily toward sub-₹15,000 Android — and these tiers often retain dramatically differently due to performance, storage, and notification reliability. Without this segmentation you are almost certainly averaging away the single biggest retention gap in your data.
- Funnel drop-off at every onboarding step: Instrument every screen transition as an event. The step with the largest drop-off is your highest-leverage fix. Most apps have one step that costs them 20–30% of installs that they did not know existed until they instrumented it.
- Retention reviewed weekly in the team standup: Retention improves fastest when it is a team-wide metric reviewed weekly, not an analytics-team artifact reviewed quarterly. Apps where retention is owned by the whole team improve 2–3x faster than apps where it lives in a monthly slide deck.
For the full picture of how retention metrics interact with paid UA economics, see our mass user acquisition strategy guide. To see what end-to-end retention work looks like on real portfolio apps, browse our case studies. If you want a 14-day retention diagnostic that identifies your specific leaks and sequences the interventions by ROI, talk to our team — we have done this across hundreds of apps and the patterns are now well-established.
Frequently Asked Questions
What are realistic D1, D7, and D30 retention benchmarks in 2026?+
Benchmarks vary heavily by category. As a reference: fintech apps average D1 28% / D7 18% / D30 12%; gaming (mid-core) D1 45% / D7 22% / D30 10%; social/messaging D1 55% / D7 35% / D30 22%. Health and fitness is among the lower performers at D1 27% / D7 10% / D30 4%. Always benchmark against your specific category — comparing to a global blended average produces no actionable signal.
Which retention window — D1, D7, or D30 — should I optimise first?+
D7 is the most diagnostic single metric. Users who return on Day 7 are 4–5x more likely to still be active at D30, making D7 the most consequential inflection point. That said, D7 is downstream of D1 — you cannot improve D7 without first ensuring D1 is solid. Fix D1 first (onboarding), then optimise the D1-to-D7 bridge (push timing, habit mechanics), then focus on D30 (value depth, personalisation).
How much can push notifications realistically improve retention?+
A well-designed push strategy lifts D7 retention 15–30%. Poorly designed push — too frequent, poorly timed, generic copy — reduces retention by 10–25% via uninstall acceleration. The difference is frequency discipline (maximum 1 push per day for most apps), per-user timing (send at the user's typical open hour), and personalisation (behavioural triggers, not broadcast blasts).
Should I fix retention before scaling paid acquisition?+
Yes, if retention is below category median — scaling paid amplifies the leak and burns cash with no compounding benefit. If retention is at or above category median, paid scaling typically pays back cleanly. Use the benchmark table in this post to determine which side of the line you are on before committing significant paid budget.
How does Google Play's algorithm use retention data?+
Google Play explicitly weights D1 and D7 retention as quality signals that influence category ranking, discovery surface (Suggested for You, Explore), and editorial featuring eligibility. A 5-point D7 improvement consistently produces more organic discovery than an equivalent increase in raw install volume. This is documented in Google Play's Launch Best Practices.
What is the single highest-ROI retention intervention for most apps?+
Onboarding compression. Cutting to 3 screens or fewer, deferring authentication, and instrumenting every step typically delivers a 15–30% D1 retention lift with no other product changes. It costs one engineering sprint to instrument, one week of data to diagnose, and one sprint to fix — with a permanent compounding benefit on every cohort that follows.
How do I tell whether low retention is a product problem or a traffic-quality problem?+
Cohort retention by acquisition source. If organic and ASO cohorts retain well and paid cohorts retain poorly, the problem is traffic quality — adjust channel mix, creative targeting, or bidding strategy. If all cohorts retain poorly, the problem is product (onboarding, value delivery, or performance). No acquisition fix will help a product-level retention problem.
Sources
- AppsFlyer State of App Marketing — Retention benchmarks by category; push notification CTR and time-of-day personalisation data
- AppsFlyer Performance Index — Quarterly benchmarks for retention vs acquisition cost by category and geography
- Adjust Mobile App Trends — Cross-category D1/D7/D30 retention and engagement benchmarks
- Data.ai State of Mobile — Device fragmentation impact on retention in South and Southeast Asian markets
- Google Play — Launch Best Practices — Official documentation naming D1 and D7 retention as ranking algorithm inputs
- Apple — In-App Events — Seasonal event badging and SKStoreReviewRequest timing best practices
- Apple App Store Review Guidelines (section 5.1.1) — Requirement for apps to allow access to core features without forced sign-up
- Sensor Tower State of Mobile — Category-level engagement, subscription retention, and feature-discovery data
About the author
Amol Pomane — Founder, Vmobify
Amol leads Vmobify, a mobile app growth agency that has driven 30M+ downloads and ranked 54K+ keywords across 300+ apps since 2013. He writes about ASO, paid user acquisition, retention, and the operational reality of scaling mobile apps in India and global markets.
Free Growth Audit
See exactly how to scale your app with 13+ years of expertise behind you.
Get My Strategy

