Android Vitals: The Thresholds That Decide Your Distribution
Google publishes exact numbers at which Play begins hiding your app, and most founders have never seen them. This is every current threshold, what they actually measure, why your crash reporter disagrees with Play Console, and the memory and code-optimization vitals arriving in February 2027.
On this page
- What are Android vitals, and which ones can Play punish you for?
- What are the exact bad-behaviour thresholds in 2026?
- Why is there a separate per-device threshold, and why does it matter most in India?
- What does "user-perceived" mean, and why does Crashlytics disagree with Play Console?
- What does Play actually do when you breach a threshold?
- What are the startup and rendering ceilings nobody talks about?
- What changes in February 2027?
- Which vital should you fix first?
- How long does visibility take to recover after you ship the fix?
- What does a monthly vitals review look like for a small team?
- Which mistakes make vitals worse while you are trying to fix them?
- Frequently Asked Questions
What are Android vitals, and which ones can Play punish you for?
Android vitals is the set of technical quality metrics Google Play collects from real devices running your app, and a subset of them carry published numeric thresholds above which Play reduces how often it shows your app. The distinction that matters is that some vitals are advisory and some are enforced. Founders usually discover which is which the week their installs fall.
Play collects vitals anonymously from users who have opted into sharing diagnostics. That is an important qualifier: the numbers in your Play Console are a sample of your real-world install base, not your whole install base, and they are not the same population your crash reporter sees. We will come back to why those two dashboards disagree, because it is the single most common source of wasted engineering time in this area.
The vitals that currently carry an enforced bad-behaviour threshold are user-perceived crash rate, user-perceived ANR rate, excessive partial wake locks and excessive battery usage. Two more categories — memory usage and DEX code optimization — have published thresholds that begin affecting store visibility in February 2027. Startup time and rendering performance are measured and reported, and matter enormously to retention, but are not on the same enforcement footing.
Technical quality is usually filed as an engineering concern and reviewed by engineers. But the consequence of breaching a threshold is commercial: reduced discovery, and in some cases a warning shown to users on your store listing before they install. That makes it a growth metric that happens to be measured in stack traces.
Across the 300+ apps we have managed since 2013, the pattern is consistent enough to be worth stating plainly: teams monitor crash-free rate because their crash reporter puts it on a dashboard, and ignore ANR rate entirely because it does not appear there in the same way. ANR is the one that quietly does the damage on Android, and it is disproportionately an issue on the mid-range devices that dominate Indian install bases.
What are the exact bad-behaviour thresholds in 2026?
Google publishes every threshold, and they are more specific than most teams expect — two separate crash thresholds, two separate ANR thresholds, and a set of memory and code-optimization numbers that land in 2027. These are the current published figures from Android's vitals documentation, verified at the time of writing.
The full published set, as it stands:
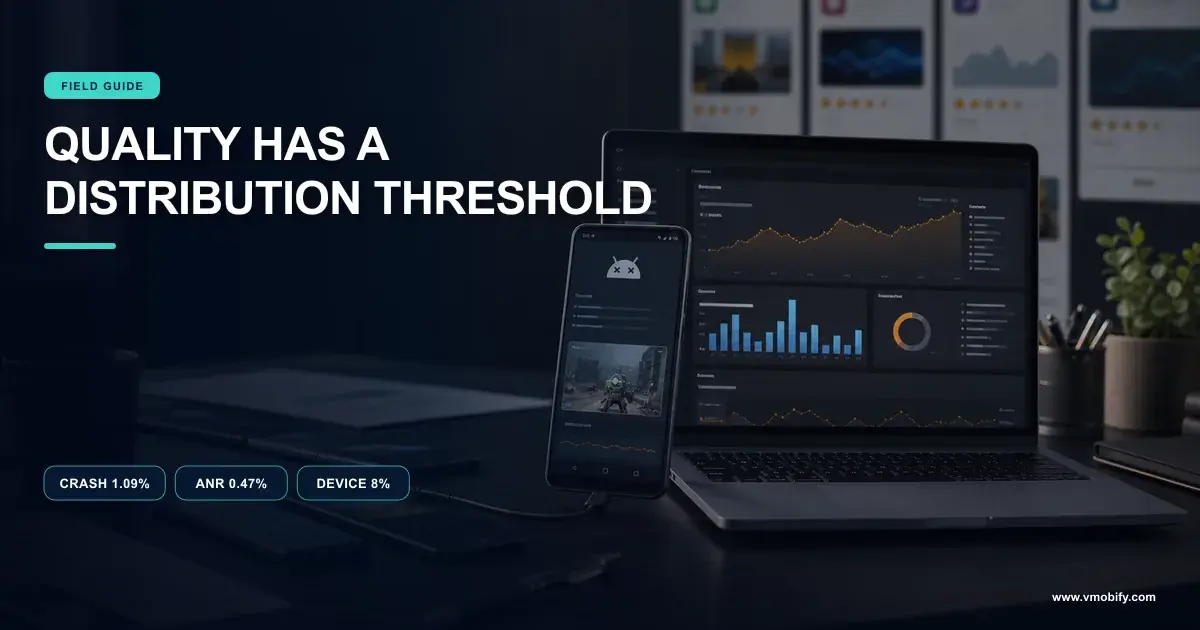
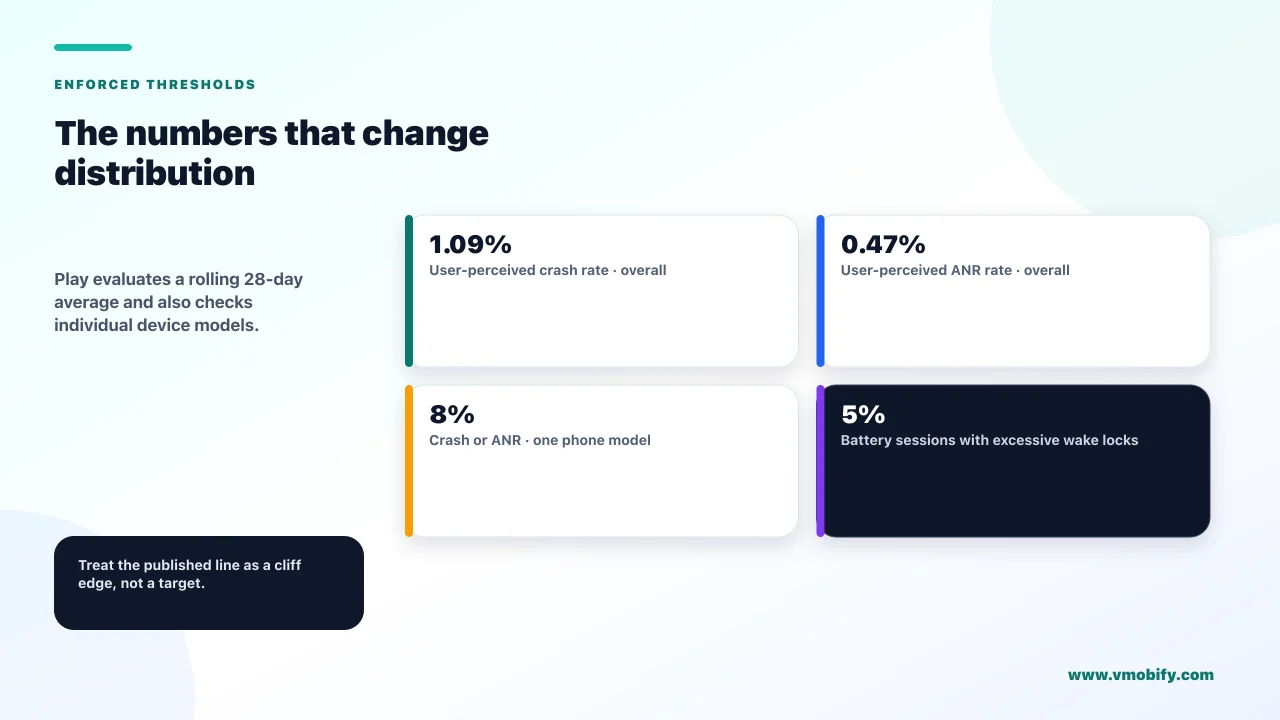
- User-perceived crash rate. 1.09% overall. 8% per phone model. 4% per watch model.
- User-perceived ANR rate. 0.47% overall. 8% per phone model. 5% per watch model.
- Excessive partial wake locks. 5% of battery sessions, where a session accumulates more than three hours of partial wake locks.
- Excessive battery usage. 1% overall, and 1% per watch model.
- Bitmap memory. 200 MB for user-perceived services, 200 MB background, 400 MB cached.
- DEX code optimization. Apps with more than 10 MB of DEX code, and games with more than 50 MB, must reach at least 25% optimization, obfuscation and shrinking.
Memory usage thresholds are tiered by the physical RAM of the device, which is the detail that catches teams out. An app that is comfortably inside the limit on a 12 GB flagship can breach it on a 4 GB device, and 4 GB devices are not a rounding error in India.
Apps, foreground memory ceiling
- 4 GB device: 2.00 GB
- 6 GB device: 2.25 GB
- 8 GB device: 2.25 GB
- 12 GB device: 3.25 GB
- 16 GB device: 4.25 GB
Games, foreground memory ceiling
- 4 GB device: 2.25 GB
- 6 GB device: 2.75 GB
- 8 GB device: 3.50 GB
- 12 GB device: 4.00 GB
- 16 GB device: 5.00 GB
Play evaluates these daily on a rolling 28-day average, which has a useful consequence: a single bad release does not immediately breach a threshold, and a single good release does not immediately clear one. You are always looking at a four-week window.
Thresholds change. The memory and DEX vitals did not exist in this form two years ago. Whatever you circulate internally, put the date you checked it on the same page, and re-verify against Google's documentation before you make a release decision on the strength of it.
Why is there a separate per-device threshold, and why does it matter most in India?
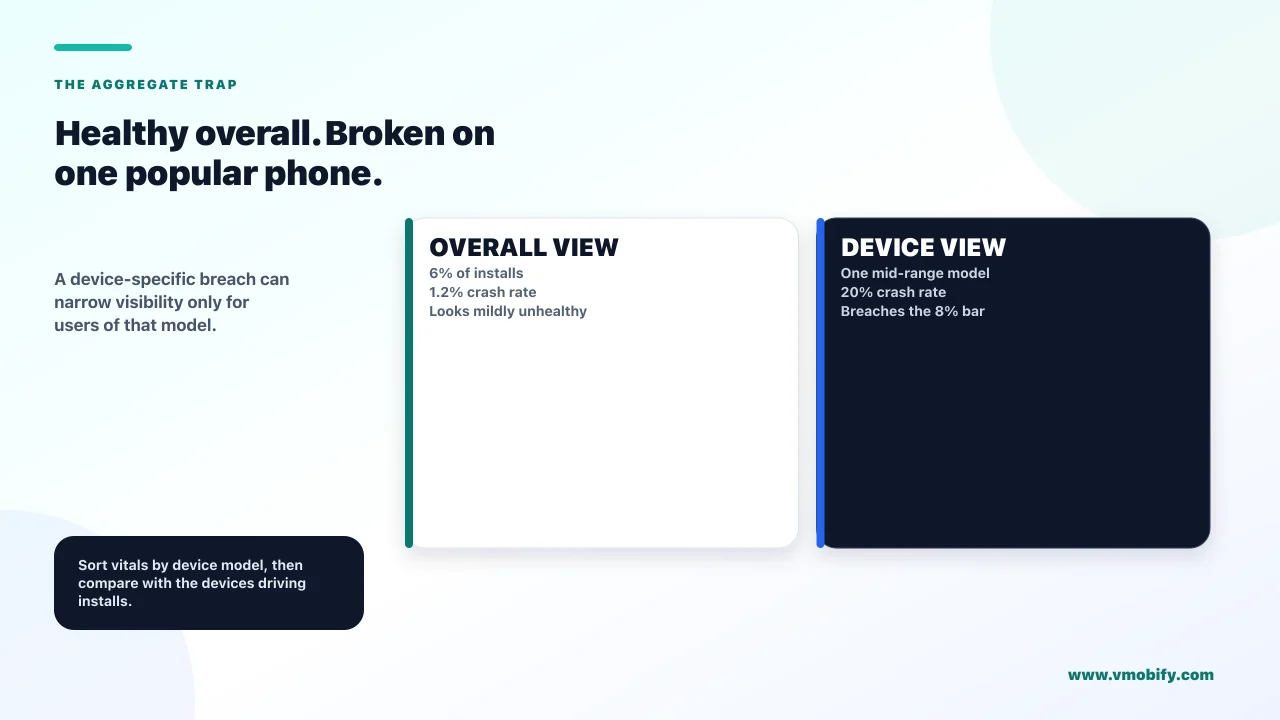
Because an app can look healthy on average and still be effectively broken on one popular device, and Play treats that as a distribution problem for the users of that device rather than a rounding error in your aggregate. The per-phone-model threshold is 8% for both crashes and ANRs — far looser than the 1.09% and 0.47% overall bars, but applied device by device.
The arithmetic is what makes this matter. If a single device model accounts for 6% of your install base and crashes on 20% of its sessions, your overall crash rate may still sit near 1.2% and look like a mild problem. On that model it is catastrophic, it breaches the per-device bar, and Play can reduce your visibility specifically to users on that device.
This is a structurally Indian problem more than a Western one. An install base spread across a long tail of mid-range Android models from several manufacturers — each with its own OEM skin, its own aggressive background process management and its own memory profile — produces exactly the shape of failure the per-device threshold exists to catch. A US-heavy install base concentrated on recent Pixel and Samsung flagships rarely trips it.
In our portfolio, the recurring version of this is an app that performs cleanly in testing and in the aggregate dashboard, and quietly loses installs on one manufacturer's mid-range line because of a vendor-specific behaviour nobody reproduced. The dashboard that finds it is Play Console's per-device breakdown, and almost nobody opens it until something is already wrong.
Open Android vitals in Play Console, and sort crash and ANR rate by device model rather than looking at the headline figure. Then compare that list against your top ten install-driving models. If a device appears high on both lists, that is your priority regardless of what the overall number says.
The same logic applies to Android version and, increasingly, to memory tier. A crash concentrated on 4 GB devices is a different engineering problem from one spread evenly, and the fix is usually memory pressure rather than logic.
What does "user-perceived" mean, and why does Crashlytics disagree with Play Console?
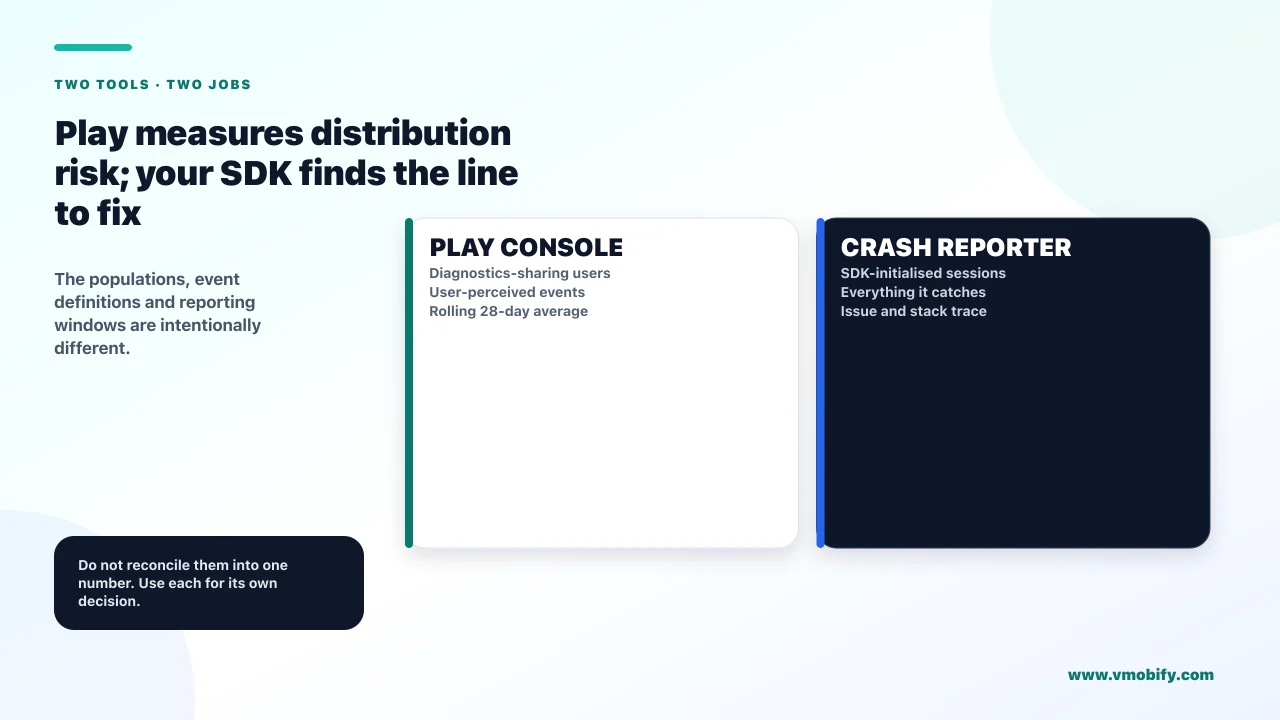
"User-perceived" means the crash or ANR happened while the user could actually tell — typically with the app in the foreground — and it is the reason your crash reporter and Play Console will never show you the same number. Neither is wrong. They are counting different things over different populations.
The differences stack up in a predictable way:
Play Console vitals
- Population: users who opted into sharing diagnostics
- Counts: user-perceived events only
- Window: rolling 28-day average, evaluated daily
- Granularity: per device model, Android version, and app version
- Authority: this is the number that affects distribution
Crashlytics or an equivalent SDK
- Population: every session where your SDK initialised
- Counts: everything it can catch, foreground and background
- Window: whatever range you select
- Granularity: per issue and stack trace
- Authority: this is the number that tells you what to fix
Use them for different jobs. Play Console tells you whether you have a distribution problem. Your crash reporter tells you which line of code is causing it. Teams that try to reconcile the two into one figure waste a sprint and end up trusting neither.
ANRs deserve a specific note here, because they are the vital most likely to be invisible in your existing tooling. An ANR is not an exception — nothing throws, nothing is caught, and many crash reporters surface them weakly or not at all. Google's ANR documentation and its guide to diagnosing and fixing them are the authoritative starting points, and Play Console is usually the first place a team sees the problem at all.
If your only quality signal is a crash-free-users percentage from an SDK dashboard, you are blind to the vital most likely to be suppressing your Android distribution. Check ANR rate in Play Console specifically, and check it per device model.
What does Play actually do when you breach a threshold?
Two things, escalating: it reduces how often your app is surfaced in discovery, and it can show a warning about technical quality on your store listing before a user installs. The second is the one worth genuinely fearing, because it attacks conversion at the exact moment of decision.
Google set out this framework in its announcement on raising the bar for technical quality, which introduced the per-device thresholds and the store-listing warnings. Play Console Help's guidance on monitoring technical quality is where the current operational detail lives.
The order of consequences, as it plays out:
- You breach a threshold on the 28-day average. Nothing visible happens immediately.
- Play begins reducing discovery surfaces — the app appears less often in browse and recommendation placements. Search for your exact brand name is largely unaffected, which is why founders often conclude nothing is wrong.
- Where the breach is severe or device-specific, the reduction is applied for users on the affected devices rather than universally.
- If quality remains poor, Play can display a warning on the store listing itself, seen by users deciding whether to install.
- Once the 28-day average moves back below the threshold, the treatment lifts.
The commercially important detail is the second step. Reduced discovery looks exactly like a seasonal dip, a competitor launch, or an algorithm change, and teams routinely misattribute it to all three. If organic installs fall while your brand-name search traffic holds steady, open vitals before you open your ASO tooling. We have written separately about the ranking signals Play weighs, and technical quality sits underneath all of them.
An install drop with flat brand search, flat conversion rate and no metadata change is the classic vitals signature. The instinct is to rewrite the listing or raise ad budget. Both are expensive ways of not fixing the problem, and the second is worse — you are paying to send traffic to a listing that may be carrying a warning.
What are the startup and rendering ceilings nobody talks about?
Google publishes explicit definitions of excessive startup time and excessive rendering, and while they do not carry the same enforcement weight as crashes and ANRs, they are the vitals most directly connected to whether a new user ever reaches your activation moment.
The startup thresholds, from Android's app startup time documentation, are measured using Time to Initial Display:
Rendering has two published definitions: excessive slow frames, meaning more than 50% of frames in a session are slow, and excessive frozen frames, meaning more than 0.1% of frames take longer than 700 ms.
Five seconds sounds generous until you consider where it is measured. Cold start on a 4 GB device on a congested network is a different event from cold start on the flagship sitting on the developer's desk, and Time to Initial Display measures the first frame — not the first useful frame. An app that paints a splash screen in 1.2 seconds and then shows a spinner for six more passes this threshold comfortably while failing the user completely.
That gap between the metric and the experience is why we treat startup as a retention input rather than a compliance one. The number that predicts whether someone comes back is time to something they can act on, and it is worth instrumenting separately from anything Play reports. Our guide to the UX decisions that drive retention covers where that instrumentation belongs in the funnel.
What changes in February 2027?
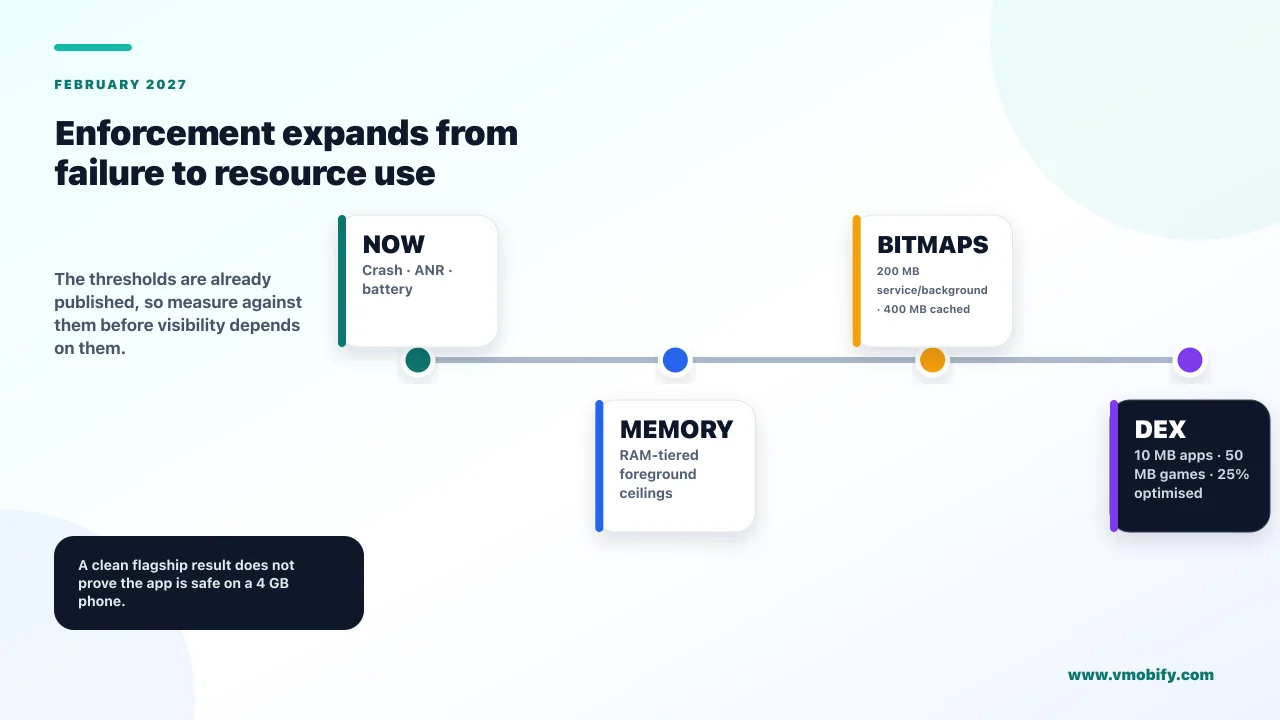
Memory usage, bitmap memory and DEX code optimization begin affecting store visibility, which extends vitals enforcement from "does your app crash" into "how much of the device does your app consume". The thresholds are already published, which means the window to measure yourself against them is now, not in 2027.
Three things are landing together:
- Memory usage, measured as anonymous RSS plus swap, tiered by the device's physical RAM, with separate and more generous ceilings for games. On a 4 GB device an app may use 2.00 GB in the foreground; a game may use 2.25 GB.
- Bitmap memory, capped at 200 MB for user-perceived services, 200 MB in the background and 400 MB cached.
- DEX code optimization, requiring apps with more than 10 MB of DEX code — or games above 50 MB — to reach at least 25% optimization, obfuscation and shrinking.
Google has separately written about the system-level direction of travel in its guidance on memory efficiency for Android 17, which describes the platform killing processes that exceed their budget without an associated stack trace. That last detail matters operationally: a memory kill does not arrive in your crash reporter looking like a crash. It arrives as a user who says the app "closed by itself" and a session that simply ends.
Measure your foreground memory on a 4 GB device now, not on your development handset. If you are within a few hundred megabytes of the tier ceiling, you have a year to reduce it rather than a quarter. Teams that discover this in February 2027 will be doing memory work under distribution pressure, which is the worst possible time for it.
The DEX threshold is the easiest of the three to satisfy and the easiest to overlook, because it is a build configuration question rather than an architectural one. If R8 is running in your release builds with shrinking and obfuscation enabled, you are likely already compliant; if your release build disables them to make stack traces readable, you are not.
Which vital should you fix first?
ANRs on your highest-install device model, then crashes on the same list, then everything else — because that ordering fixes the vital most likely to be both unmeasured and enforced, on the devices where it costs you the most installs.
The triage order we use, and why it is in this order:
- ANR rate, per device model. Most likely to be invisible in your existing tooling, heavily weighted on Android, and frequently concentrated on specific OEM builds. Start here even if the overall number looks acceptable.
- Crash rate, per device model. Same per-device logic. A device at 8% is an emergency regardless of your 1.1% average.
- Crash and ANR rate overall. Once the device-specific fires are out, the aggregate is what keeps you below the 1.09% and 0.47% bars.
- Foreground memory on 4 GB devices. Not yet enforced, enforced from February 2027, and the change with the longest engineering lead time.
- Cold start time to a useful first screen. Not enforced in the same way, but the strongest link between technical quality and activation.
- Wake locks and battery. Real thresholds, but rarely the binding constraint for a typical consumer app unless you run background work.
Two things are deliberately not at the top of that list. Overall crash-free rate is not first, because it is the number every team already watches and the one least likely to hold a surprise. And startup time is not first, because although it matters more to retention than anything else here, it is not what is currently suppressing your distribution.
If you are running paid acquisition while any of the top three are breached, the honest advice is to fix them before scaling spend. You are buying installs into a product that Play has already decided to show to fewer people, and the store-listing conversion rate you are paying for is being measured against a listing that may carry a warning. Our guide to soft launch go/no-go gates treats vitals as a release gate for exactly this reason.
How long does visibility take to recover after you ship the fix?
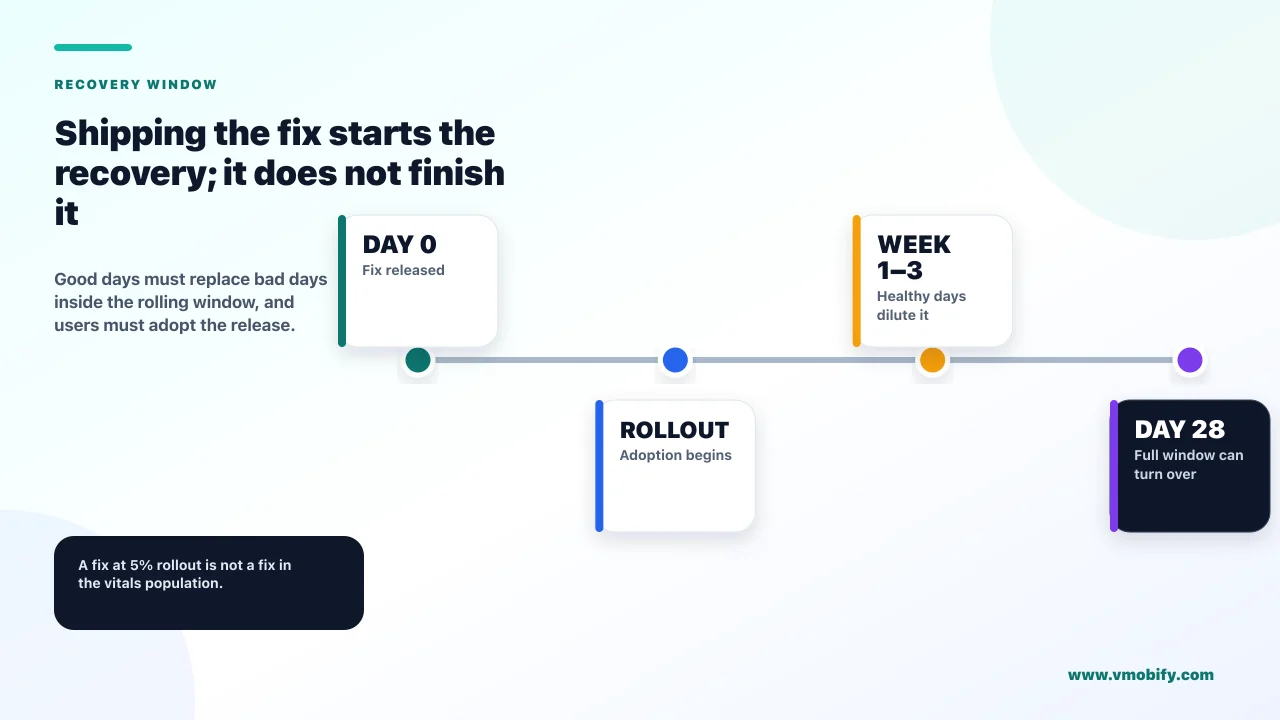
Longer than the fix takes to ship, because Play evaluates on a rolling 28-day average and your good days have to outweigh the bad ones already inside that window. This is the part teams consistently underestimate, and it is the reason a "we fixed it, why are installs still down" conversation happens two weeks after every remediation.
The mechanics are straightforward once you see them. On the day you ship, the 28-day window still contains 28 days of the old behaviour. Each subsequent day, one bad day drops out and one good day enters. The average moves gradually rather than stepping down, and it only crosses back below the threshold once enough of the window has turned over.
Two factors change how fast that happens:
What speeds recovery up
- Fast adoption of the new version — the metric is dominated by whichever build most of your users are actually on
- A staged rollout raised quickly once the new build's own vitals look clean
- A large active base, so each day contributes more sessions to the average
What slows it down
- Slow update adoption — users on the old build keep feeding bad sessions into the window
- Holding a staged rollout at a low percentage out of caution
- A small or low-frequency install base, where daily sample sizes are thin
The practical implication is that update adoption is part of your remediation plan, not a separate concern. Shipping a fix to 5% of users and leaving it there for a fortnight is not a fix as far as your vitals are concerned. Raise the rollout as soon as the new build's own crash and ANR figures are clean, and monitor the per-version breakdown in Play Console rather than the blended number, which will lag badly.
Tell whoever is watching the install graph that recovery is measured in weeks, not days, and that the curve will be gradual rather than a step change. We have seen teams ship a correct fix, panic at the flat graph after five days, and start changing metadata and creative on top of it — which then makes it impossible to attribute the eventual recovery to anything.
What does a monthly vitals review look like for a small team?
Twenty minutes, once a month, looking at five things in Play Console — and the discipline is entirely in looking at the per-device breakdown rather than the headline numbers. This does not need an engineering process or a dashboard project.
The five things, in order:
- Overall crash and ANR rate against the thresholds. Are you below 1.09% and 0.47%, and which direction has the trend moved this month?
- The same two metrics sorted by device model. Cross-reference the worst offenders against your top ten install-driving devices. Anything on both lists is the month's priority.
- The per-version breakdown. Is the newest release better or worse than the one before it? This catches regressions before they reach the 28-day average.
- Cold start time, and separately your own instrumented time-to-first-useful-screen if you have one.
- Foreground memory on your lowest-RAM supported tier, against the February 2027 ceilings.
Write down the five numbers each month. The value is almost entirely in the trend rather than the absolute figure, and a threshold breach is far easier to act on when you can see the three months of drift that led to it. Teams that only look at vitals when something is wrong have no way to distinguish a new problem from an old one that finally crossed a line.
For teams running an agentic or automated testing setup, the device-matrix question is where that tooling pays for itself — our write-up on agentic Android testing with Maestro covers building the device coverage that surfaces per-model failures before users do. On the measurement side, the analytics stack comparison sets out where crash and performance data belongs relative to product analytics.
If you would rather have this run against your app than run it yourself, tell us which devices dominate your install base and we will start with the per-model breakdown.
Which mistakes make vitals worse while you are trying to fix them?
The most expensive mistakes in vitals remediation are not engineering errors — they are measurement and sequencing errors that make a correct fix look like a failed one. Six recur often enough to name.
- Reading the blended number instead of the per-version one. After a release, your overall vitals contain both builds. The blended figure will look barely improved for a fortnight and tell you nothing about whether the fix worked. Look at the new version in isolation.
- Fixing the loudest crash instead of the most frequent one. Crash reporters sort by issue, and a dramatic stack trace from a rare edge case will often sit above a mundane one affecting far more sessions. Sort by affected users, not by novelty.
- Suppressing ANRs by moving work to a background thread that then blocks anyway. Moving a long operation off the main thread fixes the ANR only if the main thread stops waiting for it. A synchronous wait on a background result is still an ANR.
- Disabling shrinking and obfuscation in release builds to get readable stack traces. Understandable, and it puts you on the wrong side of the DEX optimization threshold from February 2027. Upload mapping files instead and keep R8 enabled.
- Changing metadata, creative and code in the same week. If you alter the listing while remediating vitals, you will never know which change moved the install curve. Fix the technical problem, let it settle, then run creative tests.
- Testing only on flagship hardware. The per-device threshold exists precisely because behaviour diverges by model. A test matrix that does not include a 4 GB mid-range device from the manufacturer that dominates your install base is not testing the thing being measured.
Underneath all six is a single idea worth carrying out of this article. Android vitals is not a code quality score — it is a distribution control with published numbers attached. Teams that treat it as an engineering hygiene metric review it quarterly and discover breaches after the install damage is done. Teams that treat it as a growth metric check it monthly, per device, and usually never breach at all.
The uncomfortable corollary is that technical quality is one of the few growth levers where the work is entirely invisible to the user when it succeeds. Nobody notices the ANR that did not happen. But the failure modes of the first 90 days are full of apps that were never bad enough to be obviously broken, and never good enough to be shown.
Frequently Asked Questions
What is a good crash rate for an Android app?+
Google's bad-behaviour threshold is 1.09% user-perceived crash rate averaged across devices, and 8% for any individual phone model. Those are the points at which Play can reduce your distribution, not targets to aim at. Most teams set an internal ceiling comfortably below the published figure so that normal variance never brings them close to it, but any specific safety margin is an internal choice rather than a Google requirement.
Why does Play Console show a different crash rate from Crashlytics?+
They measure different things over different populations. Play Console counts user-perceived crashes among users who opted into sharing diagnostics, on a rolling 28-day average. Crashlytics counts every crash it can catch, foreground and background, across every session where the SDK initialised, over whatever window you select. Neither is wrong, and reconciling them into one number is not a useful goal.
Does a high crash rate directly affect my Google App campaign bidding?+
There is no official Google Ads documentation stating that crash rate is a direct input to App campaign bidding or delivery. The connection that can be defended is indirect: poor vitals reduce store visibility, reduced visibility affects organic installs and store-listing conversion, and conversion rate does affect campaign efficiency. Treat the chain as real but indirect rather than claiming a direct bidding signal.
What counts as an ANR, and why is it worse than a crash?+
An ANR is an Application Not Responding event, triggered when the main thread is blocked long enough that the system offers to close the app. It is not an exception, so nothing is thrown and nothing is caught, which is why crash reporting SDKs often surface ANRs weakly. It is not inherently worse than a crash, but it is far more likely to go unnoticed while still counting against a published threshold.
How long does it take for Play to restore visibility after I fix a vitals problem?+
Weeks rather than days. Play evaluates on a rolling 28-day average, so the window still contains the old behaviour on the day you ship. Each day one bad day drops out and one good day enters, and the treatment lifts once the average crosses back below the threshold. Fast update adoption is the main lever you control — a fix that most of your users have not received yet barely moves the number.
Do the February 2027 memory thresholds apply to my app already?+
The thresholds are published now, but they begin affecting store visibility from February 2027. In practice that means you can measure yourself against them today without any distribution consequence, which is the point of the lead time. The ceilings are tiered by the device's physical RAM and are more generous for games than for apps, so measure on your lowest-RAM supported tier rather than on a development handset.
What is the maximum size an Android app can be?+
Google's own documentation currently disagrees with itself on this. The reduce-app-size guidance states a 200 MB compressed download restriction for apps published with app bundles, while the App Bundle FAQ states a 500 MB maximum compressed download for the base module, with a 4 GB cumulative limit to any single device. Both pages were live at the time of writing. Signed APKs are restricted to 100 MB. Check both pages before planning around either figure, and use Play Feature Delivery or Play Asset Delivery to exceed the base limits.
Sources
- Android Developers — Android vitals overview and thresholds — The source of every bad-behaviour threshold quoted here, including the February 2027 memory and DEX vitals
- Android Developers — ANRs — What triggers an ANR and how Play measures the rate
- Android Developers — Diagnose and fix ANRs — The practical debugging path once Play Console shows an ANR problem
- Android Developers — App startup time — Definitions of excessive cold, warm and hot startup, measured as Time to Initial Display
- Play Console Help — Monitor technical quality with Android vitals — Operational detail on how Play surfaces and evaluates vitals
- Android Developers Blog — Raising the bar on technical quality on Google Play — Origin of the per-device thresholds and the store-listing quality warnings
- Android Developers Blog — Prioritizing memory efficiency for Android 17 — Platform-level memory enforcement, including process kills with no associated stack trace
- Android Developers — Reduce your app size — Size guidance and the directional statement on install success; note the size discrepancy with the App Bundle FAQ
About the author
Amol Pomane — Founder, Vmobify
Amol leads Vmobify, a mobile app growth agency that has driven 30M+ downloads and ranked 54K+ keywords across 300+ apps since 2013. He writes about ASO, paid user acquisition, retention, and the operational reality of scaling mobile apps in India and global markets.