Best Mobile Analytics Tools: What to Use at Each Stage
Most teams pay for a product analytics tool a year before they need one, and then never instrument it properly. This is a vendor-by-vendor comparison of the mobile analytics tools worth using — Firebase, Amplitude, Mixpanel and PostHog — with every free-tier allowance checked against the vendor's own pricing page as of August 2026, and a plain answer on when free is genuinely enough.

On this page
- What does a mobile analytics tool actually have to do?
- Why is Firebase the correct answer for most apps starting out?
- When does a product analytics tool become worth paying for?
- How do Amplitude, Mixpanel and PostHog actually differ?
- What does an analytics tool NOT do that teams expect it to?
- How do analytics and attribution tools fit together?
- What does a sane analytics setup cost at each stage?
- Which mistakes make analytics data useless regardless of tool?
- Frequently Asked Questions
What does a mobile analytics tool actually have to do?
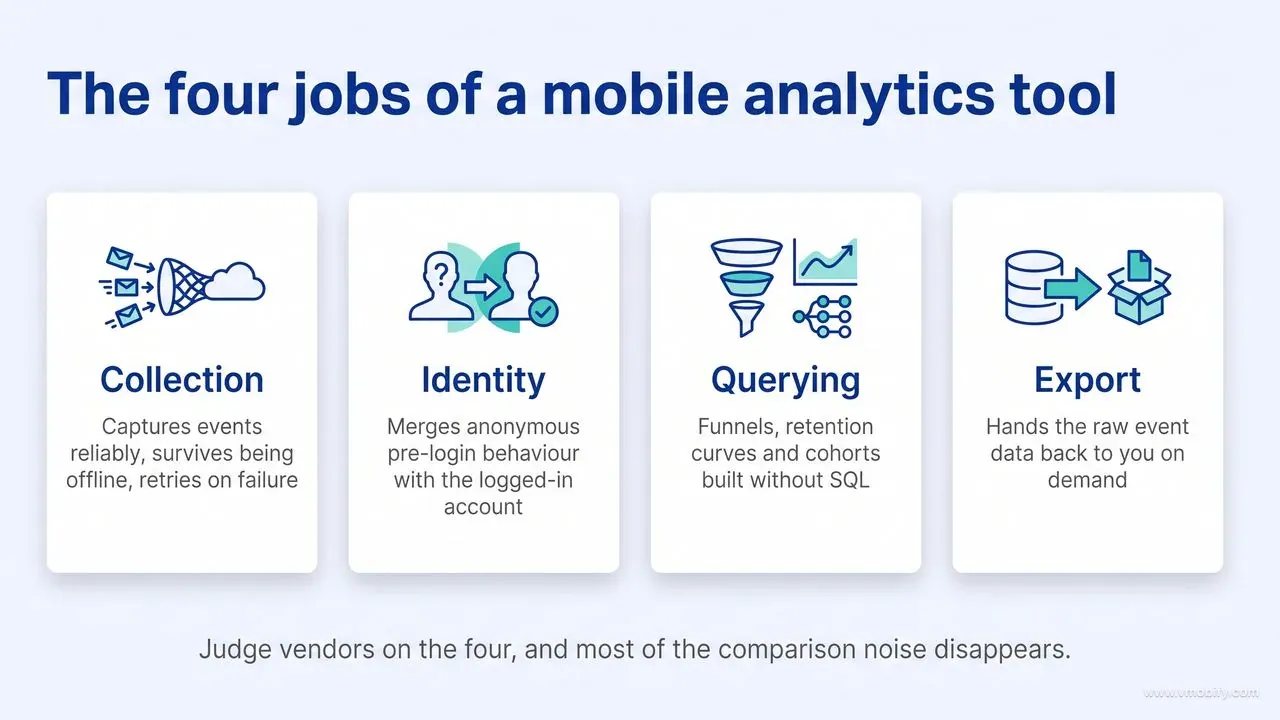
A mobile analytics tool has exactly four jobs: capture events from the app reliably, stitch those events to a stable identity, let a non-engineer ask questions of the resulting record, and hand the raw data back to you on demand. Every feature list you will read is decoration on top of those four. Judge vendors on the four, and most of the comparison noise disappears.
The first job is collection. An SDK sits in your app, batches events, survives being offline, retries on failure and does not measurably degrade cold-start time or battery. This sounds solved and mostly is, but the failure modes are quiet: events dropped when the app is killed mid-session, events double-counted after a retry, a queue that silently truncates on a slow network. On the entry-level Android devices that dominate India, the offline and retry behaviour of an SDK matters far more than the analysis features that get demoed to you.
The second job is identity. Before someone signs in, they are a device; afterwards they are a user, and possibly a user with three devices. If the tool cannot merge the anonymous pre-login behaviour with the post-login account, your entire acquisition-to-activation funnel breaks at the exact step you care most about. Ask any vendor how their identity merge works and what happens when it is called late — the answers vary far more than the marketing pages suggest.
The third job is querying: funnels, retention curves, cohorts and segments built by someone who cannot write SQL. This is where the free and paid tiers genuinely diverge, and it is the real reason teams eventually pay. The fourth job is export, which is the one teams skip and later regret. If your events cannot be shipped to a warehouse in raw form, your analytics history is only as durable as your vendor relationship and your retention setting.
One boundary before we start comparing. This post is about which vendor to pick and when. The methodology — how to define activation, how to build a cohort, how to pick a north-star metric — is covered in our guide to mobile app funnel analytics, and the wider picture of what else belongs in a growth stack sits in our app growth tools stack roundup. Assume that methodology here; we are only choosing tools.
A note on how the numbers in this post were gathered. Every free-tier allowance and every price quoted below was read off the vendor's own pricing or documentation page in August 2026, and where a vendor does not publish a price, this post says so rather than guessing. Analytics pricing changes several times a year. Treat every figure as accurate on the date given and verify before you commit budget.
Why is Firebase the correct answer for most apps starting out?
Firebase Analytics is free, ships with the SDK most mobile teams already have installed, and answers the questions a pre-product-market-fit app actually has — which makes it the right default for the overwhelming majority of apps, and there is no shame in staying on it for years. Google describes it as an app measurement solution available at no charge, and as of August 2026 the Firebase pricing page lists Google Analytics as a no-cost product on both the Spark and the Blaze plan.
The free scope is broader than most teams realise. That same page lists Crashlytics, A/B Testing and Cloud Messaging as no-cost on both plans too. That is your analytics, your crash reporting, your push channel and your experiment framework in one bill of zero. One caveat worth diarising: the page also notes that from 1 September 2026, Remote Config moves to a flexible pricing structure, so if your app leans heavily on Remote Config, check what that means for you before it lands.
The limits are real but they are limits of shape, not of volume. Google's documented collection limits for app data streams are 500 distinctly named events per app user, 25 parameters per event, 25 user properties per property, and character caps of 40 on event names and 100 on most parameter values. Two details there are widely misread. The 500 is scoped per app user rather than per property, so a property can legitimately report more than 500 distinct event names when different app instances fire different events. And automatically collected events and enhanced measurement events do not count towards the limit at all, which buys back more headroom than most teams assume. You are not going to be billed for exceeding these; you are going to be blocked. In practice teams hit the parameter ceiling long before the event ceiling, because they try to hang an entire object off a single event rather than modelling it properly.
The constraint that quietly costs the most is retention. Google's data-retention settings for standard properties offer a choice between 2 months and 14 months for event and user-level data, with only 360 properties able to select the longer 26, 38 and 50-month windows. Worse, the setting is not always yours to keep. Google's documentation states that Large and XL properties are limited to 2 months, and that when a standard property crosses into Large, the event-level retention setting is automatically reduced to 2 months and event-level data older than 2 months becomes inaccessible and is permanently deleted. That is exactly the property a growing app turns into. If you never touch the setting and later want a year-on-year cohort comparison, the data is simply gone. This is the single most common irreversible analytics mistake we see across the 300+ apps we have managed since 2013, and it takes about ninety seconds to prevent.
The prevention is BigQuery export, and you should turn it on the week you ship — but with clear eyes about what the free path actually gives you. Firebase's export documentation notes that projects on the no-cost Spark plan can use the BigQuery sandbox, while Blaze projects get the full feature set subject to standard BigQuery pricing. The sandbox, though, is an evaluation environment rather than an archive. Google's sandbox documentation states that all BigQuery datasets have a default table expiration time and that all tables, views and partitions automatically expire after 60 days, and that the sandbox does not support streaming data; it also caps you at 10 GB of active storage and 1 TB of processed query data a month. Google Analytics adds a ceiling of its own on top: standard properties have a daily BigQuery Export limit of 1 million events, and Google is explicit that exports exceeding the sandbox limits incur charges. Read literally, the Spark-plus-sandbox route loses your history after 60 days — shorter than the 14-month retention setting it was supposed to insure you against.
So treat the sandbox as a way to prove the pipeline works, then make it durable, which means one of two things. Enable billing to move the project onto Blaze and then reset the default table expiration on the dataset and on the exported tables so they stop expiring — upgrading alone does not clear an expiry that has already been stamped on. Or keep the sandbox and copy each day's export into storage you control before the 60-day clock runs out. Either way the payoff is the same: your raw event history ends up somewhere the retention slider cannot reach, and any future migration to a paid analytics tool becomes a backfill rather than a fresh start. Just do not tell yourself the box is ticked when only the sandbox is switched on, because that is the version of this advice that quietly fails.
The honest verdict: if you are pre-revenue, running one app, and your analytics questions are "did people finish onboarding" and "do they come back on day 7", Firebase answers them and you should not be paying anyone. The reason agencies rarely say this out loud is that a free recommendation earns nobody a referral. It is still the right answer more often than not.
When does a product analytics tool become worth paying for?
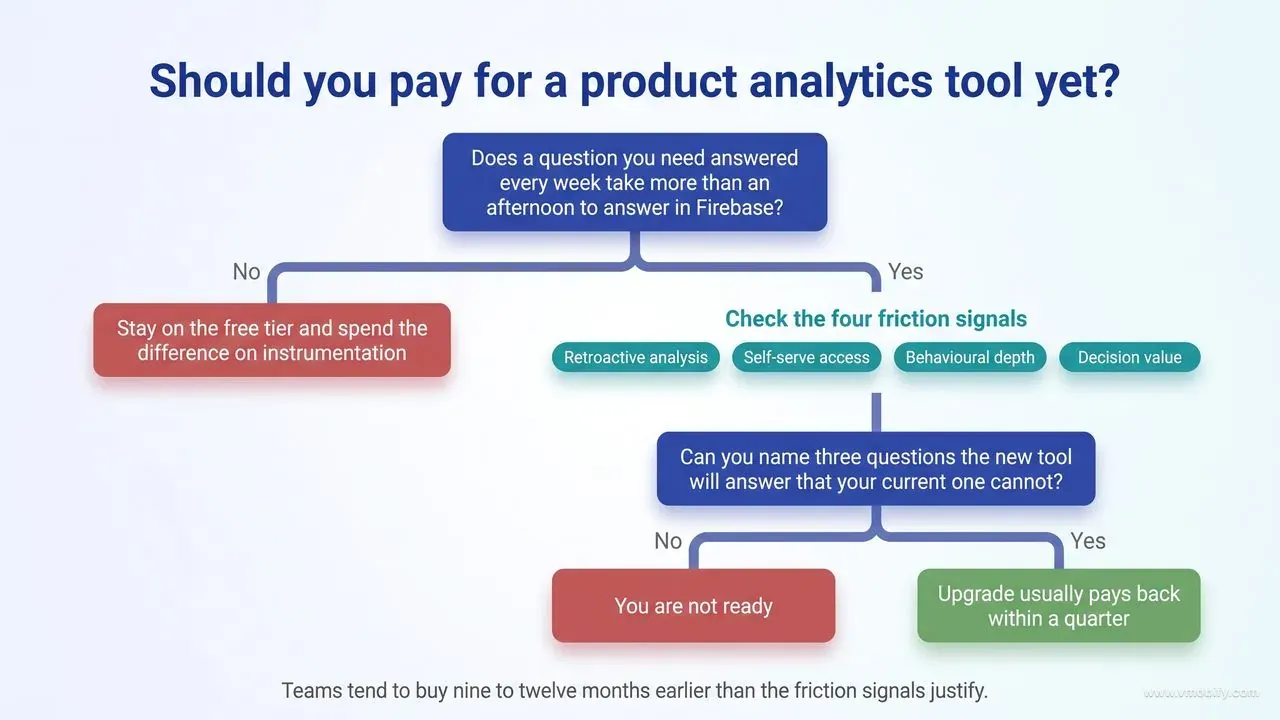
You should move to a dedicated product analytics tool when a question you need answered every week takes more than an afternoon to answer in Firebase — not when you cross a revenue number, and not because a competitor mentioned Amplitude in a podcast. The trigger is analytical friction, and it is easy to recognise once you know what it looks like.
There are four friction signals worth acting on. The first is retroactive analysis: you want to build a funnel across steps you did not think to define in advance, over data you already collected. Firebase's model rewards funnels you planned; product analytics tools are built to let you assemble a funnel from any events after the fact. When your best questions keep arriving a month too late to instrument, that is the signal.
The second is self-serve access. If your product manager, your designer or your growth lead has to ask an engineer every time they want a segment, you are paying for the tool anyway — in engineering hours, at a much worse rate. The value of the paid tools is very often organisational rather than technical: they move analysis out of the engineering queue. That is a real benefit and worth real money, but be honest that it is what you are buying.
The third is behavioural depth: path analysis, retroactive cohorts, per-user event streams you can read like a story, and correlation between an early behaviour and long-term retention. These are genuinely hard to reconstruct in the free stack without a warehouse and an analyst. If you have found your activation moment and now need to know which behaviours predict it, the paid tools shorten that work substantially.
The fourth is decision value. A tool is worth paying for when a single decision it improves is worth more than a year of the subscription. For a subscription app deciding where to place a paywall, or a marketplace deciding which onboarding branch to keep, that bar is cleared easily. For a pre-launch app with 400 weekly users, no analysis is worth $500 a month because there is not enough data to be wrong about yet.
In our portfolio the clearest pattern — an internal observation across the apps we have run, not an industry benchmark — is that teams tend to buy something like nine to twelve months earlier than the friction signals justify. The subscription starts, the SDK gets added, and then nobody defines the taxonomy, so the expensive tool ingests the same shallow events the free one had — with the added downside that two systems now disagree. If you cannot name the three questions the new tool will answer that your current one cannot, you are not ready. When you can name them, the upgrade usually pays back within a quarter. Our analytics team spends a surprising amount of its time telling clients to stay on the free tier a little longer and spend the difference on instrumentation.
How do Amplitude, Mixpanel and PostHog actually differ?
All three are competent behavioural analytics tools with real free tiers; the meaningful differences are how much volume they give away, whether they publish what the next tier costs, and how much of the surrounding product stack they try to absorb. The figures below were read from each vendor's own pricing page in August 2026 and should be re-checked before you commit.
Amplitude
- The Amplitude pricing page lists a Free plan at no cost with 2M events a month described as free forever, 10K monthly session replays and unlimited seats.
- Above it sits a self-serve Plus plan that also starts at $0 with the first 2M events a month free, needs a card on file, and comes with an on-page bill estimator and published event-volume tiers running to 20M; Growth and Enterprise are shown as custom pricing with a contact-sales action.
- Amplitude's own framing is that every plan includes the full platform and unlimited seats. Treat that as the vendor's marketing rather than as an independent finding, because the tier table on the same page gates real analysis capability.
- Custom events and formulas, 20 behavioural cohorts, alerts and heatmaps start at Plus. Feature Experiment, Web Experiment, unlimited guides and surveys, SSO and project permissions, and account-level (group) analytics are Growth and Enterprise only, with data access controls and role-based permissions at Enterprise.
- Seats are genuinely unlimited everywhere; the analysis surface is not.
Mixpanel
- The Mixpanel pricing page lists a Free plan starting at $0 with unlimited seats, up to 1M events a month, 10K session replays a month, up to 1k monthly experiment users and up to 10 active feature flags, alongside funnel and retention analysis.
- Growth also starts at $0 and is priced through an on-page slider that runs to 20M events a month with volume discounts, and it can be bought online without speaking to anyone; only Enterprise is contact-sales.
- One correction to a comparison that gets repeated a lot: bundled flags are not a Mixpanel differentiator. All three vendors ship flags or experiments on their free tier, and Mixpanel's free allowance is the tightest of the set at 10 active flags and 1k monthly experiment users, against PostHog's 1M free feature flag requests and Amplitude's stated unlimited feature flags and web experimentation on Free.
- Mixpanel's real advantages are the shallower learning curve and the fact that its mid tier carries a price on the page.
PostHog
- The PostHog pricing page publishes monthly free allowances across products — 1M analytics events, 1M feature flag requests, 100K error-tracking exceptions and 1500 survey responses — and, unusually, publishes a static per-unit rate card beyond them, starting from $0.00005 per event for product analytics and $0.0001 per feature flag request, with rates decreasing at higher volume.
- Session replay needs care in a mobile context. The headline 5k free recordings is the web figure; PostHog meters mobile recordings separately at 2.5k free a month, and charges roughly double for them afterwards — about $0.0100 per mobile recording against $0.0050 per web recording in the first paid band.
- For a mobile-only app, the effective free replay allowance is half what most comparison tables quote.
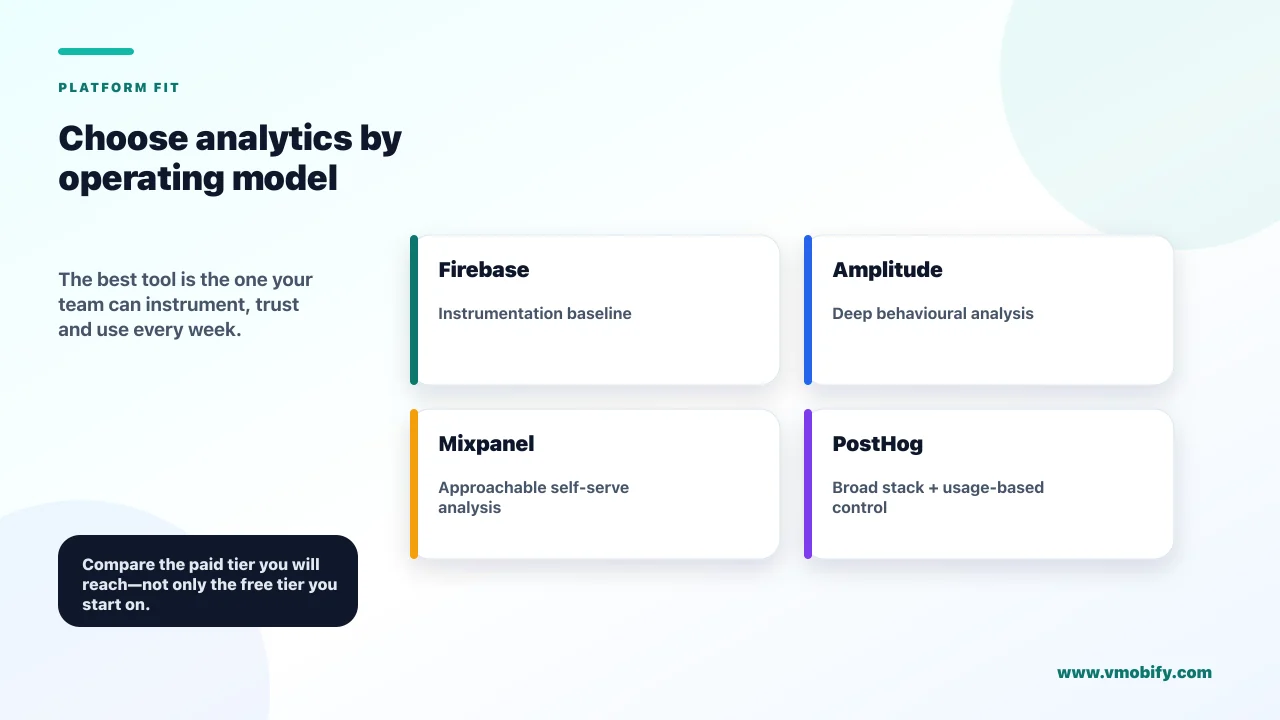
So how do you choose between them? On pricing transparency the honest ranking is narrower than the marketing on any of these sites suggests. PostHog is the only one publishing a static rate card you can model in a spreadsheet, but Mixpanel publishes a self-serve Growth calculator with an online purchase path and Amplitude publishes a Plus bill estimator, so a mid-sized team can get a real number out of any of the three without booking a call. Only Amplitude Growth and Enterprise and Mixpanel Enterprise are genuinely quote-based. Beyond price: if you want the deepest behavioural analysis surface and expect analysts in the tool, Amplitude has the largest free event allowance of the three, though the analysis features that make it worth choosing sit behind Plus and above. If you want a broad stack from one vendor at published rates, PostHog is the distinctive option. If you want a light learning curve, Mixpanel is the most approachable starting point.
Two caveats that vendor comparisons usually omit. First, mobile SDK maturity varies more than web SDK maturity across all three — check each vendor's current platform support documentation for your specific stack, particularly if you are on React Native or Flutter, rather than assuming parity with their web offering. Second, free tiers are acquisition instruments. Every one of these vendors expects your event volume to grow past the free line, and the tier you should evaluate is not the one you start on but the one you will be on in eighteen months. Ask for that quote before you migrate, not after.
What does an analytics tool NOT do that teams expect it to?
An analytics tool records behaviour; it does not explain behaviour, attribute installs, fix bad instrumentation, or decide anything on your behalf — and most disappointment with analytics spending comes from expecting one of those four. Naming the gaps up front saves a lot of money and a lot of arguing.
It does not tell you why. Your funnel will show a 40% drop at step three with complete precision and total silence about the cause. The why comes from session recordings, from support tickets, from store reviews and from actually watching five people use the app. Quantitative analytics tells you where to point the qualitative work, and that is an enormous contribution, but a team that reads a drop-off chart and immediately ships a fix is guessing with better graphics.
It does not attribute paid installs. This is covered properly in the next section, but it deserves saying plainly here because it is the most expensive misunderstanding in the category: your product analytics tool does not know which ad campaign a user came from unless something else tells it, and under current privacy frameworks that something else has real limits.
It does not repair instrumentation. If your event taxonomy is inconsistent, an expensive tool will render inconsistent data faster and more attractively. Analytics tools have no view on whether your checkout_complete event is fired before or after payment confirmation, whether two platforms name the same action differently, or whether a release quietly stopped sending an event. Those are engineering discipline problems and no vendor sells a fix.
It does not run your experiments for you. Several of these tools now ship feature flags and experiment modules, and they are useful, but the statistical decisions — sample size, run duration, how many metrics you are allowed to look at — are yours. A tool that surfaces a colourful "winner" badge after four days on 300 users has told you almost nothing. Our comparison of A/B testing tools for apps goes into which parts of that job are worth outsourcing to a vendor.
It does not give you competitor or market data, it does not replace a data warehouse for anything involving joins to your own backend tables, and it does not measure the parts of your business that live outside the app. Revenue reconciliation in particular should be settled against store and billing records, never against client-side events, because client events under-report on failed network calls and over-report on retries. Treat the analytics number as directional and the billing number as true.
Finally, it does not create a culture of measurement. We have onboarded teams with three analytics tools and no shared definition of an active user, and teams with only Firebase and a weekly ritual of reading it together. The second group consistently makes better decisions. The tool is the cheapest part of analytics; the habit is the expensive part.
How do analytics and attribution tools fit together?
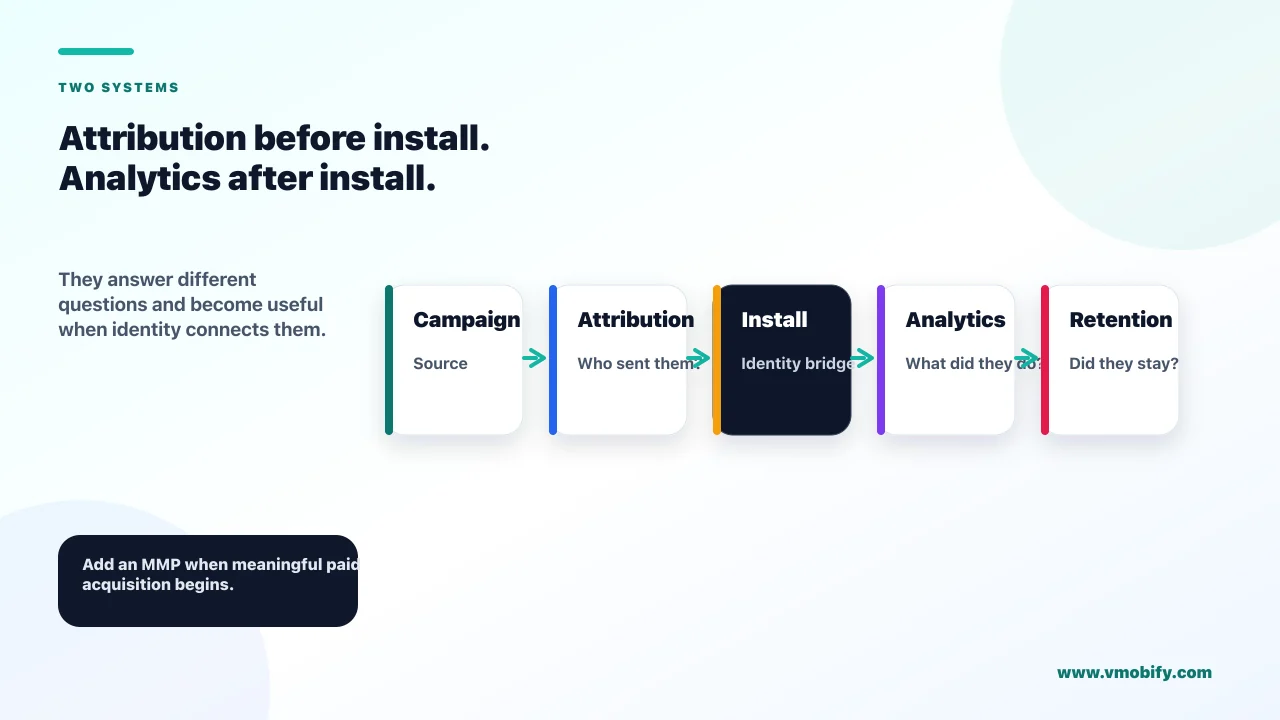
Analytics tells you what a user did inside your app; attribution tells you where that user came from — they answer different questions, sit at different points in the funnel, and neither one substitutes for the other. Teams that try to run paid acquisition on product analytics alone consistently misread their own channel performance.
The split is cleanest when you think about the moment of the install. Everything before that moment — the ad impression, the click, the store visit, the install itself — is attribution territory, and it is measured by a mobile measurement partner such as AppsFlyer, Adjust or Singular, working within the privacy frameworks the platforms impose. Everything after the install — onboarding, activation, feature adoption, retention, purchase behaviour — is analytics territory. Our comparison of AppsFlyer, Adjust and Singular covers how to choose among the MMPs; this post deliberately does not repeat it.
The privacy layer is why you cannot collapse the two. On iOS, install attribution now runs through Apple's privacy-preserving frameworks — SKAdNetwork and its successor AdAttributionKit — rather than through a device identifier, which means aggregated, delayed and deliberately coarse signals. Apple's SKAdNetwork documentation now opens with an explicit note telling developers to use AdAttributionKit for app ad campaigns on the App Store and alternative marketplaces, which is as clear a statement of direction as Apple gives. That documentation is the primary reference and is worth reading rather than taking a vendor's summary of it. The practical consequence for tool selection is that no product analytics tool can reconstruct install attribution on its own, however sophisticated it looks, because the underlying data is never exposed to it in the first place.
The same asymmetry runs the other way. An MMP sees the install and the campaign but has only whatever in-app events you choose to forward to it, usually a handful of post-install milestones sent so that ad networks can optimise against them. It is not a behavioural analysis tool and it will not answer questions about screen paths, feature adoption or the shape of your retention curve. Teams that try to run product decisions out of an MMP dashboard end up with a very expensive install counter and no view of the product at all.
On MMP pricing, it is worth noting what is and is not published, and reading the footnotes rather than the headline. As of August 2026, AppsFlyer's pricing page lists a free Zero plan, a Growth plan, and a custom-priced Enterprise plan that requires contacting sales. The 12K free conversions everybody quotes are a Welcome Package covering the first year on both Zero and Growth, not a Zero-plan allowance — and AppsFlyer's own asterisk says Zero is not suitable for apps with paid activities, describing it instead as ideal for apps seeking a simple tool for owned media activities. A team actually running paid campaigns therefore starts on Growth, where conversions are priced at $0.07 each once the Welcome Package is used up. That is still unusually transparent for the category — several MMPs publish no rates at all, and where a vendor does not publish, nobody outside a sales call can honestly quote you a number.
In practice the two systems should be wired together rather than run in parallel. Most MMPs can forward install and campaign data into your analytics tool as user properties, so you can segment in-app behaviour by acquisition source. That single integration is what lets you answer the question that actually matters — not "which channel is cheapest per install" but "which channel produces users who still exist in week four" — and it is the connection most teams postpone until they have already overspent on a channel that looked efficient at the top of the funnel.
The sequencing advice we give clients is simple. If you are not spending on paid acquisition, you do not need an MMP yet, and adding one is complexity with no payoff. The week you start meaningful paid spend, you need one, because organic and paid users behave differently enough that blending them makes both numbers meaningless. Before that week, the free analytics stack and your store consoles are enough.
What does a sane analytics setup cost at each stage?
A well-run analytics setup costs nothing until you are past product-market fit, then typically moves to a single paid product analytics seat, and only becomes a genuine line item when event volume or organisational size forces a quote-based contract. Here is the honest version of each stage, with figures as of August 2026.
Pre-launch and early launch: $0, with one asterisk. Firebase Analytics, Crashlytics and A/B Testing are listed as no-cost on both Firebase plans, and your store consoles supply acquisition data. Add nothing else. The asterisk is BigQuery. On the Spark plan the export lands in the BigQuery sandbox, which expires every table, view and partition after 60 days, does not support streaming, and caps you at 10 GB of active storage and 1 TB of processed query data a month, while standard Google Analytics properties are limited to 1 million exported events a day and anything past the sandbox limits is billed. So budget a few dollars a month for Blaze and BigQuery storage from the moment your history starts to matter, or be honest that the sandbox is a demo. At this stage the binding constraint is that you have too few users for any analysis to be significant, and money spent on tooling is money not spent on finding out whether anyone wants the app. For an early-stage Indian team, that is the difference between a near-free stack and burning ₹40,000 a month on dashboards nobody opens.
Post-product-market-fit, single app: still often $0, sometimes a low-hundreds subscription. This is where the free tiers of the product analytics tools do real work. As of August 2026, Amplitude's free plan covers 2M events a month, Mixpanel's covers up to 1M, and PostHog's covers 1M analytics events, with mobile session replay metered separately from web — 2.5k free mobile recordings a month, and a separate 5k allowance for web. A mid-sized app can sit inside those envelopes for a long time. Two startup programmes are worth checking before you assume you have to pay at all, both published on the vendors' own pricing pages as of August 2026: Amplitude offers a Startup Scholarship of one free year on the Growth plan to startups with under $10M in funding and fewer than 20 employees, and Mixpanel offers a first year free on its Startup Plan to companies founded less than five years ago with up to $8M in total funding that have not redeemed another offer. For a team that qualifies, those convert a tier you would otherwise have to negotiate into $0 for twelve months, which changes the stage recommendation entirely. If you exceed the free lines and do not qualify, PostHog publishes a static rate card you can model from $0.00005 per event, Mixpanel's Growth slider will quote you up to 20M events a month, and Amplitude's Plus estimator will do the same across its published tiers; only Amplitude Growth and Enterprise and Mixpanel Enterprise need a sales conversation.
Scaling with paid acquisition: add an MMP. AppsFlyer's Welcome Package gives 12K free conversions in the first year on both the Zero and Growth plans, but AppsFlyer itself flags Zero as unsuitable for apps with paid activities, so a team that is spending on ads starts on Growth and pays $0.07 per conversion once the package is exhausted; Enterprise is custom-priced. Other MMPs price by attributed conversion volume too, but not all of them publish rates — assume a sales conversation. Budget for this as an acquisition cost, not an analytics cost, because it scales with spend rather than with product usage.
Multi-app or enterprise: quote-based, and negotiate. Above the self-serve tiers — Amplitude Plus, Mixpanel Growth, PostHog's published rate card — every vendor in this category moves to custom pricing, which means your bill depends on your volume, your contract length and how well you negotiate. Two things reliably lower the number: a signed annual commitment, and a credible willingness to stay on the free tier or move to a competitor. Do not accept the first quote, and do not let event volume drift upward unaudited — the most common cause of a surprise renewal is dozens of low-value events that nobody has needed since 2024.
The general shape across our portfolio is that analytics should be a rounding error next to acquisition spend for a long time. When the analytics bill starts approaching a tenth of the media budget, something has usually gone wrong — either the taxonomy is bloated, or the team is buying capability it has not yet learned to use. If you want a second opinion on your specific stack before signing anything, that is a conversation worth having with our team — it takes half an hour and frequently ends with us telling people to keep their money.
Which mistakes make analytics data useless regardless of tool?
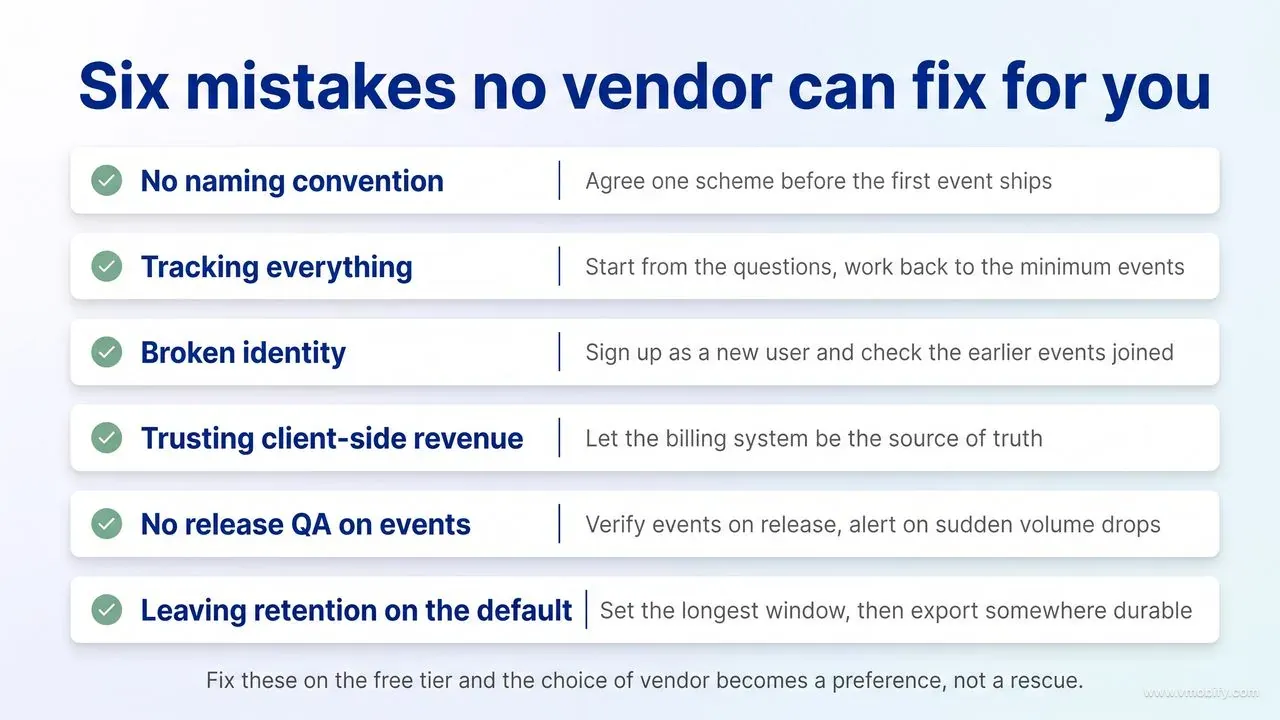
Six mistakes account for nearly every unusable analytics implementation we inherit, and not one of them is fixed by changing vendor: no taxonomy, tracking everything, broken identity, client-side revenue, no release QA, and default retention settings. Fix these on the free tier and you will get more out of Firebase than most teams get out of a five-figure contract.
No naming convention. When one engineer sends purchase_complete, another sends PurchaseCompleted and a third sends purchase_success for the same action, every funnel is wrong and nobody can tell. Agree a single scheme before the first event ships — object then action, lower snake case, no spaces — write it in a document everyone can see, and review new events in code review like any other interface change. This costs an hour and saves quarters.
Tracking everything. Instrumenting every tap produces an event catalogue nobody can navigate, blows through parameter and event-name limits, and inflates volume-based bills for no analytical return. Start from the questions you need answered, work backwards to the minimum events that answer them, and add more only when a real question demands it. In our experience a tight thirty-event taxonomy usually out-performs a sprawling three-hundred-event one, because the questions get answered rather than searched for.
Broken identity. If you never call the identify or user-id method, or you call it after the events that matter, your anonymous and logged-in behaviour never join up and your acquisition-to-activation funnel is fiction. Test this deliberately: sign up as a new user, then check whether the pre-signup events appear on the same profile. Most teams have never checked, and a meaningful share discover the answer is no.
Trusting client-side revenue. Purchase events fired from the client under-report when the network drops and over-report on retries, and they cannot see refunds or failed renewals at all. Use server-side validation or your billing provider as the source of truth for anything financial, and treat the in-app event purely as a behavioural marker. The reconciliation rule we hold clients to is that no revenue number leaves the building unless it came from the billing system, however convenient the analytics chart is.
No release QA on events. Analytics silently rots. A refactor removes a call, a new screen ships without instrumentation, an SDK upgrade changes a default — and nobody notices for six weeks because the dashboard still renders. Add event verification to your release checklist and set an alert for a sudden drop in volume on your top ten events. Across the 300+ apps we have managed since 2013, this one habit has caught more silent data loss than any analysis feature we have paid for — an internal observation rather than a measured study, but a consistent one.
Leaving retention on the default. As covered earlier, standard Google Analytics properties offer only 2 or 14 months of event and user-level retention, and the shorter option is the one that silently costs you your year-on-year comparisons. Set the longest option available to you — but understand that the longest option is not always yours to choose. Google documents Large and XL properties as limited to 2 months, and a standard property that grows into Large has its event-level retention reduced to 2 months automatically, with older data permanently deleted. That is why durable warehouse export, not the retention slider, is the real protection: the slider can be taken away from you by your own growth. Note the word durable. A BigQuery sandbox that expires every table after 60 days is not protection either; the export only outlives the setting once it is running on a billed project with the default expirations cleared, or being copied out to storage you own. Get these six right and the choice between Firebase, Amplitude, Mixpanel and PostHog becomes what it should be — a preference, not a rescue.
Frequently Asked Questions
What is the best mobile analytics tool for a new app?+
Firebase Analytics, for almost every new app. As of August 2026 it is free on both the Spark and Blaze plans, Google documents no-charge reporting with a ceiling of 500 distinctly named events per app user on app data streams, and Crashlytics, A/B Testing and Cloud Messaging are listed as no-cost alongside it. Turn on BigQuery export from day one — but move it off the Spark sandbox before the 60-day table expiry if you want to keep the history.
Is Firebase Analytics really free, and what are the limits?+
Yes. As of August 2026 the Firebase pricing page lists Google Analytics as a no-cost product on both plans. The limits are structural rather than financial: Google documents 500 distinctly named events per app user on app data streams, with automatically collected and enhanced measurement events excluded from that count, plus 25 parameters per event, 25 user properties, and a data-retention choice of 2 or 14 months on standard properties — dropping to a forced 2 months once a property is classified Large or XL.
Amplitude vs Mixpanel — which should I pick?+
As of August 2026 Amplitude's free plan covers 2M events a month with unlimited seats and Mixpanel's covers up to 1M events a month with unlimited seats. Amplitude gives more free volume and a deeper analysis surface, though behavioural cohorts, heatmaps, custom formulas and alerts only start at Plus and experimentation and account-level analytics at Growth. Mixpanel is easier to learn. Both publish self-serve pricing for their mid tiers — Amplitude Plus through a bill estimator, Mixpanel Growth through an on-page calculator with an online purchase path — so only Amplitude Growth and Enterprise and Mixpanel Enterprise are quote-based.
What are the best Firebase Analytics alternatives?+
Amplitude, Mixpanel and PostHog are the three worth evaluating, all of which publish usable free tiers. Move only when you have named three questions the alternative will answer that Firebase cannot — typically retroactive funnels, deeper cohort analysis, or self-serve access for non-engineers.
Does PostHog publish its pricing?+
Yes, and it is the only one of the three publishing a static per-unit rate card. As of August 2026 PostHog publishes monthly free allowances including 1M analytics events, 1M feature flag requests and 2.5k mobile session replay recordings (5k for web), plus per-unit rates beyond them starting from $0.00005 per event, with the rate decreasing at higher volume. Mixpanel and Amplitude publish self-serve calculators for their mid tiers rather than a rate card, so you can still get a number from either without contacting sales.
Do I need an analytics tool and an attribution tool?+
Only once you spend on paid acquisition. Analytics measures behaviour inside the app; an MMP measures where installs came from, under privacy frameworks that limit what any tool can see. Before meaningful paid spend, your analytics tool and your store consoles are enough.
How much should analytics cost at each stage?+
Nothing before product-market fit, since the free tiers cover you (all figures here as of August 2026). After that, most single-app teams stay inside a vendor free tier or a low self-serve plan, and the startup programmes at Amplitude and Mixpanel can cover a year of a paid tier at $0 if you meet their funding and headcount criteria. Above the self-serve tiers — Amplitude Growth and Enterprise, Mixpanel Enterprise — pricing becomes quote-based, so treat it as a negotiation rather than a list price.
Sources
- Firebase — Pricing plans — Lists Analytics, Crashlytics, A/B Testing and Cloud Messaging as no-cost on Spark and Blaze; notes Remote Config moves to flexible pricing from 1 September 2026 (checked August 2026)
- Google Cloud — BigQuery sandbox — All tables, views and partitions automatically expire after 60 days; no streaming data; 10 GB active storage and 1 TB processed query data per month
- Google Analytics Help — BigQuery Export — Standard properties have a daily BigQuery Export limit of 1 million events; exports exceeding the sandbox limits incur charges
- Google Analytics Help — Data retention — 2-month and 14-month retention on standard properties, longer windows 360-only; Large and XL properties limited to 2 months with older event data permanently deleted
- Google Analytics Help — Event collection limits — 500 distinctly named events per app user on app data streams, 25 event parameters, 25 user properties; automatic and enhanced measurement events excluded
- Amplitude — Pricing — Free plan at 2M events/month with unlimited seats; self-serve Plus with bill estimator; behavioural cohorts and heatmaps from Plus, experimentation and group analytics from Growth; Startup Scholarship of one free Growth year under $10M funding and 20 employees (checked August 2026)
- Mixpanel — Pricing — Free plan up to 1M events/month, 10 active feature flags, 1k monthly experiment users; Growth priced by on-page slider to 20M events with Buy Online; Startup Plan first year free under 5 years old and $8M funding (checked August 2026)
- PostHog — Pricing — Free allowances of 1M analytics events and 1M feature flag requests, 2.5k mobile session replays vs 5k web; per-unit rates from $0.00005/event, mobile replays $0.0100 vs web $0.0050 (checked August 2026)
About the author
Amol Pomane — Founder, Vmobify
Amol leads Vmobify, a mobile app growth agency that has driven 30M+ downloads and ranked 54K+ keywords across 300+ apps since 2013. He writes about ASO, paid user acquisition, retention, and the operational reality of scaling mobile apps in India and global markets.