Best ASO Tools in 2026: An Honest Agency Verdict
Most ASO tool roundups are written by people who have never had to justify the invoice. This one is written by an agency that pays for these tools, checked every price against the vendor's own page in August 2026, and will tell you plainly when the answer is to buy nothing at all.
On this page
- What can an ASO tool actually tell you that the stores cannot?
- Which free tools should you exhaust before paying anything?
- When does a paid ASO tool start paying for itself?
- How do the major paid platforms differ in practice?
- How accurate is ASO keyword volume data, really?
- Which tool features are worth paying for and which are decoration?
- What does an ASO tool stack look like at each stage?
- Which tools should you not buy, and when?
- Frequently Asked Questions
What can an ASO tool actually tell you that the stores cannot?
A third-party ASO tool has exactly one capability that Apple and Google do not hand you for free: visibility into apps you do not own. Everything else in the product — the dashboards, the alerts, the exports, the scores — is convenience layered over data you already have access to, or a model built on top of data nobody outside the two stores actually has.
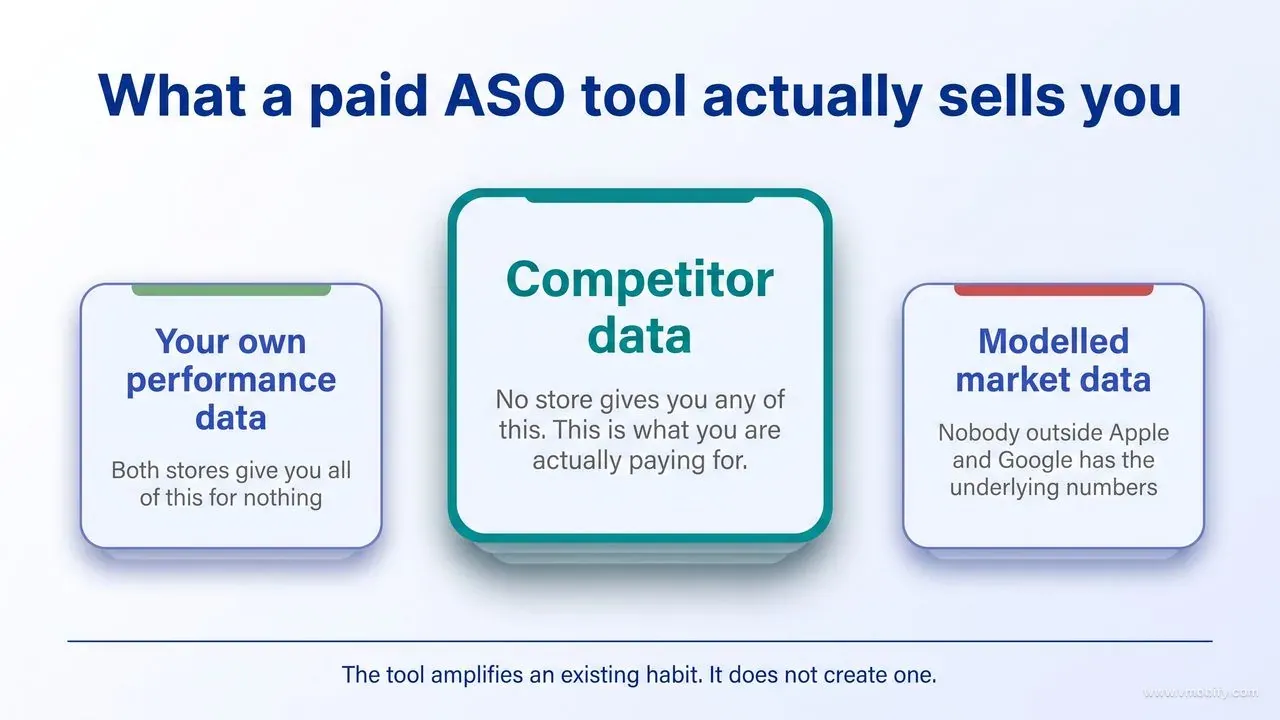
It helps to split the category into three classes of data, because the buying decision collapses into which class you actually need.
- Your own performance data. Impressions, product page views, conversion rate, installs, the channels people arrived through. Both stores give you all of this for nothing, and their version is exact rather than estimated.
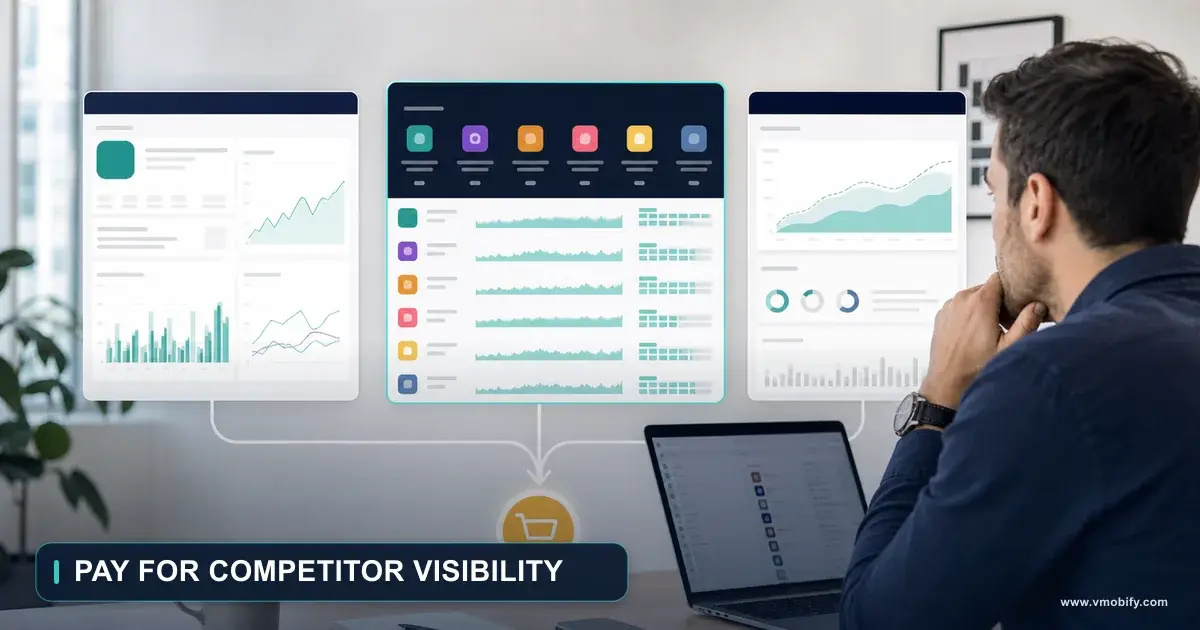
- Competitor data. Which keywords a rival ranks for, when they last changed their icon, how their rank moved after a feature launch. No store gives you any of this. This is what you are actually paying for.
- Modelled market data. Keyword search volumes, category download estimates, revenue estimates. Nobody outside Apple and Google has the underlying numbers, so every figure here is inferred. More on that in the keyword volume section, because it is the single most misunderstood thing about this category.
The free baseline is also asymmetric between the two stores in a way that surprises most teams. Google Play Console's acquisition reporting lets you break performance down by country, language, store listing, install state, UTM campaign and search terms — Google will show you the Play search queries that drove visits to your listing. App Store Connect does not do the equivalent. Apple's acquisition sources are reported as categories — App Store search, App Store browse, app referrer, web referrer, App Clip — with no breakdown by the individual term a user typed.
So the practical shape of the gap is this. On Android you already know which terms bring you traffic and you are missing a demand index. On iOS you have a demand indicator inside Apple Ads and you are missing per-term attribution. A paid tool tries to fill both holes with modelling, and it fills the Android hole far less usefully than people assume, because Google already told you the answer for free.
Across the 300+ apps we have managed since 2013, the accounts that get the most out of a paid ASO platform are the ones that were already reading their store data properly before they bought it. The tool amplifies an existing habit. It does not create one.
If you have not yet exhausted the free tier, our companion piece on free ASO tools covers that ground in detail and is the honest place to start.
Which free tools should you exhaust before paying anything?
Four free capabilities cover the entire ASO loop for a single app in one or two markets: Apple Ads keyword tooling for iOS demand, Play Console acquisition reporting for Android search terms, Play store listing experiments for conversion testing, and App Store Connect for impressions and conversion by source. If any of those four is not yet part of your weekly routine, a paid subscription will not fix what is missing.
Short version of each, since the free-tools guide linked above goes deep on the mechanics:
- Apple Ads keyword tooling. Opening an Apple Ads account costs nothing, and the keyword suggestion tool shows a popularity indicator drawn from real App Store searches. You can read it without ever launching a campaign. Note carefully what it is: Apple's own glossary calls it "a relative indicator", not a volume.
- Play Console acquisition reporting. Free with your developer account, and it breaks store listing visitors and installers down by search term. This is first-party Android keyword attribution that no paid tool can reproduce, because it is your data and Google is the only one holding it.
- Play store listing experiments. Google's built-in A/B testing runs on live Play Store traffic. You can test icon, feature graphic and screenshots in a default graphics experiment, or add descriptions across up to five languages in a localised experiment, with up to two variants per test.
- App Store Connect analytics. Impressions, product page views, conversion rate and download counts, split by acquisition source, with Apple defining an impression as your app being viewed on the Today, Games, Apps or Search tabs for more than one second, and conversion rate as downloads and pre-orders divided by unique device impressions.
Two details from Google's own store listing experiments documentation matter more than most vendor comparisons ever will. First, the target metrics all measure store-listing outcomes rather than user quality. Despite the "clicks" label, Google defines unique user install clicks as the number of users who installed your app and did not already have it on another device, alongside open clicks and pre-registration clicks. So an experiment can tell you which variant wins at the listing, and nothing at all about retention, revenue or lifetime value downstream of that install. Second, experiments stop automatically after six months and a low-traffic listing will simply return "More data needed" rather than a winner. Google reports the result against a confidence interval and a minimum detectable effect, which is the honest way to do it, and it also means a small app cannot always get a verdict.
Add store autocomplete on both platforms and you have keyword discovery, demand direction, attribution on Android, and conversion testing — for nothing. In the accounts we have worked on, the teams running this loop weekly tend to get further than teams paying for suites they open once a quarter. That is a qualitative observation from client work rather than a measured result — we have not run the numbers on it — but it is why we now open an ASO engagement with "show me your last four weeks of store data" rather than "which tool do you use". The full methodology sits in our app store optimisation guide.
The honest verdict for this stage: if you run one app in one or two markets and you are not yet spending meaningfully on user acquisition, buy nothing. There is no paid feature that will change a decision you are about to make.
When does a paid ASO tool start paying for itself?
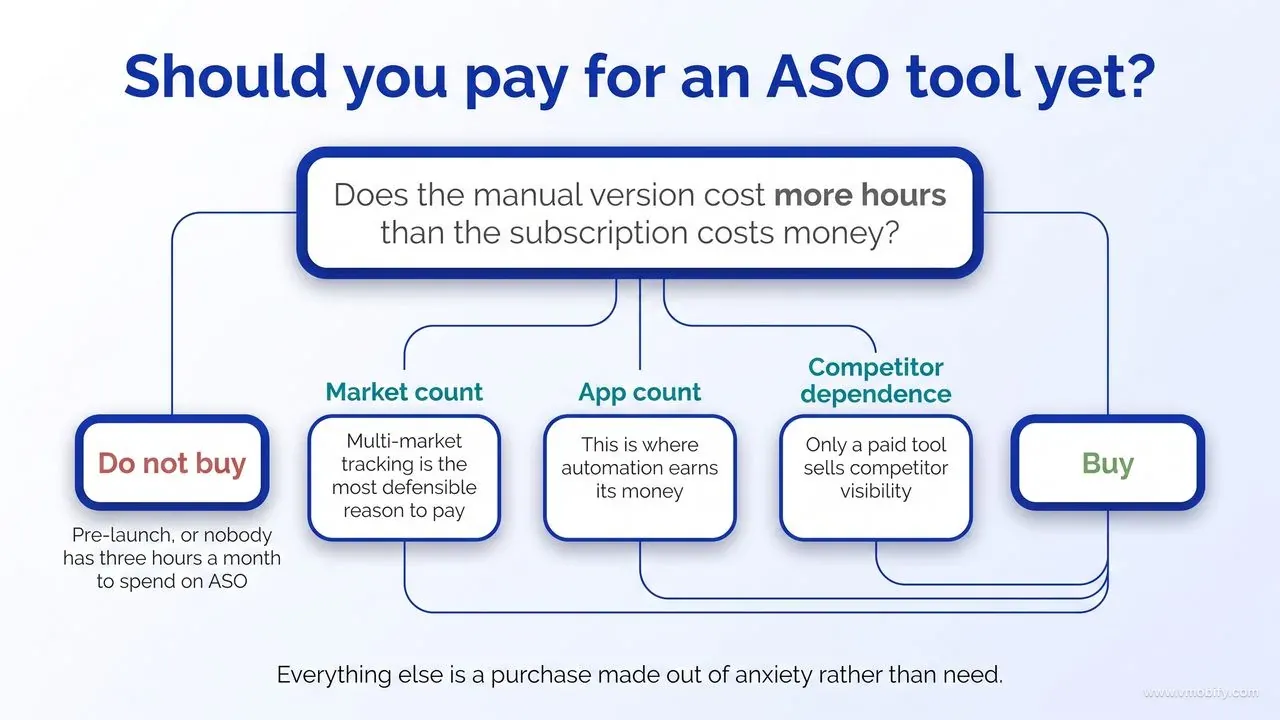
A paid ASO tool starts paying for itself at the point where doing the same work by hand costs more hours than the subscription costs money — which in practice means several markets, several apps, or a competitor set that genuinely drives your roadmap. Everything else is a purchase made out of anxiety rather than need.
There are three trigger conditions worth buying against, and they are all about volume of work rather than quality of insight:
- Market count. Tracking twenty keywords in one storefront is a spreadsheet. Tracking two hundred keywords across eight storefronts and four languages is not, and no amount of discipline makes it one. Multi-market tracking is the most defensible reason to pay.
- App count. The moment you manage a portfolio rather than a product, the per-app manual routine multiplies while your team does not. This is where automation earns its money.
- Competitor dependence. If a rival's keyword set, creative changes or rank movements actually change what you ship next quarter, you need competitor visibility and only a paid tool sells it. If the answer is "we would find it interesting", that is not a business case.
Note what is missing from that list: better keyword ideas. Teams routinely buy a platform hoping it will surface a term they had not thought of, and it usually will — but the marginal value of the twenty-first keyword idea is small compared with the value of testing your screenshots properly. Priority order matters more than tool quality here.
The arithmetic is straightforward once you frame it as labour rather than insight. AppTweak's entry plan is $99 a month as of August 2026, or $79 a month if you commit to a year ($949 up front). If a paid platform saves your ASO owner even a few hours a month of manual rank checking and competitor screenshotting, it has already covered itself on almost any realistic hourly cost. Conversely, if nobody on the team has three hours a month to spend on ASO at all, buying a tool does not create that capacity — it just adds a recurring line item and a login nobody uses.
The counter-trigger is worth stating just as plainly. Do not buy while you are pre-launch, because you have no ranks to track and no conversion data to compare against, and the competitor data you gather in month one will be stale by the time you actually ship. Do not buy in order to produce a report for someone who is not going to act on it. And do not buy because your last agency had one. Across the accounts we have worked on, the thing that shows up alongside ranking movement is testing cadence, not tool spend — an observation from client work rather than a computed correlation, and we would rather label it honestly than dress it up as a statistic. If you would rather hand the whole loop to a team that already owns the licences, that is what our ASO service exists to do.
How do the major paid platforms differ in practice?
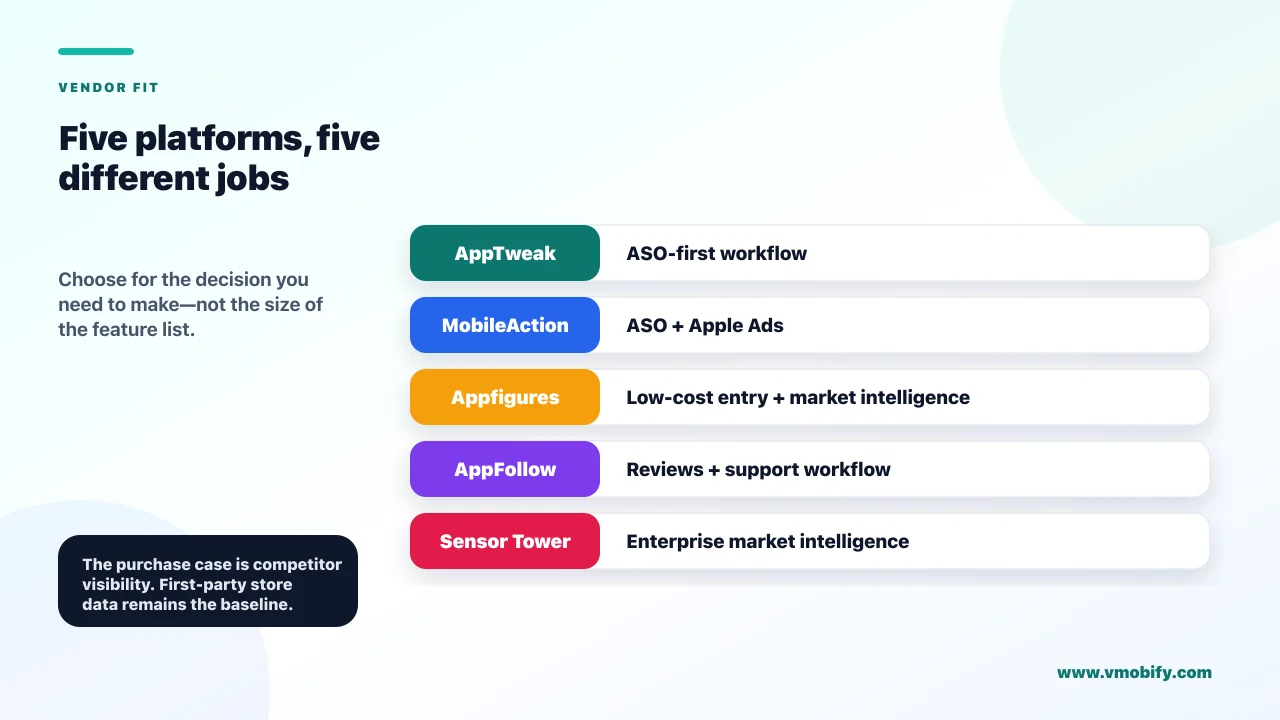
The clearest practical difference between the major paid platforms is not feature depth — it is whether the vendor will tell you the price without a sales call. That split maps almost exactly onto who each product is built for, and it is the most useful sorting rule available to a buyer. It also runs the other way from how most comparison tables draw it: four of the five publish figures, and only one does not.
One reading instruction before the numbers, because it is where roundups go wrong most often. Nearly every pricing page in this category defaults its toggle to the annual rate while the plan card still says "/mo", so the headline figure you see is the discounted annual-billing rate, not what you pay month to month. Both are given below, checked against each vendor's own page in August 2026.
The transparent group looks like this:
- AppTweak publishes plans openly, and its page is the clearest example of the toggle trap above. As of August 2026 its pricing page lists Essential at $99 a month, or $79 a month billed annually ($949 a year), with 500 tracked keywords, one seat and six months of history; Grow at $299 a month, or $249 a month billed annually ($2,990), with 1,500 keywords, one seat and twelve months of history; and Grow Plus at $599 a month, or $499 a month billed annually ($5,990), with 3,000 keywords and twenty-four months. The Enterprise tier is quote-based. The page offers a seven-day free trial and says you can cancel at any time; it does not say a card is unnecessary to start one, so assume you will need to enter payment details.
- MobileAction publishes self-serve ASO Intelligence tiers and puts monthly and annual behind a toggle like the others, so check which one is selected before you read a figure. As of August 2026: Lite at $15 a month, or $12.50 a month billed yearly, with 100 keywords, five apps and three months of history; Basic at $69 a month, or $59 billed yearly, with 500 keywords and six months of history; and Pro at $239 a month, or $199 billed yearly, with 1,500 keywords, three seats and twelve months of history. An Enterprise tier is on request. Its Apple Ads campaign management product carries a $0 tier for accounts up to $10,000 of monthly ad spend, which is a genuinely notable offer if Apple Ads is a real channel for you. Its Ad Intelligence, Search Ads Intelligence and API products are all quote-based.
- Appfigures publishes the widest ladder, and it is the only one of the five whose plan cards show the monthly rate by default. As of August 2026 its Analytics and ASO plans run from Connect at $9.99 a month with 25 tracked keywords, through Monitor at $44.99 with 100 keywords, Optimize at $149.99 with 500, Boost at $599.99 with 1,000, up to Amplify at $1,399.99 with 2,500 keywords; annual billing discounts each tier, though not by a uniform percentage — Connect drops to $7.99 a month, and the higher tiers fall by their own amounts rather than a flat 20%, so read the annual figure off the page for the specific tier you want rather than calculating it. Its market intelligence product, Explorer, is a separate and much larger purchase: Scout at $599.99 a month, Pathfinder at $1,249.99 and Scale at $2,499.99, with a quote-based Explore tier above them. Note that $599.99 appears in both product lines and means different things — the Boost analytics plan and the entry Explorer plan — which is exactly the kind of collision that produces wrong comparison tables.
- AppFollow belongs in this group too, despite being routinely described as quote-only in other roundups. Its plan cards are drawn by script, so a page source view or a simple crawler sees an empty pricing page, which is the likeliest reason that misconception keeps circulating. Rendered in a browser, its pricing page is a full self-serve matrix with monthly and yearly toggles and a currency selector. As of August 2026 it lists a Free plan at $0 covering two apps, 1,000 keywords and up to five team members; Essential at $179 a month, or $129 a month billed annually, with five apps and 365 days of history; Team at $599 a month, or $425 a month billed annually, with fifteen apps and full history; and an Enterprise tier shown as a custom price. The page notes that plan prices apply to new users only and exclude VAT, and the FAQ describes a ten-day trial that needs no card.
Which leaves a quote-only group of exactly one. Sensor Tower has no pricing page at all. Its old /pricing URL now redirects to a demo request form, which states that the company customises pricing plans for each customer and asks you to get in touch. We will not estimate what it costs, because any number we gave you would be invented. Ask directly, and ask early, because a quote-based platform will usually land well above every self-serve tier listed above.
One consolidation to be aware of: data.ai is no longer a separate purchase decision. Sensor Tower acquired it — the company formerly known as App Annie — in March 2024, and its datasets now sit inside the Sensor Tower platform. Any comparison table still listing data.ai as an independent competitor has not been updated in over two years, which is a reasonable proxy for how much else on that page you should trust.
Translated into use cases rather than rankings: AppTweak and MobileAction are ASO-first platforms aimed at practitioners doing keyword and metadata work; Appfigures has the cheapest paid on-ramp at $9.99 a month, though free tiers are common across the category rather than a differentiator — Appfigures itself has a Starter plan at $0, AppFollow publishes a Free plan, and MobileAction's campaign management product sits at $0 up to a spend ceiling, all with very different scopes; AppFollow is priced and built around review management and support workflow rather than keyword work; Sensor Tower is a market intelligence purchase — the kind of thing a strategy or corporate development team signs, not the tool you buy to fix a title. Choosing between the four self-serve platforms is a genuine decision. Reaching for Sensor Tower to answer "which keywords should my subtitle target" is buying a very expensive answer to a cheap question.
How accurate is ASO keyword volume data, really?
Every keyword search volume number you have ever seen in an ASO tool is a modelled estimate, because neither Apple nor Google publishes search volume for their stores. This is the single most misunderstood fact in the category, and it changes how you should use every number on the screen.
Start with what Apple actually publishes, because it is narrower than the industry pretends. Apple Ads exposes a popularity signal for keywords, and Apple's own glossary defines it as "a relative indicator of an Apple Ads keyword's popularity" and states in the same entry that it "is displayed as numbers from 1 to 5, with 5 being the most popular". Five ordinal steps is the whole of the disclosure. That is a rank-ordering device with a very coarse resolution: two keywords both scored 4 may differ in real search demand by an order of magnitude, and Apple gives you nothing to separate them. It is not a number of searches, and Apple never claims it is.
The same glossary quietly confirms that Apple holds the underlying data and chooses not to release it. Impression share is defined as the number of times your ad was shown for a search term "out of the total number of searches on that search term" — Apple knows the denominator exactly, and reports only the ratio, capped so that anything above 90% is displayed as a band rather than a figure. Google publishes no equivalent index at all. Play Console will tell you the search terms that drove visits to your listing, and that is where its disclosure stops.
So where do tool volumes come from? Vendors build them from some combination of panel data, SDK telemetry, observed ranking behaviour, ad auction signals, autocomplete ordering and extrapolation from the small amount of ground truth the platforms do release. These are real methods, applied by competent data teams, and the outputs are genuinely useful as a relative ordering. They are not measurements. Two tools showing different volumes for the same term are not one right and one wrong — they are two different models, and neither has access to the truth.
Three practical rules follow, and we apply all three as standard:
- Treat volume as ordinal, never cardinal. "This term is roughly ten times more searched than that one" is a defensible reading. "This term gets 4,300 searches a month" is not, no matter how precisely the tool prints it.
- Never put a modelled volume into a forecast. The moment a keyword volume becomes an install projection in a board deck, an estimate has been laundered into a commitment. If you need install numbers, model them from your own conversion data, not from a vendor's inference.
- Validate against first-party signal. On Android, check the tool's view against the search terms Play Console already attributes to your listing. On iOS, sanity-check against Apple's popularity indicator. Where the model and the first-party signal disagree, the first-party signal wins.
None of this makes the tools worthless — it makes them instruments with a stated tolerance, which is how every serious analyst uses them anyway. What it does rule out is the way these numbers are usually sold, and the way they are usually repeated in pitch decks. Apple's own guidance on App Store search describes ranking as a blend of text relevance across title, subtitle, keywords and category, plus user behaviour such as downloads, ratings and reviews. That is a system you influence through relevance and conversion, not one you reverse-engineer with a volume column.
Which tool features are worth paying for and which are decoration?
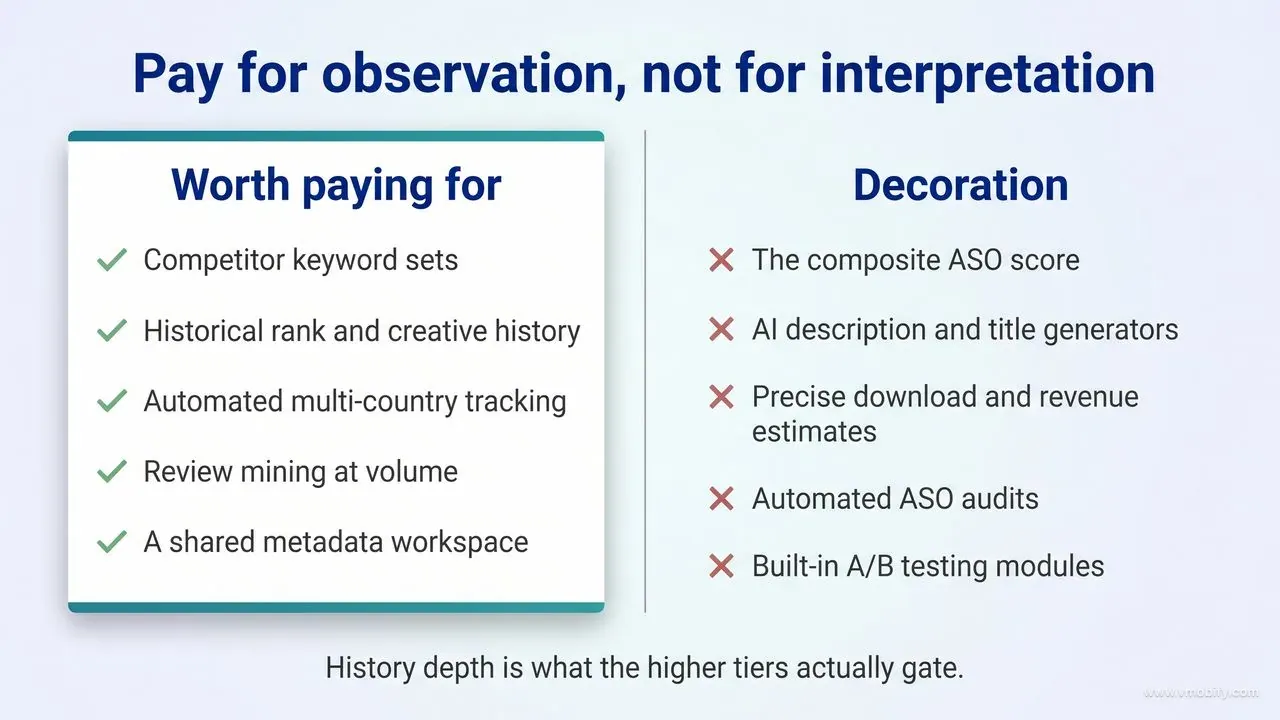
Pay for competitor keyword extraction, auditable historical data and multi-market automation. Do not pay for composite ASO scores, AI metadata writers, or download estimates printed to three significant figures. The distinction is simple: pay for observation, not for interpretation.
Features that reliably earn their place
- Competitor keyword sets. The one thing the stores genuinely will not give you. Knowing which terms a rival ranks for, and where they moved, is the core of the purchase.
- Historical rank and creative history. Dated records of when a competitor changed an icon, a screenshot set or a title, matched against their rank movement. This is the material for real analysis, and it cannot be reconstructed after the fact — which is why history depth is what the higher tiers actually gate.
- Automated multi-country tracking. The manual version does not scale past a couple of storefronts, and this is where a subscription most obviously replaces labour.
- Review mining at volume. Reading a thousand reviews to extract the phrases users actually type is genuinely useful work that software does faster than a person.
- A shared metadata workspace. Unglamorous, but keeping the keyword-to-field mapping, the version history and the localisation queue in one place prevents the most common ASO failure we see: nobody knowing why the current title says what it says.
Features that are decoration, in roughly descending order of how confidently they are sold
- The composite "ASO score". A number out of 100 invented by the vendor, validated against nothing external. It moves when you follow the vendor's checklist, which is not the same as moving when your ranks improve. We have yet to see a score change in a client account that turned out to predict a rank change, which is why we stopped putting it in reports.
- AI description and title generators. They produce plausible metadata that reads like everyone else's metadata. Store ranking rewards relevance and conversion, and generated copy tends to optimise for neither.
- Precise download and revenue estimates. Useful as an order of magnitude. Actively misleading when quoted to the unit, for exactly the reasons in the previous section.
- Automated "ASO audits". Most restate the store's own published guidelines back to you with a red or green tick. Apple and Google publish that guidance for free.
- Built-in A/B testing modules. Both stores run experiments on their own live traffic, which is the only place a listing test is genuinely valid. A third-party simulation of store traffic answers a different question. If you want the full comparison of that decision, we covered it in our guide to A/B testing tools for apps.
One nuance on that last point, because it is where reasonable people disagree. Third-party creative testing is defensible for pre-launch work, when you have no store traffic to test against and need directional signal on concepts. It is not a substitute for a live store experiment once you have traffic, and it should never be described as one. That is the line we hold with clients, and it occasionally costs us a tidier-looking test plan.
What does an ASO tool stack look like at each stage?
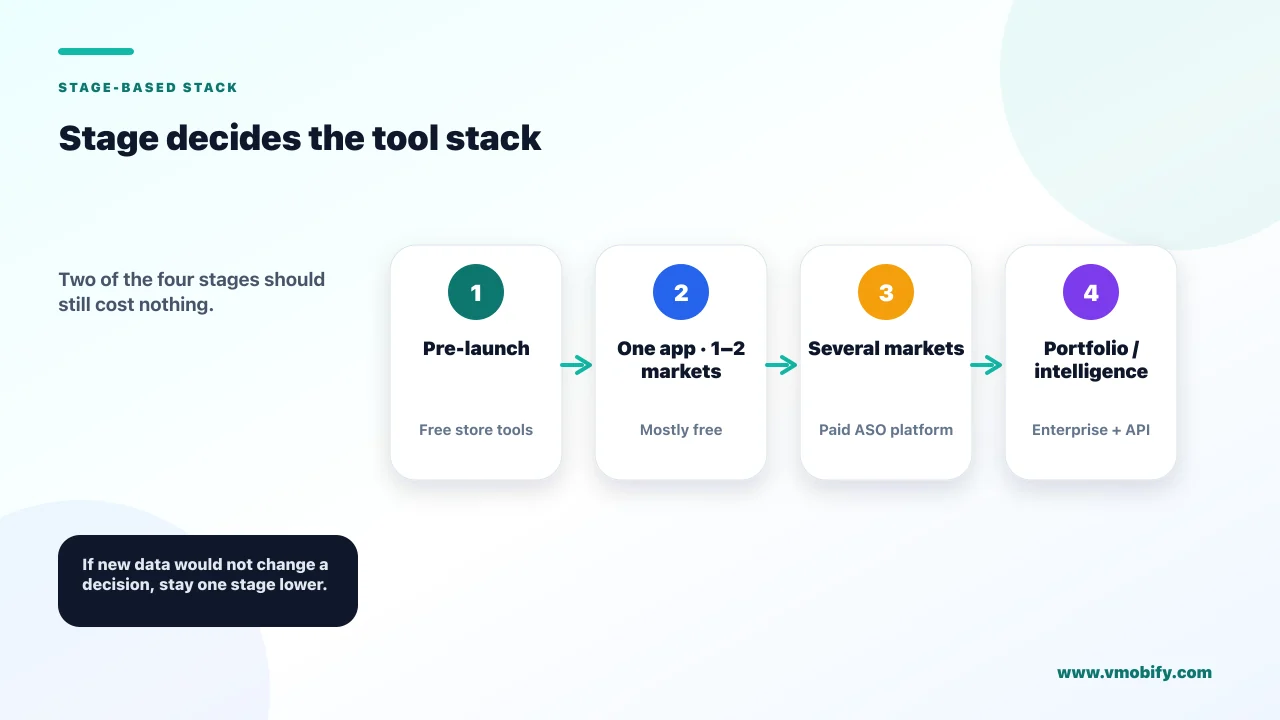
Stage decides the stack, not budget and not ambition — and at two of the four stages below the correct stack costs nothing. Recommending by stage rather than by score is the only honest way to answer "which tool is best", because the answer genuinely inverts as an app grows.
- Stage one — pre-launch or first listing. Free only. An Apple Ads account for the popularity indicator, Play Console for everything Android, store autocomplete on both platforms for discovery, and a spreadsheet mapping researched terms to the fields that will carry them. You have no rank history to track and no conversion data to compare, so a paid subscription would be buying access to competitor data you cannot yet act on. Spend the money on screenshot design instead — it will move conversion further than any dashboard.
- Stage two — live, one app, one or two markets. Still mostly free, with one optional addition: an entry-level rank tracker so you have a continuous record rather than manual spot checks. As of August 2026 the cheapest credible options are Appfigures Connect at $9.99 a month with 25 tracked keywords, or MobileAction's Lite tier at $15 a month with 100 keywords — $7.99 and $12.50 a month respectively if you pay for a year up front. Twenty-five keywords sounds small and is usually enough at this stage, because you should be defending a focused term set rather than monitoring a long tail you cannot influence. Everything else — search terms, conversion, experiments — still comes from the stores.
- Stage three — scaling, several markets, real paid acquisition. This is where a proper ASO platform earns its keep. A mid-tier plan — AppTweak Essential at $99 a month ($79 a month on annual billing), MobileAction Basic at $69 a month ($59 annually), or Appfigures Monitor at $44.99 a month ($35.99 annually), all as of August 2026 — buys competitor keyword sets, multi-country automation and the history depth that makes analysis possible. Pair it with attribution and product analytics, because at this stage the ASO question stops being "do we rank" and becomes "which terms bring users who stay". Our app growth stack guide covers how the pieces fit together.
- Stage four — portfolio, multiple apps, or market intelligence as a business input. Quote-based products enter the picture here — Sensor Tower, the enterprise tiers of the self-serve platforms, and MobileAction's Ad Intelligence line — along with API access so tool data can be joined to your own warehouse. This is also the stage where paying for two overlapping platforms can be rational — one for ASO execution, one for market and competitive intelligence — because the questions genuinely differ.
The part most roundups will not say: most teams never reach stage four, and a large number never need to leave stage two. The tool spend in the accounts that do well is modest and remarkably stable across stages, while the effort spent on testing listings and reading first-party data varies enormously between teams — and in our experience it is that second variable that shows up alongside ranking movement. That is a pattern we observe in client work, not a coefficient we have calculated, and we would rather say so. If you are unsure which stage you are actually at, the test is whether you can name a decision you would make differently with a paid tool's data in front of you. If you cannot, you are one stage lower than you think.
Which tools should you not buy, and when?
Do not buy any ASO tool until you have read your own store data every week for a full quarter — and even then, do not buy the enterprise tier to answer a question the $15 tier (as of August 2026) answers. As an agency we would rather tell a client to spend nothing than watch a subscription become the proof that ASO is "being handled".
The specific cases where the answer is no:
- Pre-launch, any tool. No ranks, no conversion data, no experiments to run. The competitor snapshot you take now will be out of date by the time you ship. Wait.
- An annual contract you cannot exit. Annual billing is genuinely cheaper, and worth quantifying rather than asserting: AppTweak's Essential plan is $949 for a year against $1,188 for twelve monthly payments at $99, a saving of $239, and Appfigures advertises a flat 20% off for annual. But it is a year of commitment to a category where your needs may change in one quarter. Take the monthly price for the first three months and convert once you know you will use it.
- A quote-based platform for a metadata question. If the question is which terms belong in your title and subtitle, a self-serve tier answers it. Enterprise market intelligence is a different product for a different buyer.
- A second tool bought because the first disagreed. Two models disagreeing about a modelled volume is expected behaviour, not a defect. Buying a tiebreaker just adds a third estimate.
- Anything sold primarily on an AI metadata generator. Generated titles and descriptions converge on the category average, and the category average is precisely what you are trying to beat.
- A bundled data-plus-managed-service deal from a single vendor. Separate the two purchases. A vendor grading its own service using its own scoring model has no incentive to tell you the service is underperforming.
There is also a timing trap worth naming. Teams often buy a platform in the same week they decide to "take ASO seriously", which means the subscription starts before anyone has agreed who owns the work, what cadence they will run, or what they will test first. Six weeks later the login is unused and the tool takes the blame. Decide the cadence first, run it manually for a month, and buy the tool when the manual version becomes annoying. Annoyance is a much better purchase signal than enthusiasm.
The same logic applies to seat counts and add-on modules. Entry tiers on most of these platforms include a single seat, and the upgrade that buys you a second seat is often priced as if it also buys you a different product. Before you pay for it, check whether the person who needs access needs the whole platform or simply a weekly export from the person who already has it. A good number of the seat expansions we have been asked to approve in client accounts turned out to be solving a reporting problem rather than an analysis one, and a shared document solved it for nothing.
Finally, the disclosure this post owes you. We pay for ASO tooling and we recommend it to clients when the trigger conditions in this post are met — but the honest agency position is that tools are the smallest lever in ASO. Relevance, conversion testing and localisation move rankings. Dashboards report on them. Every price here was checked against the vendor's own pricing page in August 2026, with monthly and annual-billed rates given separately because most of those pages default to showing the cheaper annual figure and it is an easy number to misread. Every one of them will change, so treat these as a snapshot rather than a quote. If you want a straight answer about whether your app is at the stage where paying makes sense, tell us what you are running and we will say so plainly, including when the answer is that you should not spend anything at all.
Frequently Asked Questions
What is the best ASO tool in 2026?+
There is no single best tool — the right answer changes by stage. For a first app in one or two markets, the free first-party tools from Apple and Google are genuinely sufficient. For a scaling app across several markets, a mid-tier plan from AppTweak, MobileAction or Appfigures covers competitor keywords and multi-country tracking. For portfolio-level market intelligence, the enterprise tiers and Sensor Tower — the one platform of the five that publishes no prices at all — enter the picture.
Is ASO keyword volume data accurate?+
It is a modelled estimate, not a measurement. Neither Apple nor Google publishes search volume for their stores. Apple exposes only a relative popularity indicator inside Apple Ads, and Google publishes nothing comparable. Use tool volumes to rank terms against each other, never as a forecast of installs.
How much does AppTweak cost?+
AppTweak publishes its pricing openly, but its page defaults to the annual rate, so the headline figure is not the monthly price. As of August 2026 Essential is $99 a month, or $79 a month if billed annually ($949 for the year), with 500 tracked keywords, one seat and six months of history. Grow is $299 a month, or $249 a month billed annually ($2,990), with 1,500 keywords. Grow Plus is $599 a month, or $499 a month billed annually ($5,990), with 3,000 keywords. Enterprise is quote-based, and there is a seven-day free trial. Confirm current pricing before buying.
How much do Sensor Tower and AppFollow cost?+
They sit on opposite sides of this question, which is worth correcting because the pair are often lumped together. AppFollow does publish prices: as of August 2026 its page lists a Free plan at $0 for two apps and 1,000 keywords, Essential at $179 a month or $129 a month billed annually, Team at $599 a month or $425 a month billed annually, and a custom-priced Enterprise tier, all excluding VAT. The cards are rendered by script, which is why crawlers and page-source checks report the page as empty. Sensor Tower publishes nothing at all — its old pricing URL now redirects to a demo request form saying pricing is customised per customer. We will not estimate a Sensor Tower figure, because any number we gave would be invented.
Does App Store Connect show which keywords people searched?+
No. App Store Connect reports App Store search as an acquisition source alongside App Store browse, app referrers, web referrers and App Clips, with impressions and conversion rate attached — but it does not break performance down by the individual term a user typed. Google Play Console does offer a search-term breakdown in its acquisition report, which is the reverse of what most people assume.
Is data.ai still a separate ASO tool?+
No. Sensor Tower acquired data.ai, formerly App Annie, in March 2024, and its datasets have been folded into the Sensor Tower platform. Any tool comparison still listing data.ai as an independent competitor has not been updated in over two years.
Can I do ASO properly without paying for any tool?+
Yes, for a single app in one or two markets. Apple Ads keyword tooling, Play Console acquisition reporting with its search-term breakdown, Play store listing experiments and App Store Connect analytics cover discovery, attribution, conversion testing and measurement at zero cost. Paid tools become necessary when you add markets, add apps, or need visibility into competitors.
Sources
- Apple — App Store Connect Analytics: acquisition — Confirms App Store search is reported as an aggregate source with no per-search-term breakdown
- Apple — App Store Connect Analytics: metrics definitions — Definitions of impressions, product page views and conversion rate used in the free App Analytics baseline
- Apple Ads — Help glossary — Defines search popularity as a relative indicator, and impression share as a share of total searches on a term
- Google Play Console Help — Run A/B tests on your store listing — Free store listing experiments: variants, click-based target metrics, six-month auto-stop and confidence reporting
- Google Play Console — Acquisition reporting — Free breakdown of store listing performance by country, language, install state, UTM campaign and search terms
- AppTweak — Pricing — Monthly and annual-billed plan prices, keyword limits and history depth: Essential $99/mo or $79/mo annually ($949), checked August 2026
- AppFollow — Pricing — Self-serve plan matrix: Free $0, Essential $179/mo or $129/mo annually, Team $599/mo or $425/mo annually, custom Enterprise, excluding VAT, checked August 2026
- Sensor Tower — Demo request (no published pricing) — The /pricing URL redirects here; the page states pricing is customised per customer and publishes no figures, checked August 2026
About the author
Amol Pomane — Founder, Vmobify
Amol leads Vmobify, a mobile app growth agency that has driven 30M+ downloads and ranked 54K+ keywords across 300+ apps since 2013. He writes about ASO, paid user acquisition, retention, and the operational reality of scaling mobile apps in India and global markets.
Check your store metadata
Run your current App Store or Play metadata through the free checker.
Open free tool