App Store Optimisation Guide 2026: Rank Higher on iOS and Android
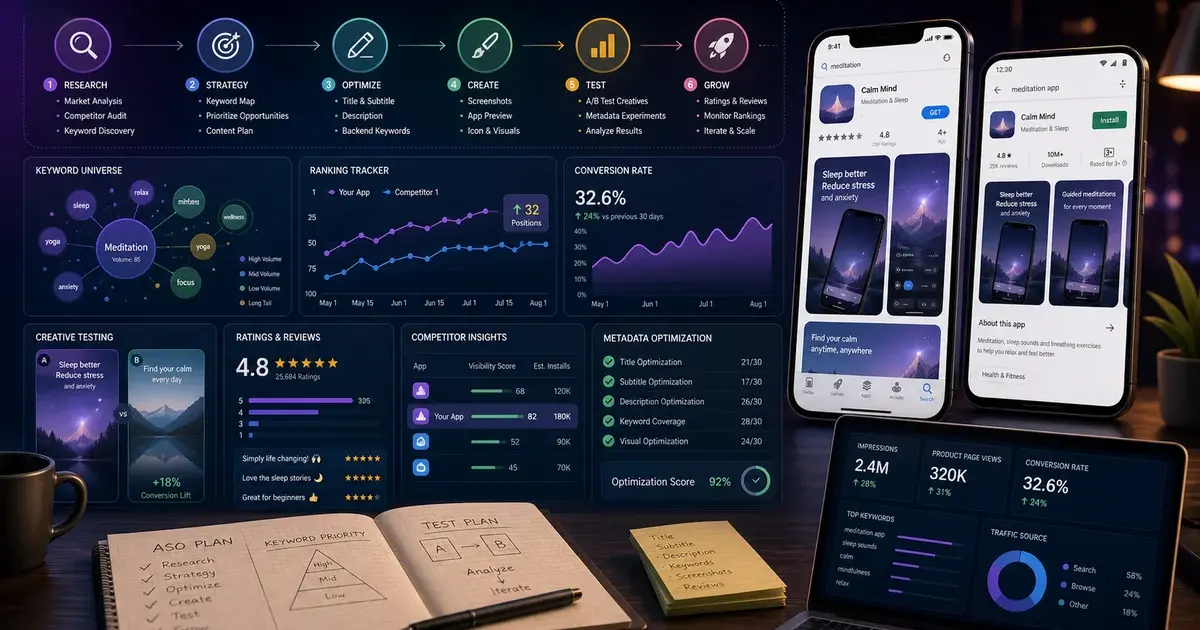
ASO in 2026 is not a checklist—it is an ongoing growth discipline spanning keyword research, creative testing, and platform-specific tools that Apple and Google keep shipping. This guide covers every lever, treated separately for iOS and Android, with conversion benchmarks drawn from our portfolio of 300+ apps.
On this page
- What has changed about ASO in 2026?
- How are iOS and Android ASO fundamentally different?
- How do you build a keyword research methodology that actually works?
- How do you optimise every iOS metadata field for maximum ranking weight?
- How do you write Google Play metadata that ranks and converts?
- Which creative elements move conversion the most—and in what order?
- How do Custom Product Pages on iOS unlock higher conversion and ranking?
- How do Store Listing Experiments on Android compound your organic installs?
- How do In-App Events function as an ASO discovery signal?
- How do you audit where you are currently losing installs?
- Frequently Asked Questions
What has changed about ASO in 2026?
App store optimisation in 2026 has shifted from a static keyword exercise to a continuous conversion discipline driven by AI-powered search, behavioural ranking signals, and platform-native tools that Apple and Google have been shipping quarterly since 2022. The fundamentals have not changed—your app needs to rank for relevant searches and convert the traffic that arrives—but the levers, the timelines, and the platform rules have all evolved materially.
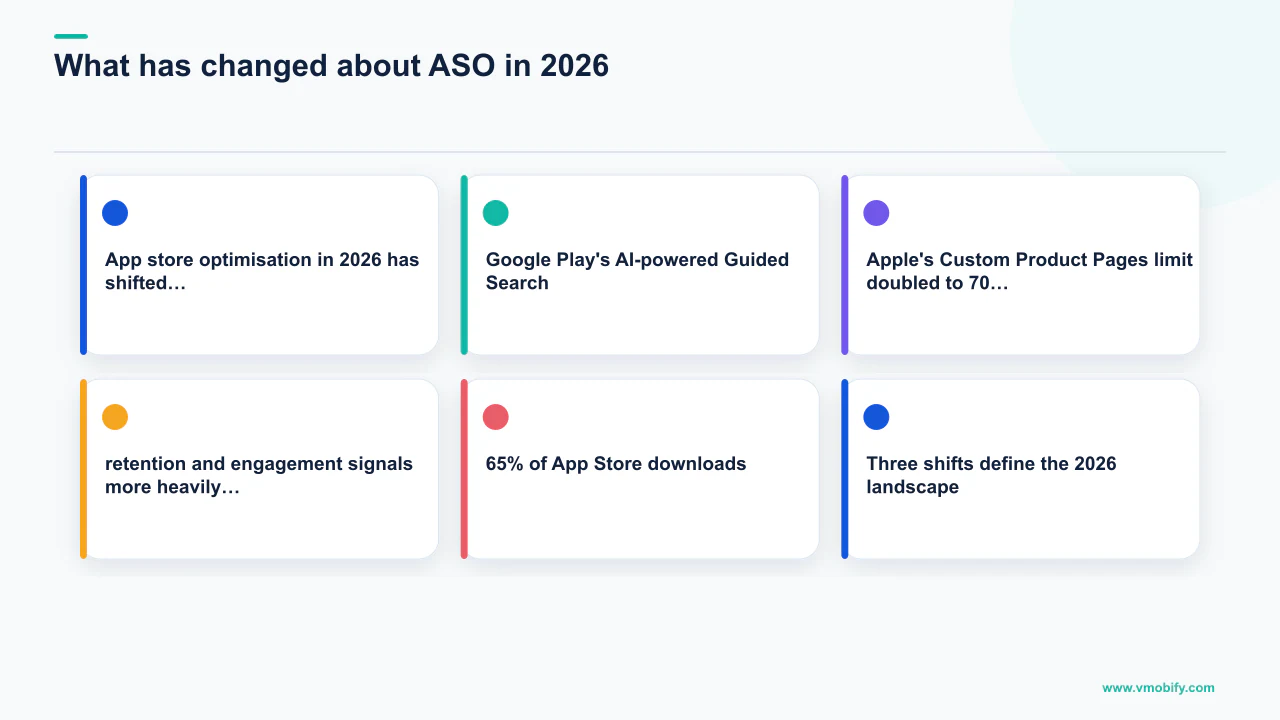
Three shifts define the 2026 landscape. First, Apple Intelligence is reshaping App Store search: Apple's on-device AI now interprets semantic intent behind queries, which means apps with natural-language metadata and rich structured signals (In-App Events, ratings, behavioural data) rank above apps with older keyword-stuffed copy. Second, Google Play's AI-powered Guided Search organises results by goal rather than by keyword—a user typing "I want to save money on groceries" gets an AI-curated list, not a raw keyword match. Third, Apple's Custom Product Pages limit doubled to 70 per app in early 2026, and CPPs now appear in organic search results for their assigned keywords—making them both a paid and an organic ranking tool simultaneously.
The metric that matters most is also changing. Both stores are weighting retention and engagement signals more heavily than raw install volume in their ranking algorithms. An app with strong Day 7 retention is increasingly ranked above a competitor with more total downloads but higher churn. This means ASO and product quality are now more tightly coupled than ever: a brilliant store listing that drives installs from users who churn quickly will eventually rank worse than a humbler listing that drives fewer but better-matched installs.
65% of App Store downloads follow a keyword search, per Apple Search Ads data. For non-gaming apps the share rises to 70%. This is the organic channel you are either winning or leaving on the table.
Across our portfolio of 300+ apps managed since 2013, we have tracked every major algorithm update on both stores. The apps that compound organic growth year over year are not the ones with the cleverest one-time metadata hack—they are the ones with a systematic, iterative ASO programme that tests, learns, and adapts to each platform's evolving signals. This guide covers every lever in that programme, treated separately for iOS and Android ASO, with specific benchmarks drawn from our portfolio and verified against platform documentation.
How are iOS and Android ASO fundamentally different?
iOS and Android use fundamentally different ranking architectures: iOS indexes three distinct metadata fields and weights keyword placement above behavioural signals, while Google Play indexes all visible copy and weights engagement and retention signals more heavily than precise keyword placement. Running the same ASO strategy on both stores is one of the most common and costly mistakes we see in our portfolio.
App Store (iOS)
- Indexed fields: App Title (30 chars), Subtitle (30 chars), Keyword Field (100 chars hidden), screenshot captions (OCR, since June 2025), developer name
- Description: NOT indexed for keyword ranking—write it for human conversion only
- Unique tools: Custom Product Pages (up to 70), Product Page Optimisation A/B testing, In-App Events, Promotional Text (170 chars, no re-review)
- Update velocity: 1–3 days per App Review cycle—each iteration is expensive, so be deliberate
- Algorithm weight: Keyword field placement has direct, measurable ranking impact; behavioural signals (install velocity, ratings, retention) amplify keyword rankings
- 2026 shift: Apple Intelligence semantic search rewards natural-language metadata over keyword-stuffed copy
Google Play (Android)
- Indexed fields: App Title (30 chars), Short Description (80 chars), Long Description (4,000 chars fully indexed), developer name—all visible copy
- Description: Fully indexed; target 2–3% keyword density across the long description for primary terms
- Unique tools: Store Listing Experiments (A/B test icon, screenshots, video, description), Custom Store Listings (per country), LiveOps events
- Update velocity: Hours—faster iteration cycles mean more experiments per quarter
- Algorithm weight: Retention, install velocity, ratings, and uninstall rate carry more ranking weight than on iOS
- 2026 shift: Guided Search and AI recommendations surface apps based on goal-matching, not just keyword presence
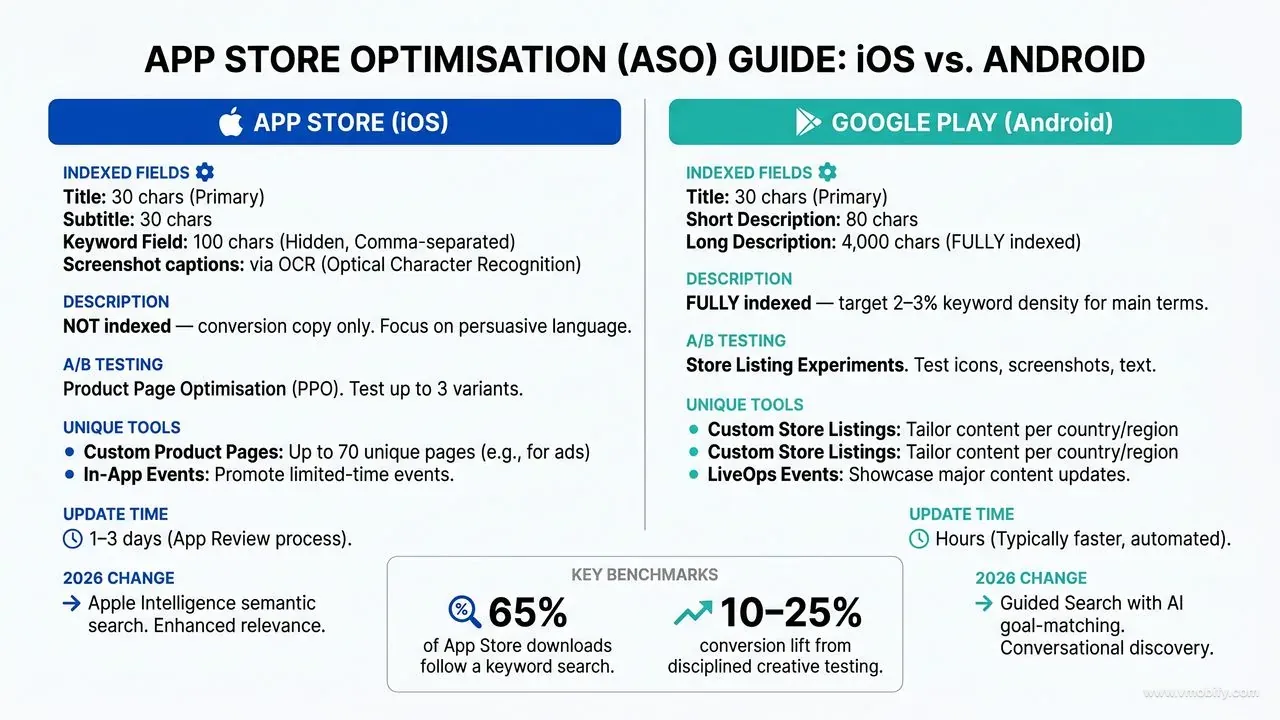
The practical implication: use Google Play's faster iteration cycle to validate keyword hypotheses, then apply the learnings to iOS where you have fewer optimisation cycles per quarter. A keyword that drives strong conversion on Android is almost always worth including in your iOS title or subtitle—the intent is the same, even if the implementation differs.
One more critical difference: the review response dynamic. Google Play shows your replies to reviews publicly and indexes that content. Apple does not index review replies, but responding promptly (within 24 hours) does influence your app's overall rating trajectory because satisfied users who received a response are significantly more likely to update a negative review. Both stores reward active rating management—but through different mechanisms. Our comprehensive ASO walkthrough covers the rating management workflow in detail.
How do you build a keyword research methodology that actually works?
Effective ASO keyword research starts with four sources—App Store autocomplete, competitor metadata analysis, Apple Search Ads suggested keywords, and user review mining—then filters the output through a Volume / Difficulty / Relevance matrix to produce a prioritised list that fits within your character budget. Skipping any one of these four sources leaves a predictable blind spot in your keyword universe.
- Seed keyword generation. List every way a user might describe your app's core use case in 3–5 words. A budget tracking app: "budget tracker", "expense manager", "spending tracker", "money manager", "bill tracker". Do not filter yet—capture everything.
- App Store autocomplete expansion. Type each seed keyword into the App Store search bar and record every autocomplete suggestion. These are real user queries with confirmed search volume. Each suggestion is a potential keyword to target or a signal about how users frame their need.
- Competitor metadata reverse-engineering. Use AppTweak or Sensor Tower to extract the titles, subtitles, and estimated keyword field contents of your top 5 competitors. Keywords they rank for that you do not are your fastest wins—the audience already exists, you just need to capture a share of it.
- Apple Search Ads keyword discovery. Run a broad-match ASA campaign across your seed keywords for two to four weeks. The impression and conversion data returned is the only source of real iOS search volume available. Keywords with high impressions and strong conversion rates are your highest-value organic targets.
- User review mining. Read your own reviews and competitor reviews. Users describe your app in natural language that frequently contains high-volume search terms you have not considered. The phrase a user uses to praise a feature is often exactly how they searched for it.
Once you have a list of 50–100 candidate keywords, score each on three dimensions: search volume (estimated from ASA or third-party tools), keyword difficulty (the average ratings and install velocity of top-ranking apps for that term), and relevance (how well the keyword matches your app's actual use case). Sort by a weighted composite score and select terms that fit your competitive position—a new app should target moderate-volume, lower-difficulty terms before competing for the highest-volume keywords that incumbents own.
On iOS, use singular forms in your keyword field—Apple indexes both singular and plural from one entry. "workout" covers "workouts" and saves you one character. On Google Play, include both forms in your description because Android does not apply the same inference.
Refresh your keyword strategy every 60–90 days. Keyword rankings decay when competitors update their metadata, when search behaviour shifts seasonally, or when Apple and Google change their ranking signals. The apps that maintain top-3 rankings year after year treat keyword research as an ongoing programme, not a one-time task. We run quarterly keyword audits across every app in our ASO management programme, tracking position movement and refreshing underperforming slots.
How do you optimise every iOS metadata field for maximum ranking weight?
iOS metadata optimisation is a constrained character-budget problem: you have 160 primary characters (30-char title + 30-char subtitle + 100-char keyword field) to fit your highest-value keywords, plus screenshot captions and developer name as secondary indexing surfaces—and every duplicated word is wasted budget. Treat it as a precision craft, not a fill-in-the-blanks exercise.
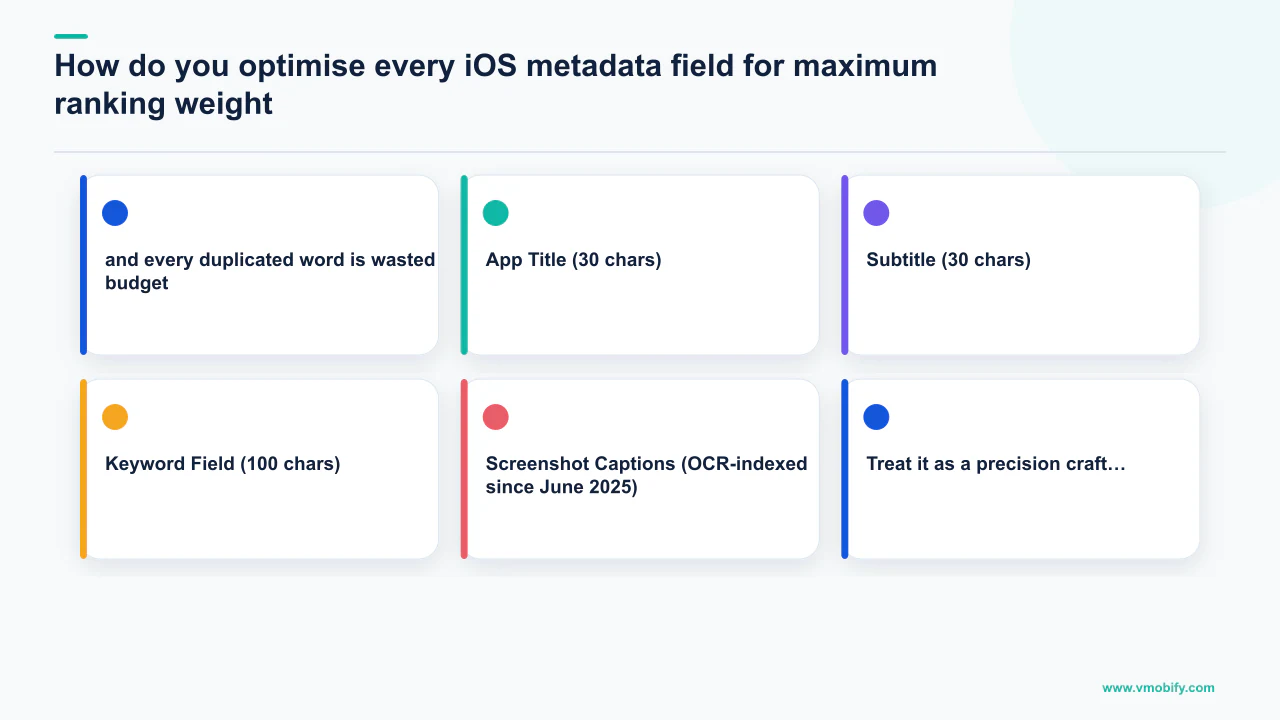
App Title (30 chars): Your brand name plus your single most important keyword phrase, separated by " – " or " | ". The title carries the highest indexing weight of any field. Lead with your brand name if it is recognisable in your category; lead with the keyword phrase if your brand is early-stage. A fintech app titled "ClearSpend – Budget Tracker" uses 28 of 30 characters and targets "budget tracker" with maximum weight. Never waste the title on a tagline with no keywords.
Subtitle (30 chars): This is your second-highest-weight indexing field and is visible to users in search results beneath the title. Treat it as a secondary headline that contains your next-priority keyword while communicating a clear benefit. "Track expenses, hit goals" is a subtitle that indexes "track expenses" and communicates outcome. Avoid subtitles that are pure marketing copy with no keyword value—it is one of the most underutilised fields in ASO.
Keyword Field (100 chars): Pack this with every additional high-value term that does not appear in the title or subtitle. Use commas with no spaces—"budget,expense,money,spend" uses four fewer characters than the spaced version and indexes identically. Use singular forms. Include synonyms, alternate spellings, and competitor-adjacent terms where relevant. Never repeat words from the title or subtitle—Apple gives no additional weight to repetition, and every repeated character is a wasted slot.
Screenshot Captions (OCR-indexed since June 2025): This is the newest and most underutilised iOS ranking surface. Since Apple began applying OCR to screenshot images, every word in your caption text is now indexable. Use 5–8 word captions that include your secondary keywords naturally. A fitness app screenshot showing a workout dashboard might caption it "Track your daily workouts and streaks"—the words "track", "workouts", and "daily" are now keyword signals, not just conversion copy.
Promotional Text (170 chars, no re-review required): This is the only iOS metadata field you can update without going through App Review. Use it for time-sensitive announcements—new feature launches, award wins, seasonal promotions. It does not affect keyword ranking but can lift conversion rate by 3–8% when it contains a relevant, timely hook. We update promotional text for every major product update across our portfolio apps.
Description (not indexed, conversion-only): Apple does not index the description for keyword ranking. Write it entirely for human persuasion. Pack the first 255 characters—the above-the-fold preview—with your sharpest value proposition and most compelling proof point, because most users never tap "More." Use bullet points, social proof (rating, user count, press mentions), and a clear call to action at the end.
A health and wellness app we manage moved from ranking #34 to #6 for its primary category keyword in nine weeks—purely from rewriting the title, subtitle, and keyword field to eliminate all repetitions and fill every character with non-overlapping terms. No paid spend, no creative changes. Metadata precision alone drove the jump.
How do you write Google Play metadata that ranks and converts?
Google Play metadata strategy is the inverse of iOS: because Android indexes all visible copy, your goal is to achieve 2–3% keyword density for your primary term across the long description while keeping the copy compelling enough to convert the human reader who is actually reading it. Keyword stuffing that crosses into spam territory triggers Play Store penalties; disciplined density in natural-sounding copy is the target.
App Title (30 chars): Same principle as iOS—brand name plus primary keyword. The title carries maximum weight on Play Store ranking and is the most-read element in search results. Use all 30 characters.
Short Description (80 chars): This appears below the title in search results and on the store listing page. It is indexed and has significant weight. Write it as a benefit-first sentence that contains your second-priority keyword. This is your 80-character ad copy—make it earn a tap.
Long Description (4,000 chars): This is where Android ASO diverges most sharply from iOS. Google indexes the full long description and rewards 2–3% keyword density for your primary term. Structure it with a strong opening paragraph (first 167 characters display as a preview), three to five benefit sections using bullet points, and a closing paragraph with a call to action. Include your primary keyword in the first paragraph, the middle, and near the end. Include secondary keywords and long-tail variants naturally throughout. According to Google Play's developer best practices, descriptions that are detailed, specific, and accurate outperform vague or keyword-stuffed copy both in ranking and in conversion.
Custom Store Listings (per country): Google Play allows fully localised store listings per country—unique title, short description, long description, screenshots, and video. This is one of the highest-ROI localisation moves available. A localised listing in Hindi or Brazilian Portuguese typically delivers 30–50% more installs in that market than an English-only listing, because both the ranking algorithm and the converting user respond to native-language copy. Our analytics team tracks localisation lift across markets for every portfolio app.
Google Play's algorithm also reads your replies to user reviews and indexes that text. Responding with natural-language sentences that mention your app's features (without forced keywords) contributes to your app's content footprint on the store. Ignoring reviews is a double loss: ranking signal and conversion signal both suffer.
One pattern that consistently outperforms in our portfolio: write the long description as a story of the user's problem and how your app solves it, rather than as a feature list. Feature lists convert poorly and tend toward keyword density that feels unnatural. A problem-solution narrative lands at 2–3% keyword density organically, reads well to the human visitor, and avoids the spam signals that a stuffed feature list triggers.
Which creative elements move conversion the most—and in what order?
Across the creative testing we have run in our portfolio, the impact hierarchy is consistent: icon changes deliver the largest single conversion lift, followed by screenshots 1 and 2, then the preview video, then feature graphic (Android only), then description copy. This sequence is not arbitrary—it mirrors the order in which a user processes your store listing during a 3–4 second scan in search results.
The practical implication is that testing out of sequence wastes your traffic. If you are running a preview video A/B test before you have found your highest-converting icon, you are optimising screenshot 3 while leaving a 20–30% icon improvement on the table. Work the sequence.
- Icon first. The icon is the only creative asset visible at every single touchpoint—search results, category browse, featured slots, home screen after install. A bold, recognisable icon that communicates your category at 16×16 pixels drives the largest individual conversion swing. Test at least two radically different treatments (not just colour variants) before locking your icon.
- Screenshots 1 and 2. On iPhone, the App Store shows the first three screenshots in search results before the user taps your listing. Most users make their tap decision from Screenshots 1 and 2. These must function as a standalone advertising unit. Show the outcome users achieve, not the features they use. Add a 5–8 word caption in high-contrast type. On Google Play, Screenshot 1 is shown full-width in many discovery surfaces—it is your single most-seen creative asset.
- Preview video / promo video. iOS preview videos auto-play muted in search results when a user pauses over your listing. Front-load your hook in the first 3 seconds. Design for muted playback with on-screen captions throughout. Keep it under 30 seconds. Test video versus no video before testing two video variants—not every category benefits from a video-first approach.
- Feature graphic (Android only). The feature graphic appears at the top of your Google Play listing when a video is not present. It is 1,024×500 pixels and often underutilised. Treat it as a billboard: one bold claim, your app's key visual, and your brand name.
- Description and short description. Conversion impact from copy changes is real but smaller than creative changes—typically 2–8% per iteration. Worth optimising once the bigger elements are locked, but do not start here.
Research published by SplitMetrics and StoreMaven consistently shows 10–25% conversion lifts from disciplined creative testing—which translates directly into free downloads from the traffic you are already generating. A 20% conversion lift on 10,000 monthly listing page views is 2,000 extra installs at zero additional acquisition cost.
A 4.5★ average rating converts 30–40% better than a 3.8★ rating for the same keyword and creative set, per benchmarks across our portfolio. Ratings are a creative conversion variable—not a separate topic.
How do Custom Product Pages on iOS unlock higher conversion and ranking?
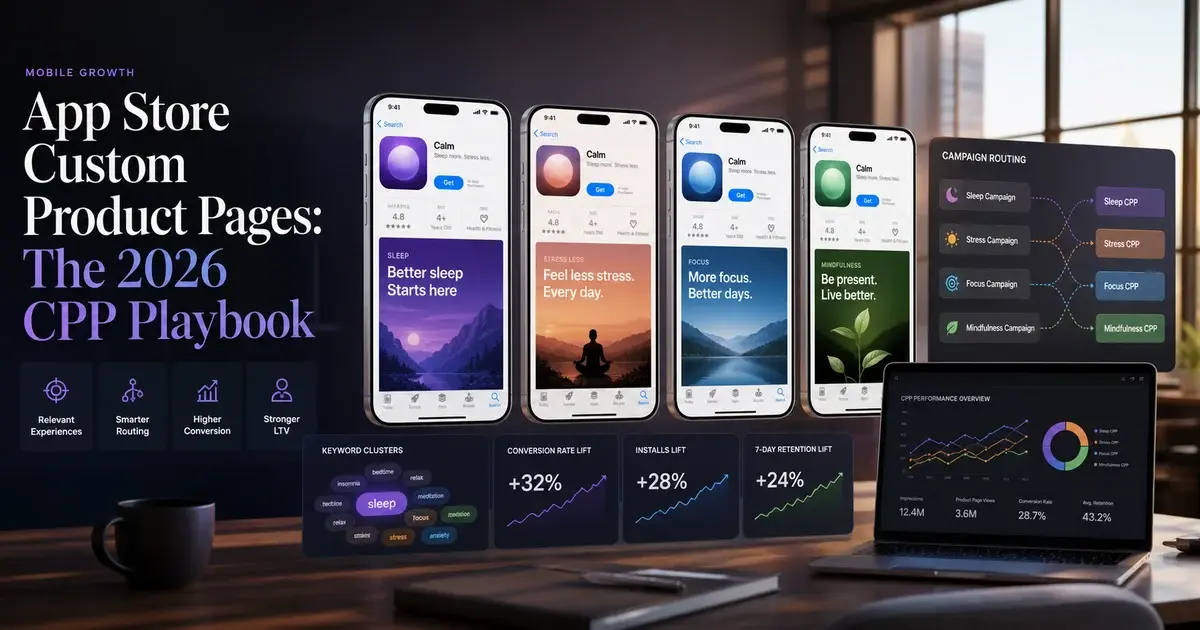
Custom Product Pages are the most powerful iOS ASO tool in 2026—Apple doubled the limit to 70 active pages per app in early 2026, and CPPs now appear in organic search results for their assigned keywords, making them both a paid efficiency tool and an organic ranking surface simultaneously. Fewer than 20% of apps have created even one custom page, which means this is still a significant competitive advantage for early movers.
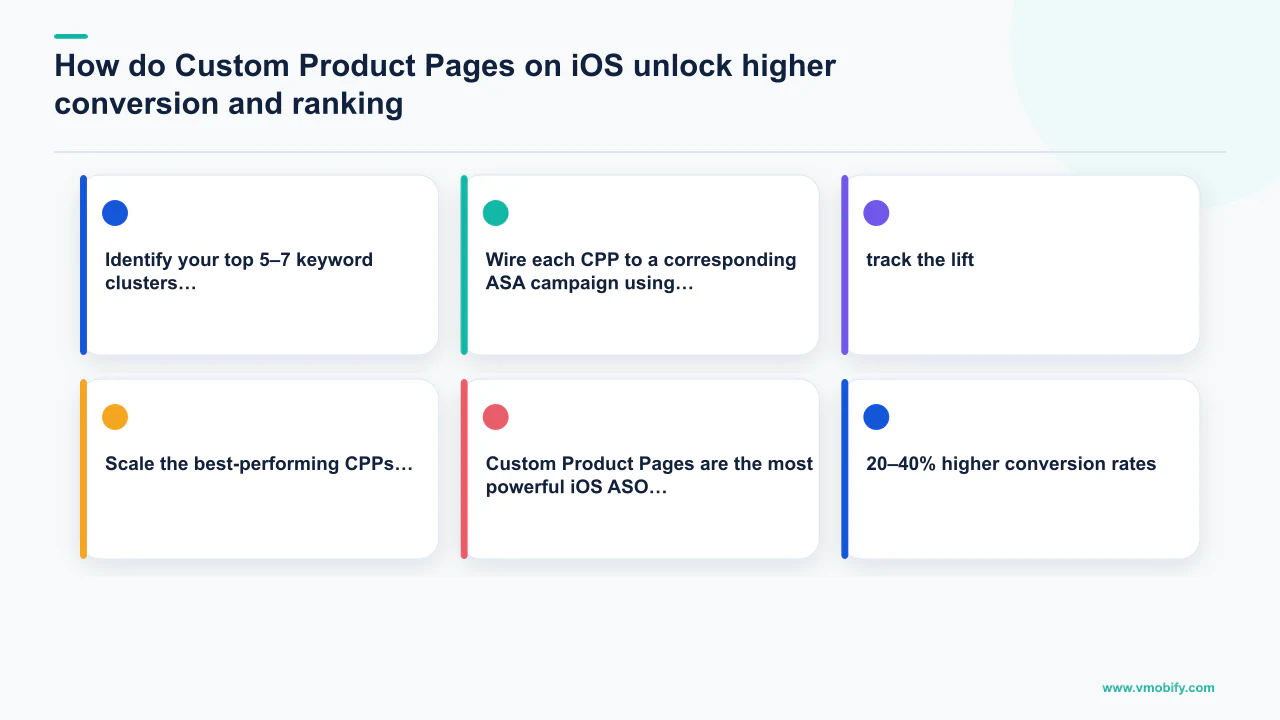
Each custom product page can have unique screenshots, a unique preview video, and unique promotional text—all targeting a specific audience segment or keyword cluster. A user who searched "budget tracking app" and lands on a custom page showing your budgeting features converts at dramatically higher rates than one landing on a generic listing showcasing all features equally. Across apps in our portfolio running CPP programmes, we consistently see 20–40% higher conversion rates on targeted custom pages versus the default listing.
The CPP × Apple Search Ads pairing is where the compounding effect lives. Run ASA campaigns pointing to custom pages tailored to the exact keyword cluster the campaign targets. A fitness app with three CPPs—one for "workout tracker", one for "calorie counter", one for "weight loss app"—runs three separate ASA campaigns, each pointing to its matched CPP. The keyword-to-creative alignment lifts quality scores, reduces cost-per-tap, and generates behavioural signals (users who searched that keyword, saw those screenshots, and installed) that reinforce organic ranking for the same keywords.
- Identify your top 5–7 keyword clusters from your keyword research. Each cluster should represent a distinct user intent or persona.
- Build a CPP for each cluster with screenshots and promotional text specifically addressing that intent. Do not reuse the same creative across pages—the point is intent alignment.
- Wire each CPP to a corresponding ASA campaign using exact-match keyword targeting. Set up conversion tracking per page so you can measure CPP conversion rate vs. the default page.
- Monitor organic impression share for each CPP's keyword cluster after launch. CPPs assigned to specific keywords now receive organic traffic for those terms—track the lift.
- Scale the best-performing CPPs. Once you have identified the two or three pages with the highest conversion rates, invest in higher-quality creative for those pages specifically.
For a deep dive on the full CPP strategy including creative brief templates and ASA campaign structure, see our dedicated guide at Custom Product Pages: The Complete iOS ASO Guide. Our ASO management service includes CPP setup and ongoing experiment management as part of every engagement.
A travel app we manage launched six Custom Product Pages targeting distinct trip-type keywords (family travel, solo adventure, budget travel, business travel, honeymoon, weekend breaks). Within 60 days, organic impressions for those six keyword clusters grew by an average of 34% with no change to base metadata. The CPPs were doing organic work. See our case studies for the full conversion data.
How do Store Listing Experiments on Android compound your organic installs?
Google Play's Store Listing Experiments are a free, natively integrated A/B testing tool that lets you test up to three variants of your icon, screenshots, feature graphic, video, short description, and long description against live organic and paid traffic—and a rigorous experiment programme is one of the fastest ways to compound your organic install rate without spending an additional rupee.
The discipline that separates high-performing ASO programmes from average ones is testing one element at a time and waiting for statistical significance before drawing conclusions. The temptation to test multiple elements simultaneously is strong, but it makes it impossible to attribute a result to a specific change. Our sequencing recommendation matches the impact hierarchy from the creative testing section:
- Icon: Test bold colour and composition variants. Icon changes on Android routinely swing conversion by 15–30% in either direction—the risk and reward are both highest here. Allocate 50% of traffic to each variant and run until Google Play signals statistical confidence (typically 7–21 days depending on volume).
- Screenshot 1 and 2: Test outcome-focused vs. feature-focused treatments. Test with device frame vs. without. Test portrait vs. landscape orientation for tablet listings. The first two screenshots are shown in most discovery surfaces before a user taps the listing.
- Short description: Test benefit-led vs. social-proof-led copy. "Trusted by 2 million users" vs. "Track every expense in 10 seconds." One of these will convert your specific audience better; you cannot predict which without testing.
- Long description opening paragraph: Test the first 167 characters (the above-the-fold preview). This is the only part of the description most users read. A stronger opening reduces the "bounce" from users who opened your listing but did not install.
- Feature graphic and promo video: Test last. Smaller impact per experiment, but cumulative gains add up once the higher-impact elements are locked.
Google Play's developer documentation confirms that apps running regular Store Listing Experiments see materially higher conversion rates over time than apps that do not. The compounding is real: a 10% lift from icon testing, a 12% lift from screenshot testing, and a 5% lift from description testing combine to a 29% overall conversion improvement—which applies to every organic install source simultaneously.
Run experiments on your main listing and your country-specific Custom Store Listings separately. Your Hindi-language listing and your English-language listing may have completely different optimal icons and screenshots—the same creative does not necessarily win across both audiences.
One underrated experiment type: test your short description against your competitor's short description verbatim (with their brand name removed). This is a legal, platform-permitted approach to benchmarking whether your copy is genuinely more compelling to your shared audience than theirs. The result is often humbling—and immediately actionable. Our analytics team sets up and interprets Store Listing Experiments for portfolio apps as part of every ongoing ASO engagement.
How do In-App Events function as an ASO discovery signal?
In-App Events are Apple's most powerful underutilised ASO tool: they publish time-limited events directly to App Store discovery surfaces—Today tab, search results, category browse pages, and editorial features—generating organic install and re-engagement spikes without any paid spend, while simultaneously contributing to the keyword relevance signals that influence organic ranking.
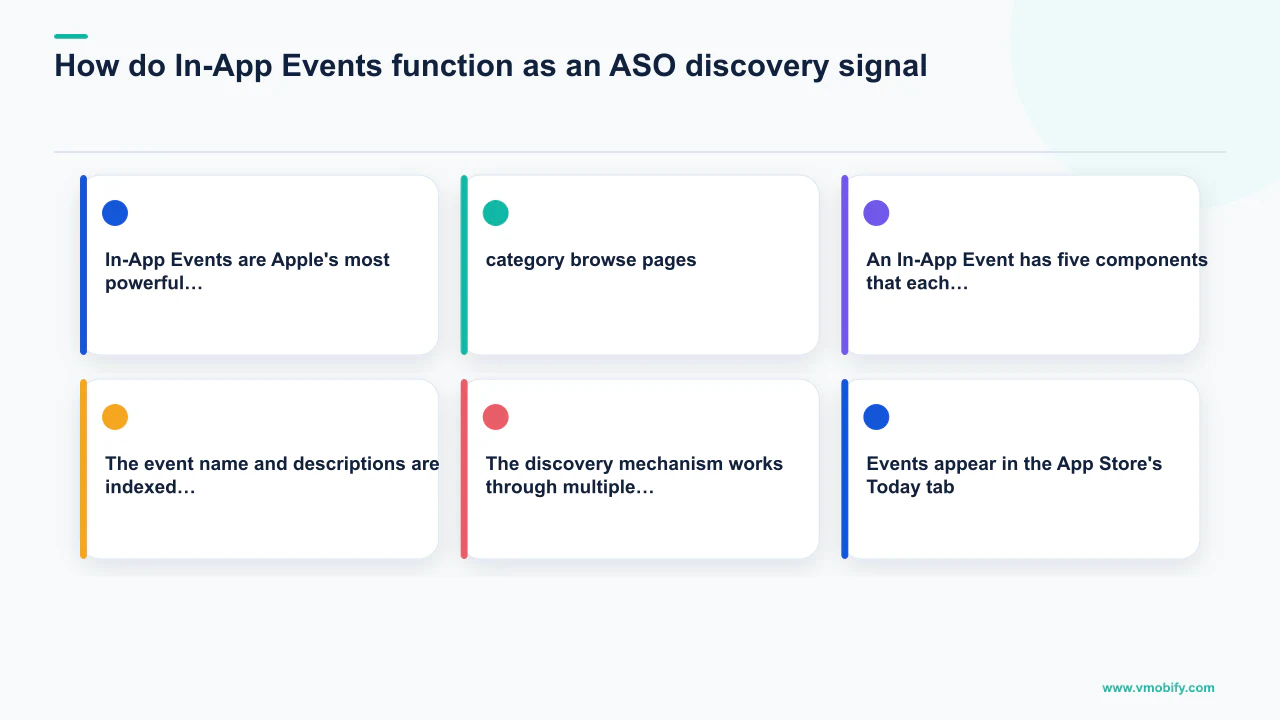
An In-App Event has five components that each affect both discoverability and conversion: the event badge type (new content, challenge, competition, major update, etc.), the event name, the short description, the long description, and the event card image. The event name and descriptions are indexed for keyword ranking—a fitness app publishing an event called "30-Day Strength Challenge: Build Muscle in a Month" is generating indexable keyword signals around "strength challenge", "build muscle", and "30 day challenge" that supplement its base metadata.
The discovery mechanism works through multiple surfaces. Events appear in the App Store's Today tab—the first tab most users see when they open the App Store. They appear in search results as an enriched listing beneath the main result for relevant queries. They surface in category browse pages. Apple's editorial team also considers apps with active, well-crafted events for featured placements—a Today Story or App of the Day, which can drive tens of thousands of installs in a single day.
The install and re-engagement data we have seen across our portfolio of apps running regular In-App Event programmes:
The strategy for maximum impact: align events with natural demand spikes in your category. A finance app publishes a "Tax Season Savings Sprint" event in March. A fitness app publishes a "New Year Challenge" event in January. An education app publishes a "Back to School Reading Programme" event in August. The search demand for these themes already exists—your event surfaces at the moment intent is highest, with no paid spend required.
To build the event card image correctly: Apple requires a 2,960×1,320px event card, but the visible safe zone is narrower. Use the Apple In-App Events developer documentation for exact specifications. The image should communicate the event's excitement and time-pressure in a single frame—users decide in under two seconds whether to tap. A compelling event card image is the highest-impact creative element for event performance.
Google Play's equivalent—LiveOps events—works similarly: you can publish in-game or in-app events that surface across Play Store discovery. The adoption and surface area are currently narrower than Apple's In-App Events, but the mechanism and strategy are analogous. Our ASO management service includes In-App Events and LiveOps event planning as part of the ongoing programme.
How do you audit where you are currently losing installs?
The ASO audit starts with two conversion funnel metrics that most teams never measure: impression-to-page-view rate (the share of users who see your app in search results and tap to view the listing) and page-view-to-install rate (the share of listing visitors who actually install). These two numbers tell you precisely where in your funnel you are leaking installs and what to fix first.
Both metrics are available in App Store Connect (under Analytics → Impressions and Product Page Views) and Google Play Console (under Acquire → Store Performance). Benchmark targets from our portfolio:
- Impression-to-page-view rate: Target ≥25% for search results traffic. Below 15% means your icon, title, or rating is not compelling enough to earn a tap from users who saw you. Fix the icon and title before anything else.
- Page-view-to-install rate: Target ≥30% for organic search traffic. Below 20% means your listing is not converting visitors—your screenshots, description, or ratings are the problem. Below 15% is a serious conversion failure.
Use these benchmarks to diagnose the problem before deciding what to test. An impression-to-page-view rate of 12% points to a search result visibility problem (icon, title, rating visible in results). A page-view-to-install rate of 18% points to a listing conversion problem (screenshots, video, description, ratings on the listing page). Testing screenshots when the real problem is your icon wastes experiment traffic.
A full ASO audit covers eight areas, worked through in impact order:
- Keyword ranking coverage: Which of your target keywords rank in the top 10? Top 30? Which have dropped since the last audit? Use AppTweak or Sensor Tower for position tracking.
- Metadata efficiency: Is every character of your iOS keyword field used? Are there repeated words across title / subtitle / keyword field? Is your Google Play description hitting 2–3% keyword density without stuffing?
- Screenshot caption indexing: Are your iOS screenshot captions containing the keywords you want to rank for? (This matters since June 2025's OCR indexing update.)
- Creative conversion: Are your icon and first two screenshots optimised for the impression-to-tap rate? Have you run at least one A/B experiment in the past 90 days?
- Ratings and reviews: Is your average rating above 4.3? Is there an active review velocity programme in place? Are negative reviews being responded to within 24 hours?
- Custom Product Pages / Store Listing Experiments: Are CPPs active and assigned to keyword clusters? Are Store Listing Experiments running or scheduled?
- In-App Events / LiveOps: Is there an active or scheduled event? Is the event calendar aligned with seasonal demand peaks in your category?
- Localisation coverage: Are your top three non-English markets covered with localised store listings? Is the localisation current with the latest screenshot set?
Running this audit quarterly—and acting on the highest-priority finding each quarter—compounds into material organic growth over a 12-month cycle. Across apps in our portfolio that run structured quarterly audits, we consistently see 25–40% organic install growth year over year, compared to 5–10% for apps without a systematic programme. For a professional audit with competitive benchmarking and a prioritised action plan, get in touch with Vmobify—we have run ASO programmes for 300+ apps across India and globally, and our case studies document the install lifts that systematic optimisation delivers. You may also find our ASO trends for 2026 post useful as a companion read.
A gaming app that had plateau-ed at 12,000 organic installs per month underwent a full ASO audit. The diagnosis: impression-to-page-view rate of 11% (icon and title problem) and page-view-to-install rate of 22% (screenshot problem). After icon redesign and screenshot overhaul, organic installs reached 19,000 per month within 75 days—a 58% increase at zero additional ad spend. The user acquisition budget stayed identical throughout.
Frequently Asked Questions
What is app store optimisation (ASO) and why does it matter in 2026?+
App store optimisation is the practice of improving your app's visibility in App Store and Google Play search results, and improving the conversion rate of your store listing. In 2026 it matters more than ever because 65–70% of downloads follow a keyword search, and both Apple Intelligence and Google Play's Guided Search are raising the quality bar—apps with well-structured, natural-language metadata and strong engagement signals rank above competitors who have not adapted.
How long does ASO take to show results?+
On Google Play, metadata changes typically show ranking impact within 3–7 days because updates go live in hours. On iOS, each App Review cycle takes 1–3 days, and ranking movement from a metadata change is usually visible within 7–14 days. Store conversion experiment results (determining a winner statistically) require 2–6 weeks depending on traffic volume. Expect a meaningful organic install lift within 60–90 days of a systematic ASO programme.
What is the difference between iOS ASO and Android ASO?+
iOS indexes three specific metadata fields (title, subtitle, keyword field) and screenshot caption text via OCR. Android indexes all visible copy—title, short description, and the full long description. iOS rewards keyword placement precision; Android rewards keyword density across visible copy plus engagement and retention signals. The tools also differ: iOS has Custom Product Pages and In-App Events, Android has Store Listing Experiments and Custom Store Listings per country.
What are Custom Product Pages and how do they help with ASO in 2026?+
Custom Product Pages (CPPs) are alternate versions of your iOS App Store listing—up to 70 per app since early 2026—each with unique screenshots, video, and promotional text targeting a specific audience or keyword cluster. In 2026, CPPs appear in organic search results for their assigned keywords, making them both a paid conversion tool (when paired with Apple Search Ads) and an organic ranking surface. Apps running CPP programmes typically see 20–40% higher conversion rates versus their default listing.
How do ratings and reviews affect ASO rankings?+
Ratings affect both ranking and conversion simultaneously. A higher average rating improves your app's position in search results on both stores, and a 4.5★ app converts 30–40% better than a 3.8★ app at the same keyword position. The correct approach is to trigger the native in-app review prompt at moments of demonstrated satisfaction—after a completed workout, a successful payment, finishing a level—never on first open. Aim for at least 50 new ratings per month for ranking stability.
Should I do ASO before or after launching paid user acquisition?+
ASO first, always. Paid UA drives traffic to your store listing—if the listing is unoptimised, you are paying per click to a page that converts poorly. Across our portfolio, we see 30–60% of paid UA budget effectively wasted on apps without a tuned store listing. The minimum viable ASO state before spending on paid channels: title and subtitle contain the primary keywords, screenshots pass the impression-to-tap rate threshold (above 25%), and average rating is above 4.0.
How has Apple Intelligence changed ASO in 2026?+
Apple Intelligence applies semantic understanding to App Store search queries, weighting intent and relevance over exact keyword match. Apps with natural-language, benefit-forward metadata rank better under this system than apps with keyword-stuffed copy that reads mechanically. The practical implication: rewrite your description and subtitle as genuine sentences about what your app does and who it helps, not as keyword lists. The screenshot OCR indexing update (June 2025) is a related shift—every word in your screenshot captions now contributes to keyword ranking.
Sources
- Apple — Custom Product Pages — Apple's official documentation on CPPs — now up to 70 per app, with organic search placement.
- Apple — In-App Events — Apple developer documentation for event card specs, badge types, and discovery surfaces.
- Apple Search Ads — The primary source of real iOS keyword volume data and the highest-intent iOS install channel.
- Google Play Developer — Launch Best Practices — Google's official guidance on Store Listing Experiments, metadata, and the In-App Review API.
- AppTweak ASO Blog — Independent ASO research and benchmarks on keyword research methodology and conversion rates.
- SplitMetrics ASO Research — Conversion testing research showing 10–25% lift ranges from disciplined store creative experiments.
- StoreMaven ASO Research — Store listing conversion benchmarks and creative testing methodology for iOS and Android.
- AppsFlyer Performance Index — Annual benchmark report on install channel performance and retention signal weighting.
About the author
Amol Pomane — Founder, Vmobify
Amol leads Vmobify, a mobile app growth agency that has driven 30M+ downloads and ranked 54K+ keywords across 300+ apps since 2013. He writes about ASO, paid user acquisition, retention, and the operational reality of scaling mobile apps in India and global markets.
Check your store metadata
Run your current App Store or Play metadata through the free checker.
Open free tool