Why Most Apps Fail in the First 90 Days (And How to Fix It)
Almost no app dies of one dramatic failure. It dies of a sequence: nobody found it, the few who did left on day one, and the numbers were too small and too flattering to show either problem in time. This is the failure taxonomy we have watched play out across a decade of launches, and the parts of it you can still fix.
On this page
- What actually kills apps in the first 90 days?
- Why does no-distribution beat bad-product as a failure cause?
- How does weak retention make paid acquisition impossible?
- Why do founders misread their early metrics?
- What does the 90-day checkpoint look like for a healthy app?
- Which failures are recoverable, and which are not?
- How do you decide between iterating, pivoting and stopping?
- What would you do differently if you started again?
- Frequently Asked Questions
What actually kills apps in the first 90 days?
Almost no app dies of a single dramatic failure. It dies of a sequence — nobody found it, the handful who did left within a day, and the numbers were too small and too flattering to reveal either problem while there was still money to fix them. The dramatic version, where a competitor crushes you or the platform changes a rule, is rare. The quiet version is nearly universal.
Across the 300+ apps we have managed since 2013, the same five failure modes account for the overwhelming majority of launches that go nowhere. They are worth naming precisely, because founders routinely diagnose the wrong one and then spend three months fixing something that was never broken.
- No distribution. The team built for a year and planned for a week. There is no channel, no audience, no store presence beyond a listing, and no answer to the question of where the next hundred installs come from.
- A retention floor below the useful threshold. Users arrive and do not come back. Every downstream number — revenue, ratings, ranking, word of mouth — inherits that failure, so it looks like five problems rather than one.
- The wrong success metric. The team optimises installs, because installs are the number that moves fastest and feels best. Installs are an input, not an outcome.
- Money spent before the funnel could hold it. Paid acquisition switched on at week two, against a product that has not yet demonstrated that anybody stays.
- Technical quality that the store itself punishes. This one is invisible to founders because it does not show up as a crash report they read; it shows up as a slow, unexplained decline in organic installs.
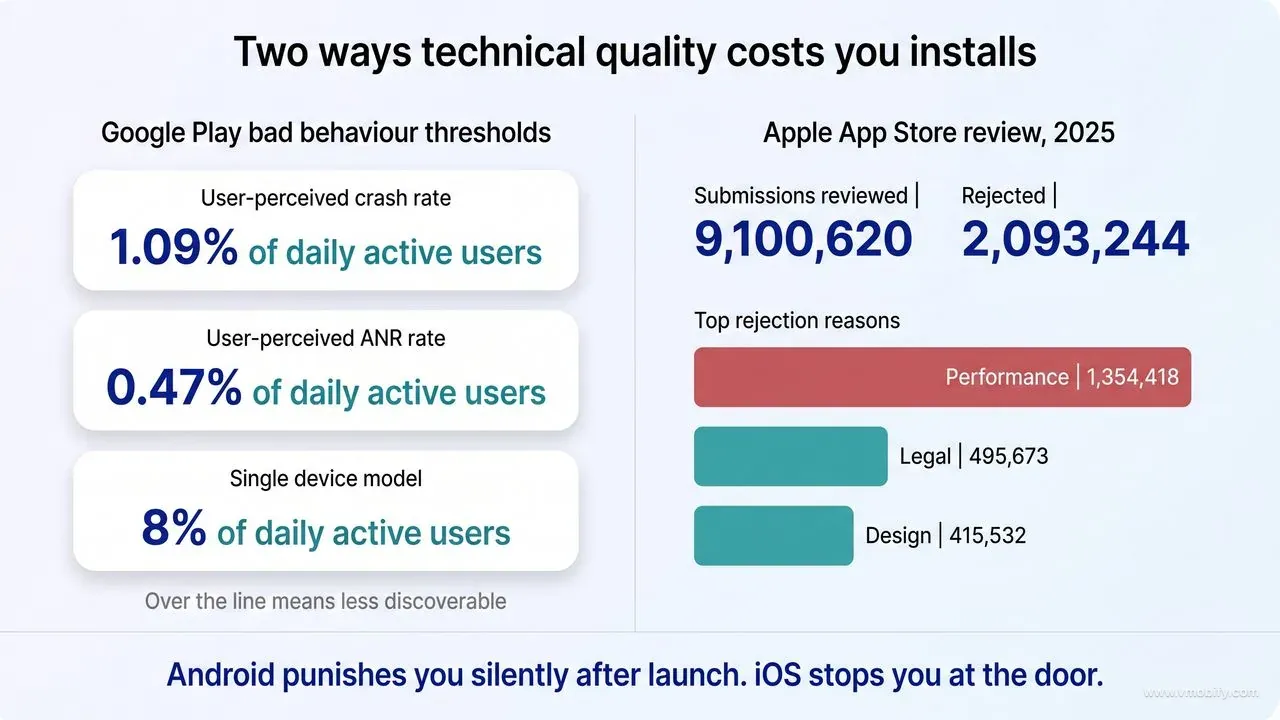
That last one deserves specifics, because it is the failure mode most often misfiled as "our marketing is not working". Google Play publishes explicit bad behaviour thresholds in Android vitals, and they are stricter than most teams assume. An app is over the line when at least this share of daily active users is affected:
Google's own wording on the consequence is unambiguous: an app over the overall threshold "is likely to be less discoverable on all devices", and an app over the per-device threshold may have a warning shown on its store listing.
Read that again with a launch budget in mind. A crash rate of 1.2% sounds tolerable to an engineer — 98.8% of sessions are fine. To the Play ranking system it is a demotion, applied silently, to the one channel you are not paying for. Teams then increase their media spend to compensate for the organic decline, which raises blended cost per install, which makes the unit economics look worse than the product deserves.
The iOS equivalent bites earlier, at review. Apple's 2025 App Store Transparency Report records 9,100,620 app submissions reviewed and 2,093,244 rejected, with the Performance section of the guidelines cited in 1,354,418 of those rejections — far ahead of Legal at 495,673 and Design at 415,532. Performance rejections are largely crashes, incomplete builds, broken back ends and placeholder content. A rejection costs days, and a first-time submission that bounces twice can cost a fortnight of a 90-day window.
Why 90 days specifically? Because that is roughly how long it takes for the two things that mask a failing launch to wear off. Launch attention — the founder's network, the Product Hunt or LinkedIn spike, the press mention — is a one-off draw on goodwill, and in our portfolio it is usually spent within the first few weeks. Store ranking signals, meanwhile, respond to sustained behaviour rather than to a single spike, so it takes a run of steady weeks before your position reflects what the app has genuinely earned. Before day 90 you are looking at noise plus goodwill. After day 90 you are looking at the business. The teams that plan for this treat the entire pre-launch period as the place where distribution is built, which is the argument we make in detail in our guide to pre-launch app marketing.
Why does no-distribution beat bad-product as a failure cause?
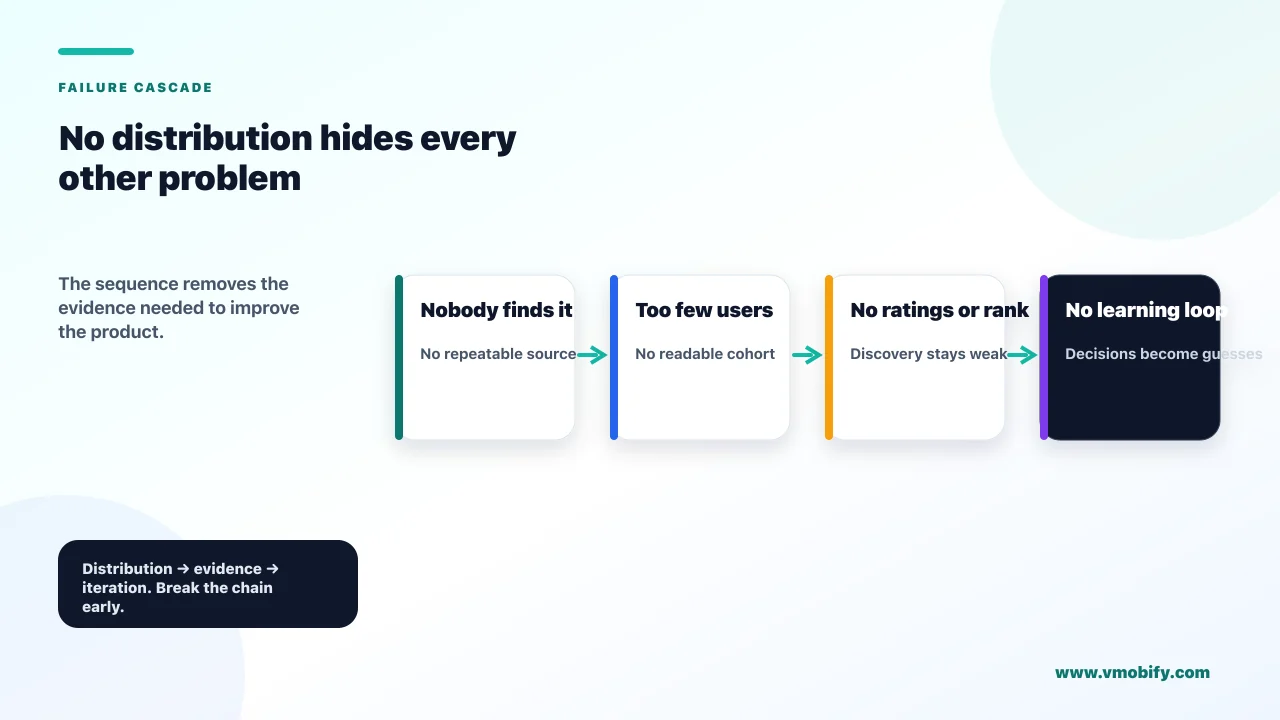
Because a product nobody uses cannot be evaluated. No-distribution is not just the most common failure — it is the failure that hides all the others, since an app with fifty installs produces no retention curve, no ratings, no ranking signal and no evidence about whether the product was ever any good. You cannot iterate your way out of a problem you have no data about.
Start with the shape of the market. Apple's own transparency report puts 2,172,472 apps on the App Store across the 175 countries and regions where it operates. Google publishes no equivalent first-party count, so any cross-store comparison has to come from a tracker that counts both the same way — and on those numbers the two catalogues are effectively level, with 42matters recording 2,540,581 apps on Google Play against 2,558,519 on the App Store on 25 August 2026. Trackers count more permissively than Apple's own report, so treat the ranking as noise. What is not noise is the order of magnitude: whichever store you launch on, you are joining a catalogue of millions. Nobody browses that. Discovery is search, ads, and being told about the app by a person or a publication — and only one of those three is free, slow, and dependent on signals you have not yet accumulated.
Then look at how revenue actually distributes. RevenueCat's State of Subscription Apps 2026 analysis, drawn from 2025 data across the subscription app market, found that only 17.3% of newly launched apps reach $1,000 in monthly revenue within their first two years, and just 4.6% reach $10,000 a month in the same window. Note the measure: RevenueCat reports monthly trailing revenue — a 30-day rolling figure — rather than contracted recurring revenue, so these are run-rate milestones rather than a subscription book. The same research found that apps launched before 2020 still generate 69% of all subscription revenue, despite a roughly sevenfold surge in new launches since 2022. Incumbency compounds. Every month an established app spends ranking, collecting reviews and building a retargetable user base is a month of distribution advantage a new app has to buy or earn.
The polarisation figure in that research is the one worth internalising: the top quartile of apps grew 80% year over year while the bottom quartile shrank by 33%. This is not a market where an average app gets an average outcome. It is a market where distribution advantage feeds on itself in both directions.
What no-distribution looks like in practice, in the order we usually encounter it:
- The store listing is the entire plan. The app is submitted, approved, and then the team waits. Store search does deliver installs, but it delivers them to apps that already rank, and ranking is downstream of installs, conversion and retention. A new listing has none of those.
- The audience was never assembled. No waitlist, no email list, no community presence, no relationship with anyone who writes about the category. Launch day is a cold start.
- The keyword set was chosen after the build. Metadata written in an afternoon, targeting terms the app cannot realistically rank for, with no research into what the category's actual search demand looks like.
- The first channel was chosen by familiarity, not fit. The founder knows Instagram, so the plan is Instagram — regardless of whether the app's users are found there.
- Nobody owns growth. The engineering team owns shipping and the founder owns everything else, so growth is the thing that gets done after the sprint, which means it does not get done.
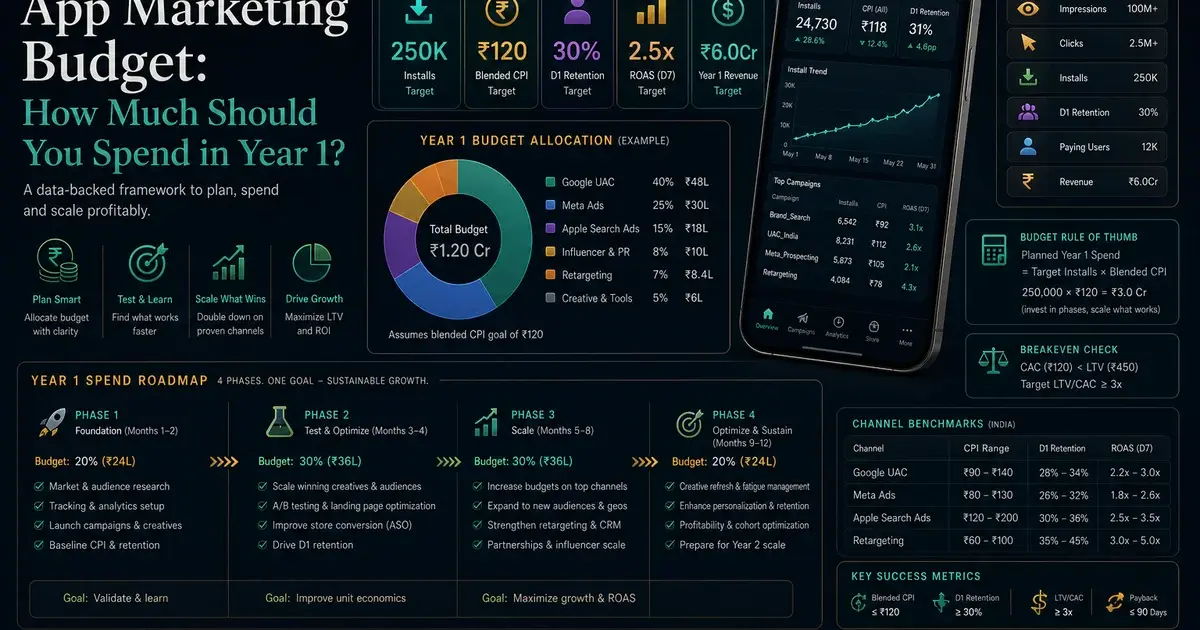
The correction is not glamorous and it is almost entirely front-loaded. Distribution should be under construction while the product is being built, not after it ships. Concretely: a waitlist that starts collecting emails at the first working prototype; a presence in two or three communities where the problem you solve is discussed, established months before you have anything to sell; keyword research done early enough to influence what the product is called and how it is positioned; and one paid channel identified with a realistic first-quarter budget attached, rather than a number invented in a spreadsheet the week before launch. We set out how that budget should be phased in our breakdown of a realistic first-year app marketing budget.
One more thing worth saying plainly, because it is the most expensive misconception in this business: virality is not a distribution plan. Referral mechanics amplify an existing user base. They do not create one. An app with a strong referral loop and no initial users grows at exactly the rate of zero multiplied by the loop coefficient.
How does weak retention make paid acquisition impossible?
Because paid acquisition is a multiplier on retention, not a substitute for it — and a multiplier applied to a number near zero returns a number near zero, however good your creative is. This is the single most expensive lesson in the first 90 days, and it is usually learned after the money is gone.
The scale of ordinary churn is worth stating with a real number rather than a shrug. AppsFlyer's app uninstall report — the 2025 edition, reporting on 2024 data — is built on roughly 2,200 apps, 1.3 billion installs and 402 million uninstalls, and found that 46.1% of Android installs were uninstalled within 30 days during 2024, down marginally from 46.9% in 2023. That is the baseline for apps in market, many of them mature and well-optimised. It is Android-only, because iOS uninstall measurement has been constrained since iOS 15. The report also notes that the majority of uninstalls happen on the first day, and that non-organic uninstall rates ran roughly 22% higher than organic ones on average across categories in 2024. That is a relative gap rather than a gap in percentage points, and it varies enormously by category — Dating sits at a few points of difference, News & Magazines at close to double. The direction is the constant: paid users churn harder than users who came looking for you.
Now put that alongside the arithmetic of a paid campaign. Suppose you acquire a user for ₹40. If half of your installs are gone within a month and the surviving half monetises at ₹15 over the same period, you are not running a growth campaign, you are running a subsidy. Increasing spend does not fix it. Better creative does not fix it — it lowers cost per install, which reduces the loss per user without reversing its sign. Only retention or monetisation changes the sign, and retention is almost always the cheaper of the two to move early. We keep a working model of that relationship in our LTV to CAC calculator, and the exercise most founders find sobering is discovering how much day-30 retention has to move before a marginal campaign becomes a profitable one.
There is a second, subtler mechanism that catches teams who have the arithmetic right. Paid users are usually worse than organic users at equivalent volume, so scaling spend degrades your blended retention even when nothing about the product changed. The dashboard shows retention falling in the same month you increased investment, and the natural but wrong conclusion is that the product got worse. It did not. Your mix did.
What actually moves the number in the first 90 days, in rough order of return on effort:
- The first session. Time to first value, not time to signup. Every screen between opening the app and experiencing the thing the app is for is a place where you lose a share of the users you still have, and those losses compound with each one.
- Removing the account wall. Requiring registration before value is demonstrated is the most reliably costly decision available to a new app. If you must collect an account, collect it after the user has a reason to want one.
- Honest store expectations. Screenshots and copy that oversell produce installs that churn on day one. High install volume with catastrophic day-1 retention usually means the listing is writing cheques the product does not cash.
- Day-2 and day-7 return triggers. A reason to come back, delivered at a moment when returning makes sense, rather than a generic notification on a schedule.
- Fixing the top three crash and ANR clusters. Frequently the single highest-return week of engineering in the whole quarter, because it moves retention and store ranking at the same time.
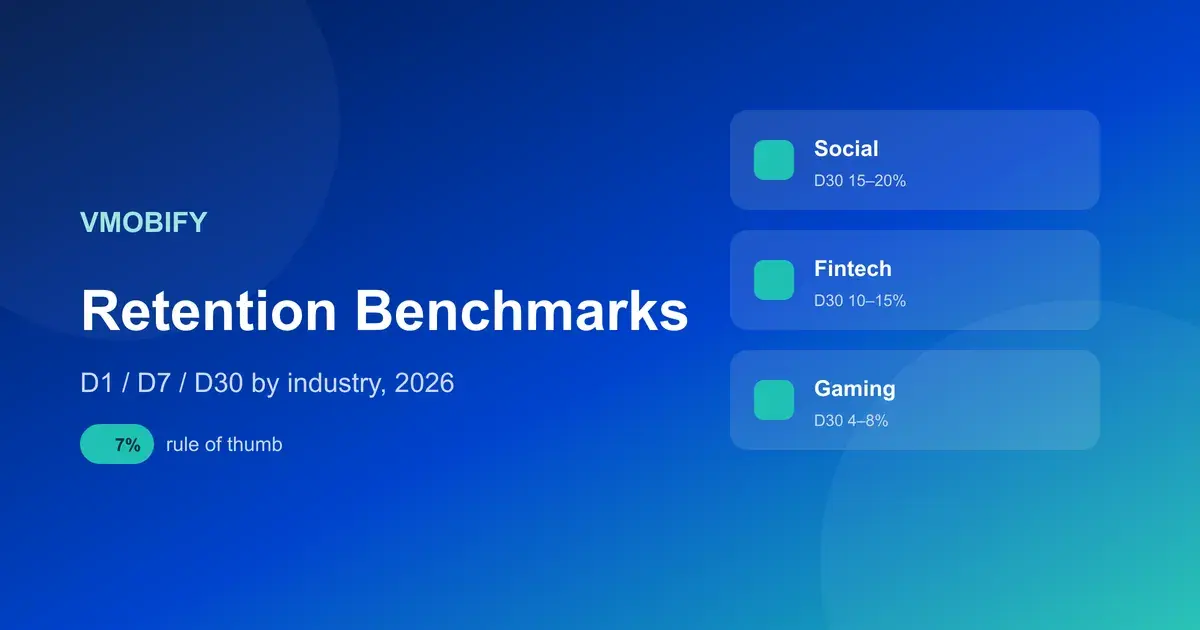
In our portfolio, the apps that survive their first quarter are not the ones with the best acquisition. They are the ones that treated the retention curve as the product roadmap, and only opened the media budget once the curve stopped falling to zero. Our retention benchmarks breakdown covers how to read your own curve against category norms rather than against a single industry-wide average that describes nobody.
One practical guard rail: set a spend gate before you have a reason to break it. Decide, in writing, that paid acquisition stays off until a defined cohort metric holds — a day-7 retention floor, or a defined number of users completing the core action twice. Founders who set that gate at week zero honour it. Founders who improvise it at week six do not, because by then there is a launch narrative to protect.
Why do founders misread their early metrics?
Because launch-week data is made of one-off attention, and almost every metric computed from it flatters the app in a way that looks exactly like traction. The misreading is not carelessness. The numbers genuinely are misleading, and several of them are misleading in mathematically predictable ways that nobody warns you about.
The specific traps, in the order they usually claim a quarter:
- Installs as the headline. Installs measure how many people were persuaded to try. They say nothing about whether the product worked. A launch that produces 5,000 installs and 40 weekly actives is a worse position than one producing 500 installs and 120 weekly actives, because the second has something to build on and the first has burned its warmest audience.
- Aggregate retention instead of cohorts. This is the trap that does the most damage, because it works in your favour. Aggregate retention — actives divided by total installs — rises automatically as install growth slows, since the denominator stops inflating while the surviving loyal core keeps returning. A dying app with a collapsing install curve will show improving aggregate retention for weeks. Only cohort retention, tracking each week's arrivals separately, tells you the truth.
- Reading a curve that has not had time to flatten. Day-1 and day-7 numbers on the first cohort are the noisiest data your app will ever produce, and they are drawn from your most favourably disposed users. Judge the shape across at least four or five cohorts before you act on it.
- Store conversion rate confounded by traffic mix. A rising or falling listing conversion rate usually reflects a change in who is arriving, not a change in the listing. Someone who searched for your app by name converts far more readily than someone browsing a category, so a shift in the traffic mix moves the rate on its own. If your conversion rate moves the week after a press mention, the listing did not improve.
- Reacting to differences that are not there. An onboarding test on 300 users cannot resolve a five-point difference. Early-stage teams run tests, read a two-point movement as a result, ship it, and then wonder why the aggregate never moves. If a change is worth testing, it is worth deciding in advance how much traffic will be needed to see it.
- Counting installs as activations. An install is a person who downloaded software. An activated user is a person who experienced the value the app exists to deliver. The gap between those two is where most early product work belongs, and teams that do not measure it separately cannot see the gap at all.
Subscription apps have their own version of the same problem, and RevenueCat's data quantifies it neatly: 55% of all cancellations on three-day free trials occur on day zero. Users are not evaluating your product over three days and deciding against it — a majority are deciding within minutes of hitting the paywall, often before they have used anything. Reading day-3 trial conversion as a verdict on the product misses that entirely; the verdict was delivered at the paywall, and the paywall is a first-session problem.
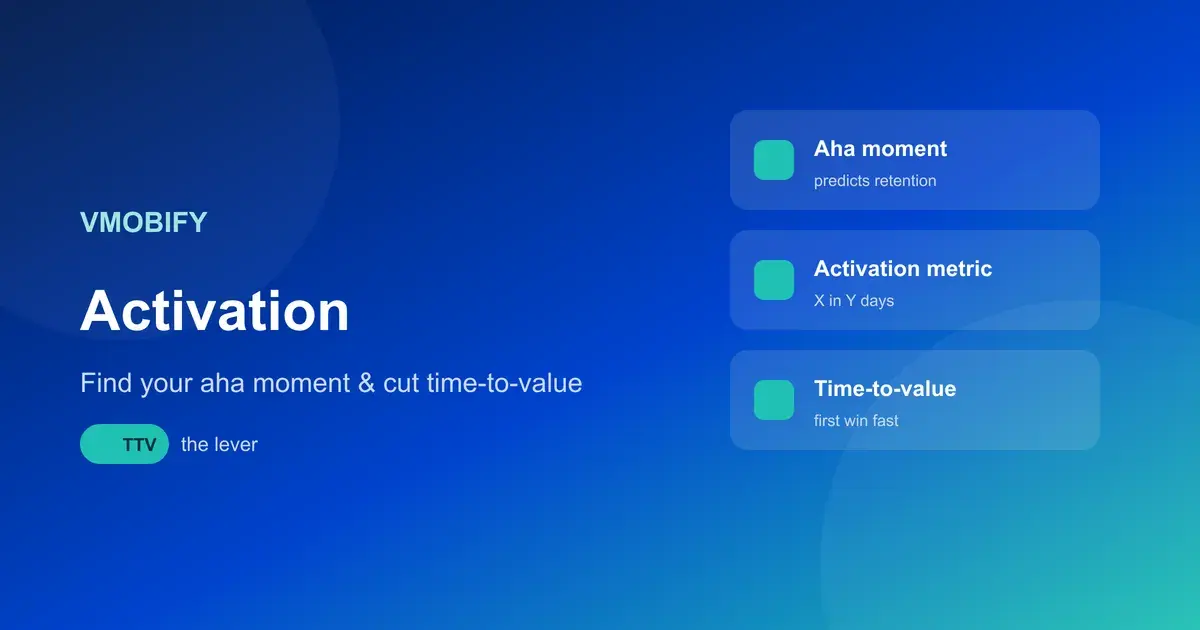
The correction is to fix your measurement before you fix your product. Define one activation event that genuinely represents value delivered — a first message sent, a first portfolio linked, a first workout completed, a first invoice raised — and instrument it before launch, not after the data looks bad. Then report cohorts weekly, in the same format, and resist recalculating the definitions when the numbers disappoint. We set out how to choose that event and how to find the moment it corresponds to in our piece on the activation aha moment.
One habit is worth more than any dashboard: write down what you expect to see before you look. "I expect day-7 retention of this cohort to be around 12%, and if it is under 8% the onboarding change did not work." Founders who do this catch problems in week three. Founders who read the dashboard first find a story that accommodates whatever the numbers say, every single time.
What does the 90-day checkpoint look like for a healthy app?
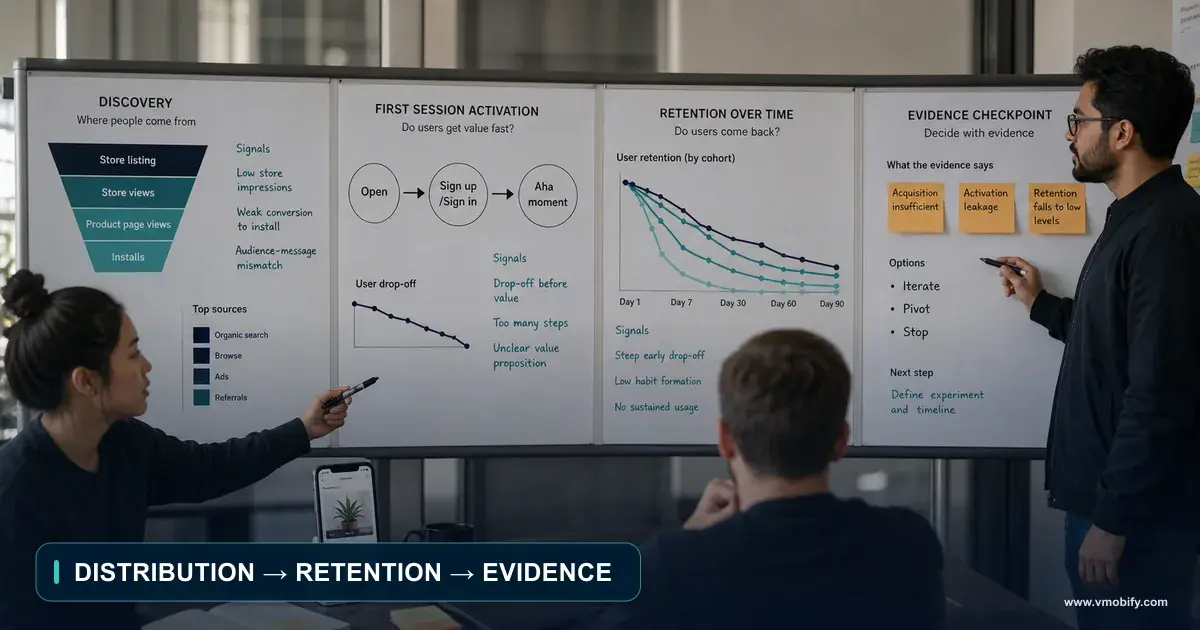
A healthy app at day 90 has three things: at least one install source that repeats without a launch event behind it, a retention curve that flattens rather than reaching zero, and one activation number that has moved because of something you deliberately changed. Not scale. Not revenue. Repeatability, a floor, and evidence that you can influence your own funnel.
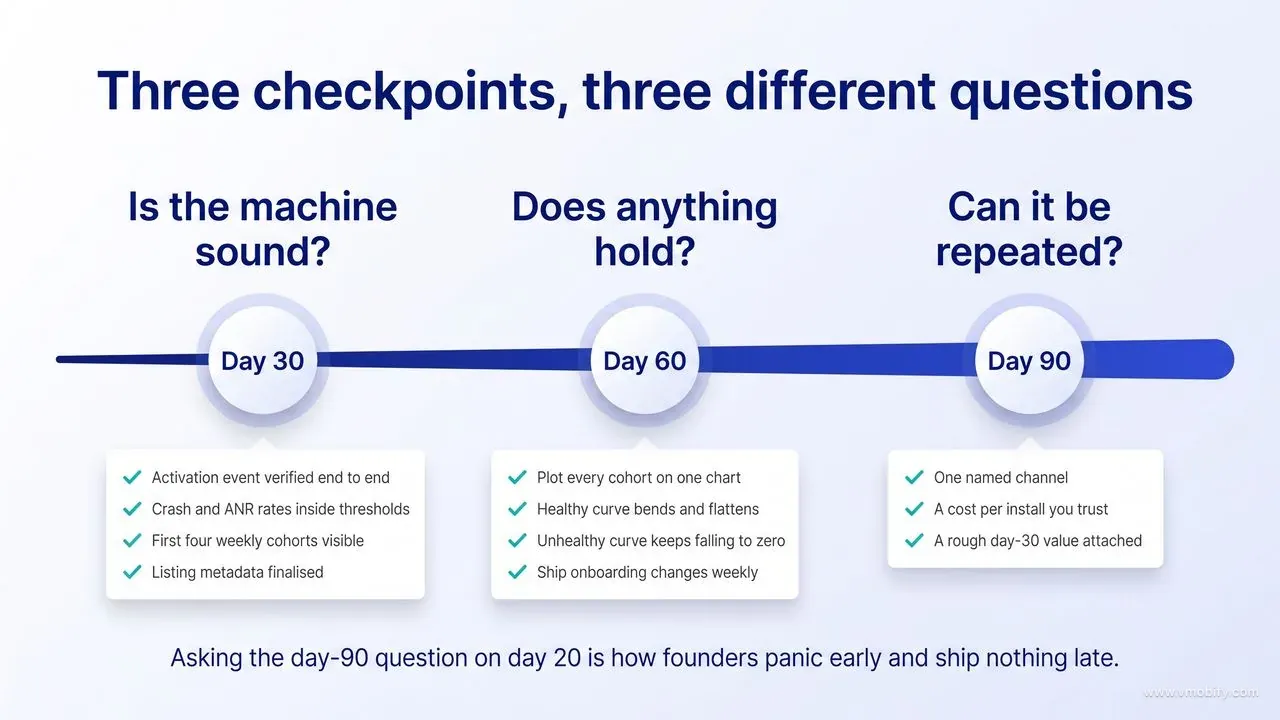
It helps to break the quarter into three checkpoints with different questions, because the mistake most teams make is asking the day-90 question on day 20 and panicking, or asking the day-20 question on day 85 and shipping nothing.
- Day 30 — is the machine sound? This month is about instrumentation and technical health, not growth. By day 30 you should have: analytics firing correctly on your defined activation event and verified end to end, not assumed; crash and ANR rates comfortably inside Google Play's thresholds rather than hovering at them; your first four weekly cohorts visible as separate rows; store listing metadata finalised with deliberate keyword choices; and the first review responses posted. If the funnel is not measured correctly by day 30, everything after it is guesswork. On platform compliance, check your target API level against the current requirement while you are in there — Google Play now requires new apps and updates to target Android 16 (API level 36) or higher from 31 August 2026, with existing apps needing to target API level 35 or higher to remain available to new users on devices running a newer Android version than the app targets, and extensions available to 1 November 2026.
- Day 60 — does anything hold? Now the question is retention shape. Plot your cohorts on one chart. A healthy curve declines steeply, then bends and flattens into a floor — the users for whom the app solved a real problem. An unhealthy curve declines steeply and keeps going, approaching zero with no bend. The absolute numbers matter far less than the shape, because the shape tells you whether a retained segment exists at all. If it does, your job is to find out who they are and go and get more of them. If it does not, no acquisition budget will help, and the honest work is product work. This is also the point at which onboarding changes should be shipping weekly rather than quarterly, guided by where the first-session funnel actually breaks — our onboarding best practices guide covers the sequence we use.
- Day 90 — can it be repeated? The final question is whether you can produce installs on purpose. One channel where you can spend or invest effort and reliably get users at a cost you can describe is worth more than five channels you have dabbled in. By day 90 you want a named channel, a cost per install you trust, a rough sense of what happens to those users at day 30, and a defensible view of whether that relationship can hold as you scale.
What a healthy 90-day position looks like when written down:
- Vitals inside thresholds on both platforms, with no store-listing warning and no unexplained decline in organic installs.
- Cohort retention that flattens — a visible floor by week four, whatever its height, rather than a curve heading to zero.
- An activation rate you can state as a percentage of installs, measured the same way for three months running.
- One repeatable channel with a cost per install and a rough day-30 value attached to it.
- A rating average above 4.0 with a review response habit in place, because the rating is the single most visible conversion lever on your listing and it gets harder to move as volume accumulates.
- A shipping cadence — at least fortnightly releases, each tied to something you learned rather than to a roadmap written before launch.
Notice what is not on that list: revenue targets, install milestones, press coverage, funding. Those are outcomes of the six items above, and chasing them directly in the first quarter is how teams end up with a launch that looked good and a business that never started. The compounding lives in the unphotogenic work — the instrumentation that is verified rather than assumed, the vitals held inside the thresholds, the listing written deliberately, the single channel you learned properly — and none of it makes a good launch-day post.
Which failures are recoverable, and which are not?
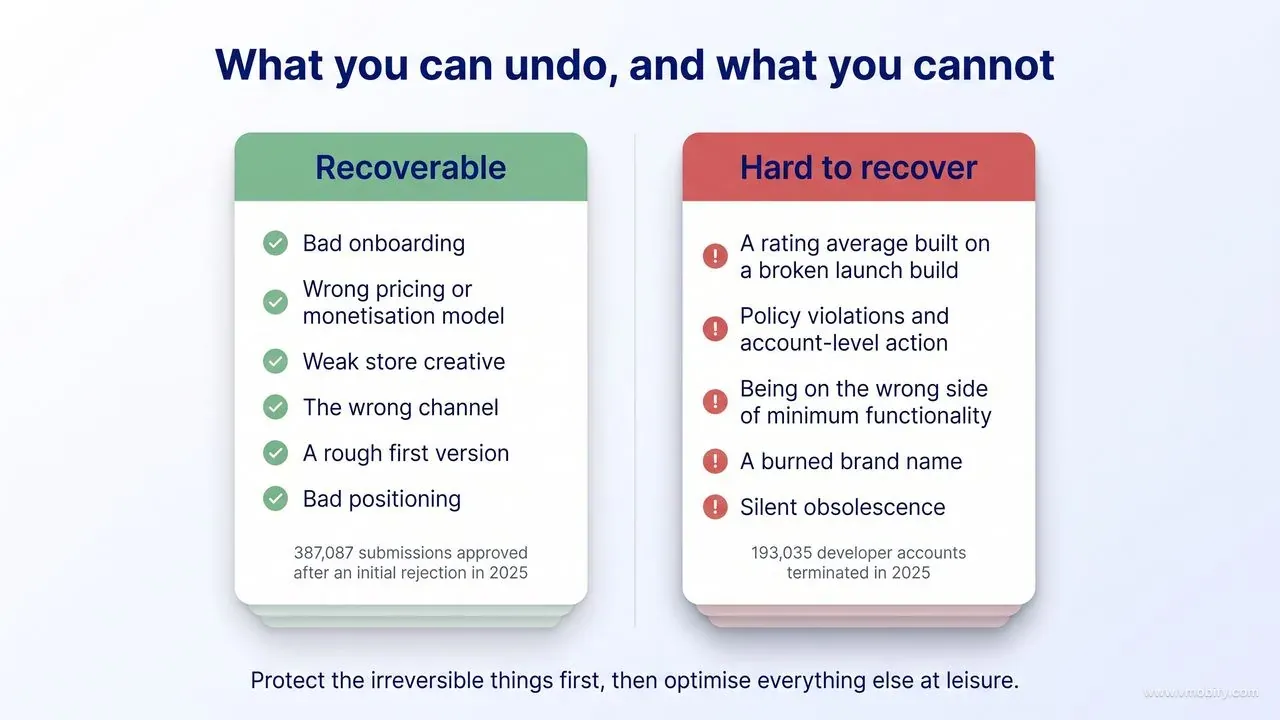
Nearly every product and marketing failure in the first 90 days is recoverable. The failures that are not tend to involve the developer account, a policy strike, or a permanent record — a rating average, a review history, a burned brand name — that new work cannot overwrite. Knowing which category you are in should change how urgently you act.
Recoverable, and more cheaply than founders expect
- Bad onboarding. The highest-return fix available and usually a fortnight of work. Nothing about your existing users is damaged by improving the first session for the next ones.
- Wrong pricing or the wrong monetisation model. Fully reversible, and often dramatically consequential — RevenueCat's benchmarks put hard-paywall apps at 10.7% download-to-paid conversion by day 35 against 2.1% for freemium, with year-one retention rates between the two models close to identical. Model choice is a decision, not a fact of nature.
- Weak store creative. Screenshots, icon, first three lines of the description. Testable, replaceable, and frequently worth more than a month of media spend.
- The wrong channel. Being wrong about where your users are costs money and time, but nothing about being wrong on Meta prevents you from being right on search.
- A rough first version. Apple's transparency report records 387,087 submissions approved after an initial rejection in 2025. Rejection is a queue, not a verdict.
- Bad positioning. Painful because it invalidates a lot of copy, but the underlying product usually survives a repositioning intact.
Hard to recover from, and worth treating as a different class of risk
- A rating average built on a broken launch build. Ratings are cumulative. Two hundred one-star reviews from a version that crashed on launch will drag your average for a very long time, and every one of your listing's future visitors sees the average before they see anything you have fixed. This is the strongest practical argument for a limited soft launch rather than a full-volume one.
- Policy violations and account-level action. Apple removed 166,899 apps from the App Store in 2025, but read that table carefully before drawing conclusions from it. The second-largest line, Guideline 4.0 (Design) at 72,271 removals, is not an enforcement story at all: Apple's own footnote against it says the removal "is the result of ongoing cleanup for outdated apps". The enforcement bucket is the line above it — DPLA 3.2(f) (Fraud), cited in 90,608 removals, and the same provision behind 192,702 of the 193,035 developer accounts Apple terminated that year. A removal is survivable. A terminated developer account, or a pattern of strikes, is a different problem, because it attaches to you rather than to the app.
- Being on the wrong side of minimum functionality. Apple's guideline 4.2 is direct: an app "should include features, content, and UI that elevate it beyond a repackaged website", and if it "is not particularly useful, unique, or app-like, it doesn't belong on the App Store". Read the App Store Review Guidelines before you build a wrapper, not after it is rejected. This is a scope problem, and scope problems are expensive to fix late.
- A burned brand name. If your app name is now associated with a bad first impression in your target community, renaming is possible but you lose whatever ranking history and brand search volume you had accumulated.
- Silent obsolescence. An abandoned Android app is not removed for falling behind on target API level — it simply stops being available to new users on devices running a newer Android version than it targets. The listing survives; the distribution quietly does not. Teams discover this months later, when organic installs have already gone.
The practical implication of that split is a sequencing rule we apply to every early-stage engagement: protect the irreversible things first, then optimise everything else at leisure. Concretely, that means holding back full-volume launch until crash rates are stable, staging your release so early ratings come from users who have had a working experience, and treating anything that touches policy — subscription mechanics, data collection, claims in your metadata — as a reviewed decision rather than a default.
The corollary is a licence to be relaxed about the rest. Founders in month two agonise over icon variants and paywall copy as though these were one-shot decisions. They are not. Ship something defensible, measure it, change it. The expensive mistakes in the first 90 days are almost never the aesthetic ones.
How do you decide between iterating, pivoting and stopping?
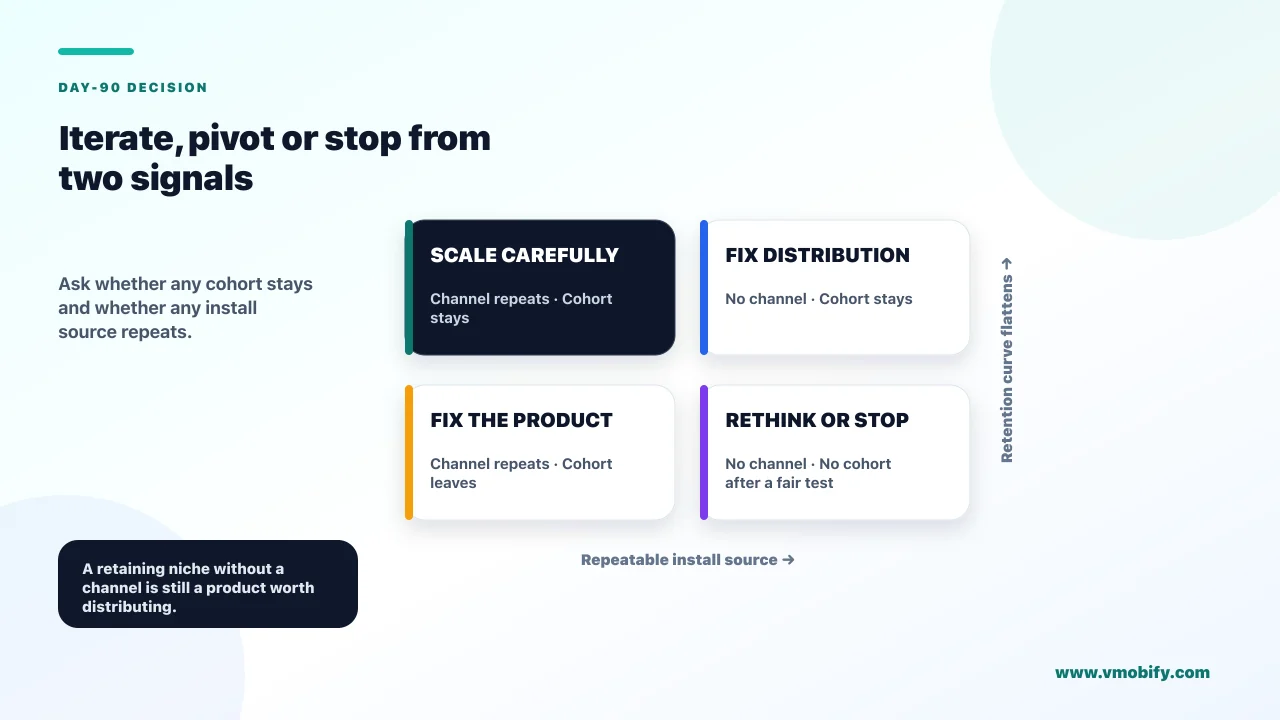
The decision rests on one question, and it is not "is anyone using it" — it is "does any identifiable group of users keep using it". A retaining segment, however small, is a business you have not yet found the market for. No retaining segment after a fair test is a product that does not solve a problem anyone has urgently.
Three outcomes, and the evidence that should produce each:
Iterate when a segment retains. If any slice of your users — one acquisition source, one country, one use case, one demographic — shows a retention curve that flattens meaningfully above the rest, you have found something. The correct response is narrowing, not broadening: rebuild the positioning, the onboarding and the acquisition around that segment specifically, and accept that the product will get less general as it gets more useful. Most of the successful turnarounds we have seen began with a team deleting features and audiences rather than adding them.
Pivot when retention exists but for the wrong reason. This is the most interesting and most frequently missed signal. Users are staying, but for a secondary feature rather than the core one; or they are using the app in a way you did not design and would not have approved. Look for the mismatch between the feature you built the company around and the feature that appears in your retained users' event streams. That gap is a pivot instruction written in your own data, and it is far more reliable than any strategy session.
Stop when 90 days of honest effort produced no retaining cohort and no repeatable channel. Both conditions matter. No cohort but a working channel means you have a distribution asset and a product problem. A cohort but no channel means you have a product and a marketing problem. Neither one is where the difficult decision lives — each has an identified problem and an obvious next move, and each is worth another quarter. The genuinely hard case is the one where both are missing, and the mistake there is rarely stopping too early. It is continuing to fund an app at a level that neither kills it nor gives it a real chance.
Two things to check before you trust any of those readings, because a false negative here is expensive:
- Was the test fair? If the app crashed for the first three weeks, or analytics were misconfigured, or you never acquired users outside your own network, you have not run the experiment. Fix the instrumentation and rerun it before drawing a conclusion.
- Was the sample real? Users acquired through incentivised installs, giveaways or a viral moment unrelated to the product's value will not retain regardless of product quality. Judging on that cohort tells you about the traffic, not the app.
Then do the arithmetic that founders avoid. Take your remaining runway in months. Take an honest estimate of how many months a genuine fix requires — usually double your instinct. If the second number exceeds the first, you are not choosing between iterating and stopping; you are choosing between stopping now with resources intact and stopping later without them. A quick unit-economics model is the fastest way to sanity-check whether the unit economics can plausibly close within that window, or whether closing them requires improvements larger than anything you have achieved to date.
There is a fourth option that nobody names, and it is often the right one: park it. Reduce the app to maintenance, keep it compliant, stop spending, and move your attention elsewhere. A parked app costs a few hours a quarter and preserves the option to return with better distribution or a better market. What it must not become is a zombie — funded enough to consume attention, not enough to change anything. Zombies are how a failed app costs a founder two years instead of one quarter.
Whichever you choose, write the decision down with the evidence attached, and set a date to review it. Decisions made this way are revisited on schedule. Decisions made by drift are revisited when the money runs out.
What would you do differently if you started again?
Build the distribution before the product is finished, define one activation metric before the first screen is designed, and refuse to spend a rupee on acquisition until a cohort demonstrably stays. Those three decisions, made at week zero, account for most of the difference between the launches that survive their first quarter and the ones that quietly do not.
The specific changes we would make, having watched this pattern repeat for more than a decade:
- Start the audience six months before the build finishes. A waitlist, an email list, or a genuine presence in two communities where the problem is discussed. This is the single highest-return hour you can spend, and it is the one that feels least like progress at the time — which is exactly why it gets skipped.
- Choose the activation event before designing the first screen. It changes what you build. "Users must send one message" and "users must complete a profile" produce entirely different products, and picking after launch means you optimised for whatever happened to be easy to measure.
- Do keyword research before naming the app. Store search demand should inform the name, the category and the positioning. Discovering after launch that your name collides with a large incumbent is a fixable problem that costs you everything you accumulated in the meantime.
- Soft launch to a limited audience first. Full-volume launches convert early bugs into permanent rating damage. A staged release lets the crashes hit users who will tell you rather than users who will rate you.
- Set the spend gate in writing at week zero. Paid acquisition begins when a defined retention or activation threshold is met, and not before. The gate is only credible if it is written before there is a narrative to defend.
- Treat crash and ANR rates as marketing metrics. Put them on the growth dashboard, not just the engineering one. On Android they are a direct input into discoverability, which makes them a line item in your acquisition cost whether you count them there or not.
- Book the third month for learning, not for scaling. The strongest launches we have been part of spent month three deliberately narrowing — one segment, one channel, one message — while the weakest spent it broadening in the hope that something would land.
There is a mindset shift underneath all seven. The first 90 days are not a launch. They are an experiment whose purpose is to answer one question: does a group of people, reachable at a cost you can afford, keep using this? Everything else — the install count, the press, the funding conversation, the launch-day screenshot on LinkedIn — is either evidence toward that question or a distraction from it.
Teams that hold that frame make better decisions under pressure, because they know what they are looking for. When the install curve dips in week five, they check whether the retaining cohort is still retaining rather than panicking and doubling the ad budget. When a feature request arrives from a loud user who churned on day two, they weigh it against what their retained segment actually does. When day 90 arrives and the answer is no, they stop with runway left to try again — which is, in the end, the outcome that separates founders who eventually ship something that works from founders who spent everything proving a single idea wrong.
Almost every app that failed in our experience could have been diagnosed by day 30 and either fixed or stopped by day 60. What killed them was not the failure. It was the three months spent not looking at it.
Frequently Asked Questions
What percentage of apps fail?+
There is no reliable universal figure, and most of the numbers circulating online trace back to a decade-old estimate. What is documented: RevenueCat's analysis of the subscription app market (2026 edition, 2025 data) found only 17.3% of newly launched apps reach $1,000 in monthly revenue within two years, and 4.6% reach $10,000 a month. Those are commercial-success rates rather than failure rates, but they describe the shape of the market honestly.
Why do apps get deleted so quickly after install?+
Because the first session failed to deliver value. AppsFlyer's uninstall report (2025 edition, 2024 data) found 46.1% of Android installs were uninstalled within 30 days in 2024, with the majority of uninstalls occurring on the first day. The common causes are an account wall before value, a slow or crashing first launch, and a store listing that promised something the app does not do.
Is 90 days long enough to judge whether an app is working?+
It is long enough to judge whether anything retains and whether any channel repeats, which are the two questions that matter early. It is not long enough to judge revenue potential or scale. If you have a retaining segment and a repeatable channel at day 90, you have a business worth funding further even if the absolute numbers are small.
Should I fix retention or acquisition first?+
Retention, in almost every case. Acquisition multiplies whatever retention you have, so spending against a curve that reaches zero converts budget into churned users. The exception is when you have so few users that you cannot measure retention meaningfully — then run a small, honest paid test through a legitimate ad network purely to generate a readable curve, not to grow. Do not fill that gap with incentivised or bot installs: that cohort tells you about the traffic rather than the app, and buying installs to move rankings breaches Google Play's device and network abuse policy and Apple's guideline 3.2(b).
Can a bad app launch be recovered?+
Usually yes. Onboarding, pricing, positioning, store creative and channel choice are all reversible. The things that are hard to reverse are a rating average built from a broken launch build, policy strikes against your developer account, and a brand name that has already made a bad first impression on the community you were targeting.
How do technical issues affect app discoverability?+
Directly on Android. Google Play treats a user-perceived ANR rate at or above 0.47% or a user-perceived crash rate at or above 1.09% of daily active users as bad behaviour thresholds, and states that an app exceeding them is likely to be less discoverable on all devices. Exceeding the 8% per-device threshold can also put a warning on your store listing.
When should I stop working on an app instead of iterating?+
When 90 days of a fair test produced no retaining cohort and no repeatable install channel, and the time required for a genuine fix exceeds your remaining runway. Before concluding that, confirm the test was fair: working analytics, a stable build, and users acquired from outside your own network.
Sources
- Apple — 2025 App Store Transparency Report — 9,100,620 submissions reviewed, 2,093,244 rejected, 1,354,418 Performance rejections, 166,899 apps removed, 2,172,472 apps live
- Apple — App Store Review Guidelines — Guideline 2.1 App Completeness and 4.2 Minimum Functionality — the two most common early-stage scope traps
- Android Developers — Crash rate (Android vitals) — User-perceived crash rate bad behaviour thresholds: 1.09% overall, 8% per device model, with discoverability consequences
- Android Developers — ANR rate (Android vitals) — User-perceived ANR rate bad behaviour thresholds: 0.47% overall, 8% per device model
- Android Developers — Target API level requirements — Why a neglected app quietly stops reaching new users on newer devices rather than being removed
- 42matters — Google Play vs Apple App Store store stats — Like-for-like tracker counts: 2,540,581 apps on Google Play against 2,558,519 on the App Store, retrieved 25 August 2026
- RevenueCat — State of Subscription Apps 2026 (2025 data) — 17.3% of new apps reach $1K monthly revenue in two years, 4.6% reach $10K, pre-2020 apps hold 69% of subscription revenue
- AppsFlyer — App uninstall report, 2025 edition (2024 data) — 46.1% of Android installs uninstalled within 30 days in 2024, across 2.2K apps and 1.3 billion installs
About the author
Amol Pomane — Founder, Vmobify
Amol leads Vmobify, a mobile app growth agency that has driven 30M+ downloads and ranked 54K+ keywords across 300+ apps since 2013. He writes about ASO, paid user acquisition, retention, and the operational reality of scaling mobile apps in India and global markets.