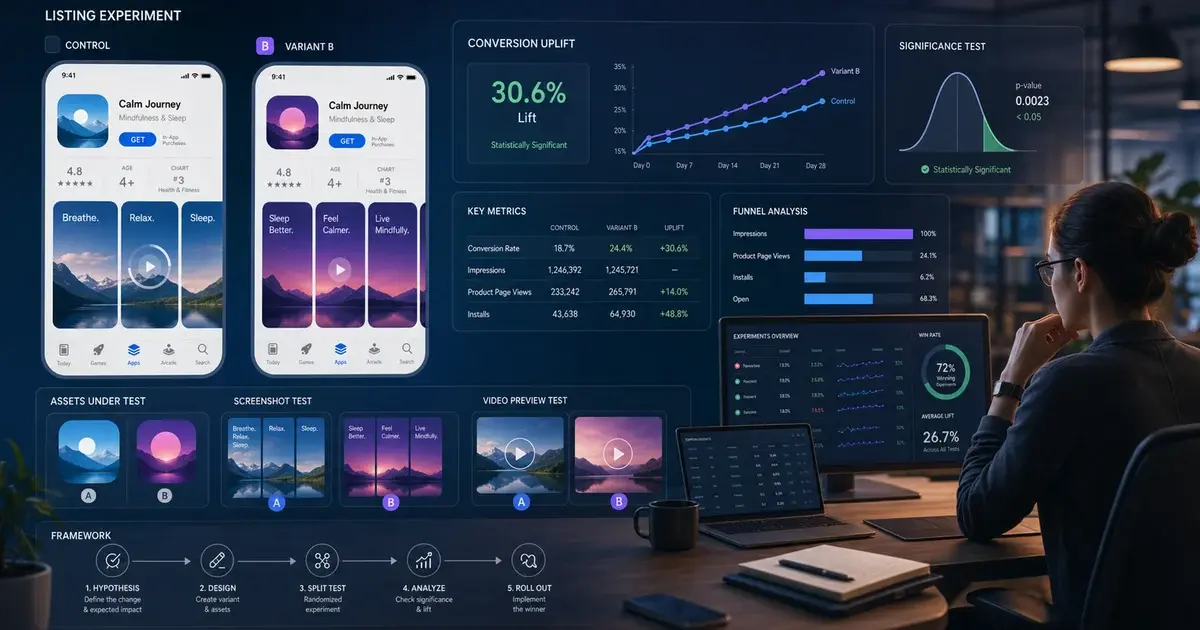
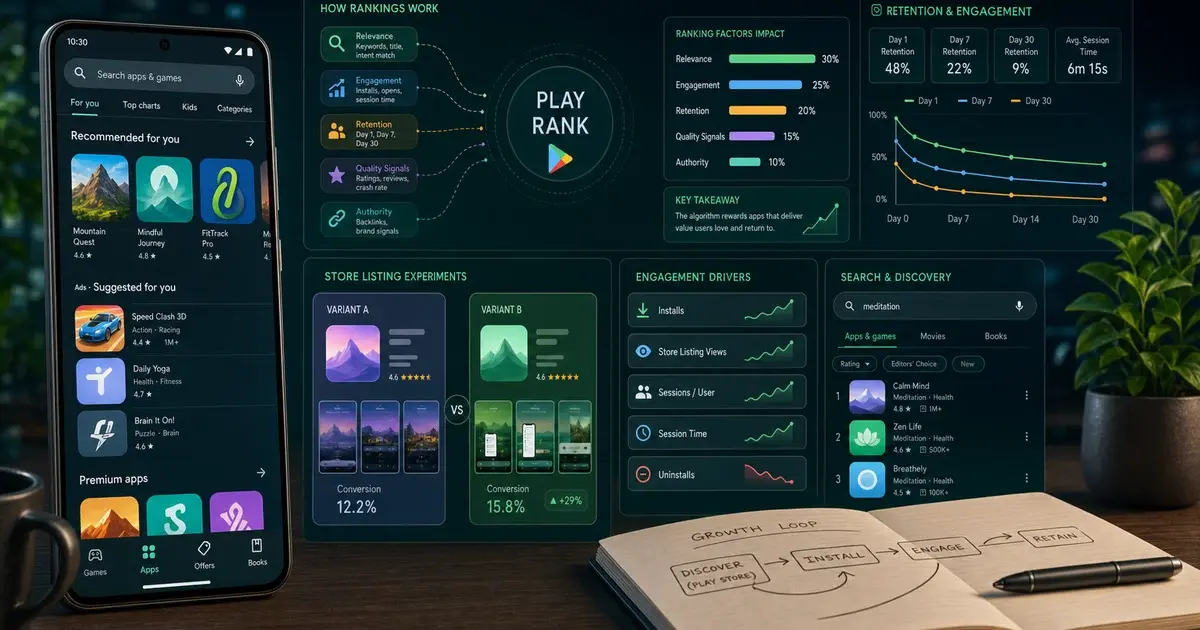
Google Play Store Listing Experiments: A/B Testing That Lifts Installs
Play Console gives you a free A/B testing engine for your store listing, and most teams misread its rules before they run a single test. This is the mechanics guide: what the console will and will not let you test, how the traffic split and the target metric actually behave, and how to read a result that comes back as a draw.

On this page
- What can you actually test in Play Store listing experiments?
- How do you set up an experiment correctly in Play Console?
- How should you split traffic and for how long?
- Why does the target metric decide whether the win is real?
- How do you read an inconclusive experiment result?
- Why do winning variants sometimes lose after you apply them?
- How do you sequence experiments so they compound?
- What cannot be tested this way, and what do you do instead?
- Frequently Asked Questions
What can you actually test in Play Store listing experiments?
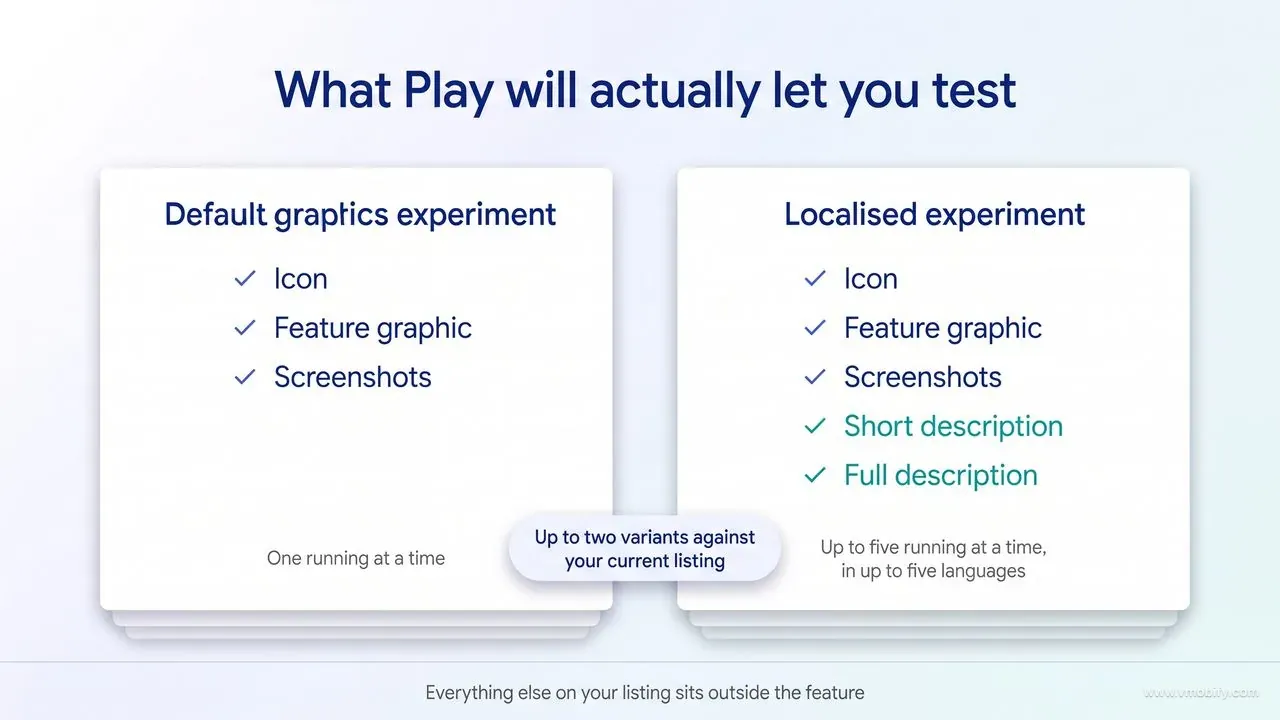
Google Play lets you test your app icon, feature graphic and screenshots in a default graphics experiment, and those same three assets plus your short and full descriptions in a localised experiment — that is the complete list of testable fields. Everything else on your listing sits outside the feature, and knowing that boundary before you plan a test saves the most common wasted month.
This post is the mechanics companion to our ASO A/B testing framework. The framework post covers how to build a hypothesis, how to prioritise a backlog and how much rigour a decision needs. This one covers only the Play Console feature itself — what the tool does, what it refuses to do, and where its behaviour surprises people. If you want the methodology, read that one first; if you want to stop misconfiguring the console, keep reading here.
The Play Console Help documentation on running A/B tests splits experiments into two types, and the split is the source of most confusion:
- Default graphics experiments. These test variants of your icon, feature graphic and screenshots in your app's default store listing language. Google renamed these from "global experiments" — the functionality is unchanged, but a lot of older writing on the topic still uses the old name.
- Localised experiments. These test the icon, feature graphic, screenshots and your app's descriptions, and they run in up to five languages that you select. Variants are only shown to users who are viewing your listing in one of those languages.
Two structural limits follow from that. You can run one default graphics experiment or up to five localised experiments at the same time for a given app, and within any single experiment you can test up to two variants against your current listing. That means your realistic throughput is far lower than most testing backlogs assume, which is why sequencing matters more on Play than on most platforms.
There is one rule inside the default graphics experiment that catches almost everybody, and it deserves to be read twice. If you have uploaded any localised graphic asset in a particular language, users who view your listing in that language are excluded from your default graphics experiment — even if the asset you are testing is a different one. Google's own worked example is a listing whose default language is English with a localised feature graphic in French: French-language viewers are excluded from the experiment even when what you are testing is the icon. Teams with mature localisation programmes routinely run a "global" test that is quietly only reaching a fraction of their traffic, then wonder why the result never reaches significance.
The practical implication for anyone with real localisation coverage: your default graphics experiment measures a narrower and less representative slice of your audience than the name suggests. Check which languages carry localised graphics before you plan the test, not after the result lands.
One more prerequisite. You cannot set up an experiment against a store listing that has not been fully rolled out. If the option is greyed out, the console prompts you to complete the rollout of the listing first. Across the 300+ apps we have managed since 2013, that single greyed-out button has cost more launch-week testing time than any statistical problem — teams plan a test for launch day and discover the listing has to land first. Our store screenshots guide covers what to put in the baseline so that first listing is worth testing against.
How do you set up an experiment correctly in Play Console?
You start an experiment from Grow users, then Store presence, then Store listings, and click Set up in the Experiment column for the listing you want to test — everything after that is five decisions in the visible flow, plus four more behind an advanced settings panel most people never open.
The flow itself is short:
- You name the experiment in 50 characters or fewer, which is for your reference only and never shown to users.
- You choose the experiment type — a graphics test on the default listing, or a test on a localised listing with the languages selected.
- You pick a target metric.
- Then you choose which asset you are testing, upload the variants, review and save, and finally submit the change through the publishing overview.
That last step is worth naming explicitly because it surprises people: experiment variants go through the publishing flow. They are creative assets appearing on a live Play listing, so they are subject to the same store listing policy rules as your production assets. A screenshot variant that advertises a discount, claims a ranking such as "#1", or overlays award badges will fail on policy grounds regardless of how well it converts. Build the policy check into your creative brief rather than discovering it at submission.
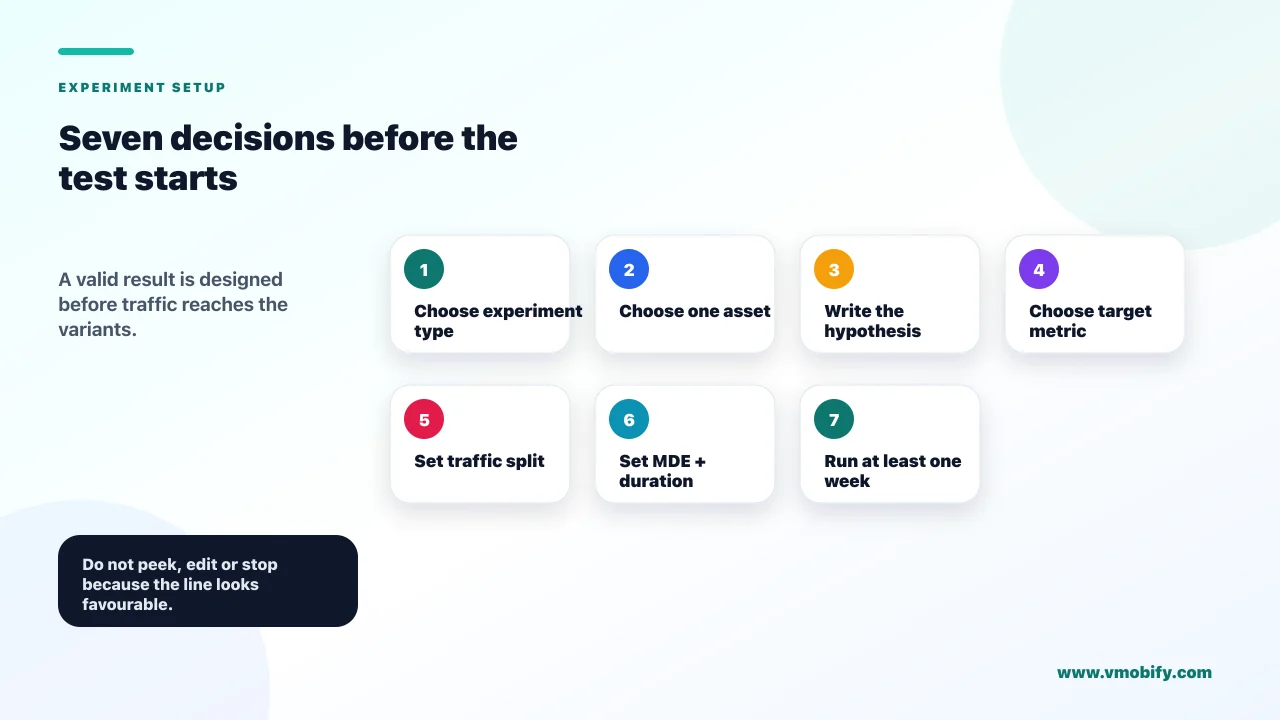
The console gives you a genuinely useful piece of help at setup: the creation page estimates the time and the volume of acquisitions, opens or pre-registrations your experiment will need to produce a statistically significant result. Read that estimate before you commit. If the console tells you the test needs longer than you are willing to wait, the honest responses are to widen the minimum detectable effect, raise the audience percentage, or pick a bolder variant — not to run it anyway and stop it early when the numbers look good.
Inside advanced settings you can adjust four things, and each one trades speed against certainty:
- Number of variants. Up to two experimental variants against your current listing. Two variants split your experiment audience in half, so a two-variant test needs materially more traffic than a one-variant test to resolve.
- Experiment audience percentage. The share of store listing visitors who see an experimental variant instead of the current listing. Those visitors are split equally across your variants.
- Minimum detectable effect. The smallest difference between a variant and the control that the console will call a winner. Anything smaller is reported as a draw.
- Confidence level. How often the confidence interval the experiment reports will contain the true performance of the listing. Raising it lowers your false-positive rate and lengthens the test.
Google's guidance is that the defaults give you a result in the shortest time with reasonable accuracy, and that changing them will usually make the experiment run longer before it becomes useful. We agree with that as a starting position. The one setting worth touching early is the minimum detectable effect, and usually in the direction of making it larger rather than smaller — a small app chasing a 1% lift will never resolve the test, while the same app can comfortably detect the size of swing that a genuinely different icon direction produces rather than a colour tweak.
Google also recommends testing one asset at a time, which is the single most important discipline in the whole feature. Change the icon and three screenshots together and a winning variant tells you nothing you can reuse. Keep the change atomic and the result becomes a piece of knowledge rather than a coin flip. The Asset Library helps here — its "Used in" filter shows which assets are currently being tested in an experiment, which is how you avoid the classic mistake of quietly editing an asset that is mid-test.
How should you split traffic and for how long?
Play recommends a minimum duration but does not enforce one — its best-practice page asks you to test for at least a week, while the only limit the console actually applies is the six-month auto-stop — so the discipline of honouring that week is entirely yours. The gap between advice and enforcement is the feature's biggest trap, because nothing in the console stops you from applying a winner after 36 hours.
Google's own best-practice guidance on the Play Console store listing experiments page is to test for at least a week to account for weekday versus weekend traffic patterns. That is the right floor and we would treat it as a hard rule rather than advice, because the console will not treat it as either. Play Store install behaviour is strongly weekly: the mix of browsing versus searching, the device mix, and the intent level of the average visitor all shift between a Tuesday morning and a Saturday afternoon. A test that ran Monday to Thursday measured one kind of user.
On the traffic split itself, the mechanics are simple and the judgement is not. The experiment audience percentage sets how many of your listing visitors see a variant rather than the control, and those visitors are divided equally between your variants. So a 40% audience with two variants means 20% of visitors see variant A, 20% see variant B, and 60% continue to see your current listing.
How to choose that number:
- Low-traffic apps should go high. If your listing sees a few thousand visitors a week, a 20% audience will not resolve anything before the six-month auto-stop. Push the audience percentage up and accept that more of your traffic is exposed to an unproven variant.
- High-traffic apps should go low. Once you have serious volume, a small audience percentage reaches significance quickly and limits your downside if a variant is meaningfully worse. There is a real cost to showing a losing listing to half your traffic for two weeks.
- Do not change the split mid-test. Reallocating traffic partway through mixes two differently-weighted samples and makes the result harder to trust than it looks.
- Prefer one variant when traffic is tight. Two variants halve the data behind each one. Testing one bold alternative usually beats testing two timid ones.
The six-month auto-completion behaviour is worth understanding precisely because it is silent. When an experiment hits that limit, no new data is collected, no variant is applied, and traffic reverts to your current listing. The experiment stays visible in the console with whatever data it gathered. Nothing is lost, but nothing is decided either. If you have an experiment that has been running for months without resolving, the console is telling you the effect you are chasing is smaller than your minimum detectable effect, and the fix is a bolder variant rather than more patience.
Two other timing habits are worth building. First, turn on experiment notifications from the Notifications page in Play Console so a completed result reaches you by email instead of waiting for someone to open the console. Second, avoid starting a test in a week when something else is changing — a feature release, a seasonal peak, a burst of paid spend. Our comparison of app A/B testing tools covers what to do when the store-level feature is not enough, but the cleanest test is still the one that ran during an ordinary week.
In our portfolio, the teams that get the most out of this feature all made the same unglamorous change: they stopped treating an experiment as a thing you check daily and started treating it as a thing you start on a Monday and read the following Monday at the earliest.
Why does the target metric decide whether the win is real?
Play Console gives you three target metrics — unique user install clicks, unique user open clicks and unique user pre-registration clicks — and only two of them measure the moment of decision. Open clicks, despite the shared "clicks" label, counts installed users who opened your app, which makes it the one quality signal the feature offers you.
The definitions matter, because they are narrower than the labels suggest:
- Unique user install clicks: the number of users who installed your app and did not already have it installed on any of their other devices at the time.
- Unique user open clicks: the number of installed users who opened your app.
- Unique user pre-registration clicks: the number of users who pre-registered for your app.
Read the middle definition again, because the shared label hides a real difference in what each metric can tell you. Install clicks and pre-registration clicks both record a decision taken on the store listing itself, so an experiment targeting either can confirm that a variant won the moment of decision and nothing beyond it. Open clicks sits a step past the install: it counts users who already have the app and then launched it, which is the only point at which the feature looks at behaviour after the listing has finished its job. Choosing between them is therefore a choice about how much of the funnel you are willing to wait for.
Install clicks is the default choice and the right one for most tests, but it is also the metric most vulnerable to the oldest failure mode in store creative: a variant that oversells. A screenshot set that implies features you do not have, a feature graphic that suggests a different genre, an icon that borrows visual language from a better-known app — all of these can reliably lift install clicks and reliably damage everything downstream. The experiment will call it a winner. It will still be a bad change.
Open clicks is the closest thing the feature offers to a quality guard, and it is under-used. Choosing it as the target metric asks a harder question than "did more people tap install?" — it asks whether the users your creative attracted actually launched the app. For any test where a variant makes a bolder promise than the control, that is the more honest question. It will take longer to resolve, because it sits one conversion step further down the funnel, and the console's estimator will tell you as much at setup.
Now the correction worth making carefully, because a lot of published guidance on this feature is out of date. Google's own product marketing page for the feature still describes seeing "acquisition and 1-day retention rates" for each version of your listing. The current Play Console Help documentation lists only the three target metrics above, and none of them is a retention rate. The two pages disagree, and we are not going to guess at what that means for the console's internal reporting. What we can say is what to do about it: check retention yourself, in the report that is designed for it.
That report is the acquisition data under Play Console's acquisition and retention measurement, where retained installers is defined as unique users who visited your store listing, installed your app, and kept it installed for up to 30 days. Read the definition literally, because it is weaker than it sounds: Google states plainly that installation does not mean the app was opened over that period. A retained installer is a user who has not uninstalled, not a user who is active.
The workflow that follows is simple and almost nobody runs it. Before you apply a winning variant, record your current first-time installer and retained installer figures. Apply the variant. Come back four to six weeks later and compare. If install clicks rose 12% and retained installers rose 12%, the creative found more of the right people. If install clicks rose 12% and retained installers barely moved, the creative found more of the wrong people, and you have bought yourself a worse cohort at a better conversion rate. The same report also shows how your conversion rate compares against a peer group of similar apps using the same monetisation model, which is a useful sanity check on whether the number you just improved was ever the problem.
How do you read an inconclusive experiment result?
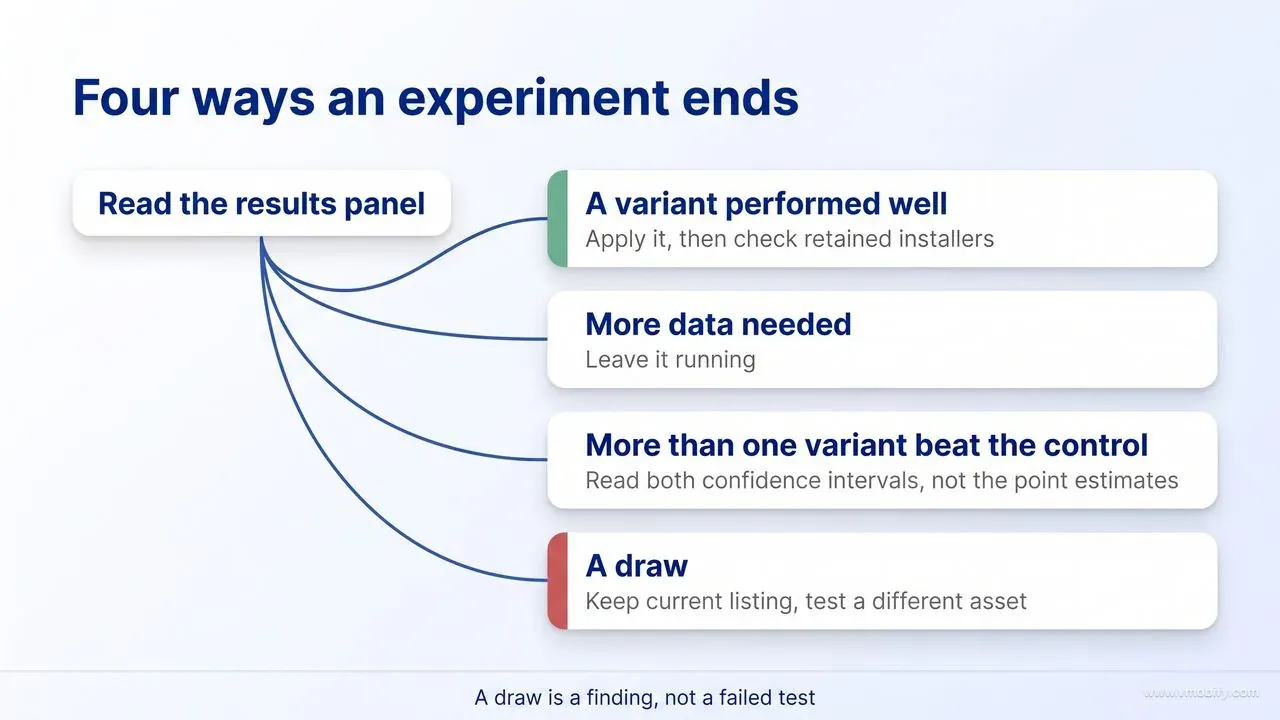
Play reports two kinds of non-result, and they mean opposite things: "more data needed" means the experiment has not gathered enough traffic to decide, while a draw means it decided that the difference between your variants was smaller than the minimum detectable effect you set. Conflating those two is how teams end up either abandoning a good test or re-running a settled one.
The results panel shows which option performed best or better than your current listing, an explanation grounded in the confidence interval and your minimum detectable effect, and a recommended action where one applies. Your next move depends on which of four outcomes you are looking at:
- A variant performed well. You will typically see a recommendation to apply it. Do the downstream check described in the previous section before you treat the lift as banked.
- More data needed. Come back later. Google says the console will advise you when a result is expected in less than a week, which is a genuinely useful signal. Read its absence literally, though: it tells you more than a week of further data is still needed, not that the test will never separate.
- More than one variant beat the control. The console hands the decision back to you. Read both confidence intervals rather than picking the higher point estimate, and prefer the variant whose creative direction you can reuse across other assets.
- A draw. Neither variant differed from the control by more than your minimum detectable effect. Note that Google groups this with the case above: on a draw the console still opens the apply path and asks you to decide which variant you want to apply. This is a real finding, not a failed test.
A draw deserves more respect than it gets. It tells you that the asset you changed is not currently a constraint on your conversion rate at the magnitude you cared about, which means the next test should move to a different asset rather than iterate on the same one. Across the ASO programmes in our portfolio, the single most common waste pattern is a team that draws on a screenshot test and responds by testing a fourth screenshot variant, when the draw was evidence that screenshots were not the bottleneck that month.
The word "inconclusive" also gets used loosely for a third situation that is neither of Play's two outcomes: a result you do not believe. That usually comes from one of three causes, and all three are avoidable:
- You changed more than one thing. A variant with a new icon and new screenshots produces a result you cannot attribute or reuse.
- Something else moved during the window. A feature release, a press mention, a spike in paid traffic or a seasonal peak all change the composition of your listing visitors mid-test.
- You looked early and acted on it. Peeking at a running experiment and stopping when the line is favourable is the fastest way to convert noise into a decision. The console's estimator exists precisely so you can set expectations at setup and then leave it alone.
One procedural note, because Google's instruction and our advice diverge here and it is worth being explicit about which is which. The documentation reserves Keep current listing for the case where your current listing performed best. On a draw, or where more than one variant beat the control, it tells you instead to review the results and decide which variant you want to apply — so the console leaves the apply path open and hands the judgement back to you.
Our editorial position is that on a genuine draw you should decline that offer. The whole point of setting a minimum detectable effect at setup was to state, in advance, how big a difference would be worth acting on; applying a variant that failed to clear it is overriding your own decision rule after seeing the data. So when you have nothing to act on, click Keep current listing anyway, write down what you learned about the size of the effect, and spend the next slot on a bolder hypothesis. That is Vmobify's recommendation rather than Google's instruction, and you should hold it only as long as your minimum detectable effect was set honestly in the first place. A backlog structured so that a draw feeds the next test, rather than stalling the programme, is what separates a testing habit from a testing calendar.
Why do winning variants sometimes lose after you apply them?
A variant that wins in an experiment and then fails in production is almost always a measurement artefact rather than a mystery, and four causes account for nearly all of them: an unrepresentative experiment audience, a changed traffic mix, an effect that was real but smaller than it looked, and a novelty response that faded.
Start with the audience, because on Play it is the most under-appreciated cause. Your experiment ran against store listing visitors, and specifically against the subset of them that the experiment type allowed. If it was a default graphics experiment and you have localised graphics anywhere, every user viewing your listing in those languages was excluded from the test — and then included the moment you applied the winner. You measured on one population and shipped to a wider one.
Localised experiments carry a related but distinct version of the same risk, and it is worth stating precisely because the mechanics are not the same. A localised variant is only ever shown to users viewing your listing in the languages you selected, and applying the winner updates those localised listings rather than your listing as a whole — so the evidence and the change stay matched to each other. The mistake is what teams do next: taking a creative direction that won in five languages and rolling it out to the twenty you did not test, on the strength of a result that says nothing about them. That is extrapolation rather than measurement, and it fails most often where the tested languages share a market context that the untested ones do not.
Then the traffic mix. Play Console's acquisition reporting separates organic Play Store traffic from Google Ads traffic, from tagged UTM links, from third-party referrers, and from a category it calls installs without a store listing visit — users who installed without ever seeing your listing. Your experiment can only influence people who saw the listing. If your channel mix shifts between the test window and the following month — a campaign starts, a burst of PR lands, a seasonal peak brings in browsers rather than searchers — your applied listing is serving a different audience than the one that voted for it.
Third, the size of the effect. A confidence interval is a range, not a promise. A variant reported as roughly 8% better may have a true effect anywhere across a band, and the point estimate you remember is the most flattering number in it. This is why a variant that "won by 3%" so often produces no visible change in the monthly numbers: the win was real, and it was also smaller than your month-to-month variance. Set the minimum detectable effect at a level where a win would actually matter to the business, and this problem mostly disappears.
Fourth, novelty. This one is genuinely hard to separate on Play, and harder than the usual advice admits. The documentation says only that your experiment audience is a percentage of store listing visitors, which includes people who have seen your listing before — so you cannot assume the clean new-visitor sample that would rule a novelty response out. In our experience the pattern that actually recurs is not novelty in the textbook sense but a distinctive variant winning on differentiation within a specific competitive context that then changes. A competitor's icon redesign, a category-wide seasonal creative shift, or a change in how your app is surfaced can all erode an advantage that was relative rather than absolute. This is why Google's own guidance is to revisit assets over time to account for changes in users, locations and seasonality, and why a listing tested once in 2024 is not a listing that has been tested.
There is a fifth cause that is entirely self-inflicted and worth naming: applying several winners at once. When a screenshot winner and an icon winner from two different periods go live in the same release, their interaction is untested. Two assets that each won on their own can pull in different directions when combined — a bolder icon and a bolder first screenshot together can read as a different app. Apply changes one at a time, with enough gap to see the effect, and keep an eye on how they sit alongside the ranking signals covered in our Google Play algorithm guide, since conversion rate is not the only thing your listing feeds.
How do you sequence experiments so they compound?
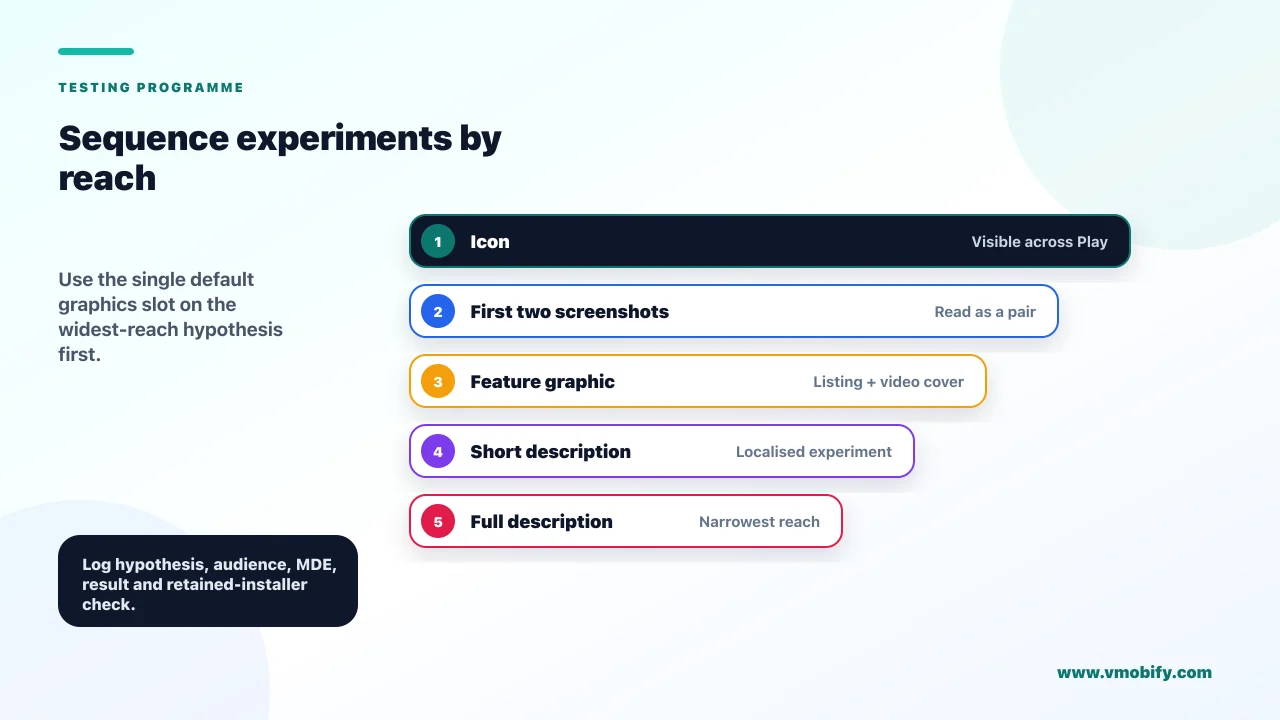
Because Play allows only one default graphics experiment at a time, sequencing is not an optimisation of your testing programme — it is the programme, and the correct order runs from the assets with the widest reach to the ones with the narrowest.
Reach is the right sorting key because the same conversion lift is worth more on an asset that appears in more places. Your icon appears in search results, in top charts and on your listing. Your first two screenshots appear above the fold on the listing and, at certain sizes, in recommendation surfaces across Play. Your full description is read by a small and self-selecting minority. Testing in that order means your early wins apply to the largest share of impressions.
The order we use across the ASO programmes in our portfolio:
- Icon first. It is a single 512 by 512 pixel asset, it is the cheapest thing to produce variants of, and it is visible wherever your app is. It is also the asset where a genuinely different direction — not a colour tweak — produces effects large enough to resolve quickly.
- The first two screenshots second. These carry the message that most visitors actually see. Google requires a minimum of two screenshots across device types to publish and allows up to eight per device type. Eligibility for the recommendation formats that display screenshots in large layouts is a separate and stricter requirement rather than a suggestion, and it differs by app type: at least four screenshots at a minimum of 1080px for apps, or at least three 16:9 landscape screenshots at 1920x1080 or three 9:16 portrait screenshots at 1080x1920 for games. The two developer results cited at the end of this section both come from games studios, so check which of those thresholds applies to you before you assume the app number. Test the first two as a pair, because they are read as a pair.
- Feature graphic third. It sits above your screenshots and doubles as the cover image for your preview video where one exists, so it is doing more work than its position suggests.
- Short description fourth, via a localised experiment. Eighty characters, shown before the full description, and the only text field you can put into an experiment other than the full description itself.
- Full description last. Four thousand characters that most visitors never expand. Worth testing eventually, worth testing after everything above.
Now use the concurrency rule deliberately rather than accidentally. You get one default graphics slot or five localised slots — so spend the default graphics slot on your single highest-reach hypothesis, and use localised slots when your question is about markets rather than about creative direction. A localised experiment across five languages answering the same creative question in five places produces five independent readings, which is often a stronger signal than one default test that a localisation exclusion has quietly narrowed.
Compounding also requires a written record, because the console will not build one for you. Keep a simple log with the asset tested, the hypothesis, the target metric, the audience percentage, the minimum detectable effect, the result, and the retained-installer check four weeks later. After six or eight cycles that log becomes the actual asset: you stop testing creative directions you have already disproved, and new team members inherit the knowledge instead of re-running old tests. The Asset Library's tagging supports this reasonably well — tag variants by hypothesis rather than by date.
One caution on ambition. Google's marketing page for the feature cites developer results including Tapps Games increasing installs by more than 20% and Kongregate increasing installs by 45% through store listing experiments. Those are real published outcomes and they are also the top of the distribution. A mature listing that has already been tested several times will produce smaller increments, and a programme built on the expectation of a 45% win will be abandoned after three draws. Plan for a series of single-digit gains that hold, and treat anything larger as a bonus.
What cannot be tested this way, and what do you do instead?
Your app title, your category, your pricing, your ratings and your developer name are all outside the experiment feature entirely — and the single most valuable of those omissions, the app title, has a workaround in custom store listings rather than in experiments.
Take them in turn. The app title is limited to 30 characters and is one of the strongest signals in both conversion and discovery, yet it does not appear in either experiment type's asset list. Custom store listings, by contrast, let you customise the app's name, icon, descriptions and graphic assets for a targeted segment. Creating one is not itself an A/B test — there is no control group and no significance calculation — but it does let you put a differently-worded title in front of a defined audience and compare the resulting acquisition data yourself.
One clarification that a lot of writing on this feature gets wrong, including some of ours in earlier drafts: a custom store listing and a store listing experiment are not mutually exclusive. Google's documentation states that you can run experiments for your default and your custom store listings, alongside the localised ones. So a custom listing is a targeting surface that can also be the subject of a test — you can build a listing for, say, your paid-search traffic and then experiment on its screenshots the same way you would on the default. What does not change is the asset list: the app title is outside the testable fields on a custom listing exactly as it is on the default one, so the title comparison remains a manual read of acquisition data rather than a significance-tested result.
The preview video sits in an awkward place. Play Console's own marketing page recommends testing icons, videos and screenshots for the biggest impact, while the current Help Center documentation lists icon, feature graphic and screenshots for default graphics experiments, and those three plus descriptions for localised experiments. The two pages do not agree, and we are not going to assert a capability we cannot confirm from the documentation. Check what the asset selection step actually offers in your console before you brief a video variant — and note that a preview video is added as a single YouTube URL, which constrains how variants could work in any case.
For everything else the feature cannot reach, custom store listings are the tool. You can create up to 50 custom store listing pages and target them by country or region, by search keyword, by ads traffic, by pre-registration status, by custom audiences you define, and by lifecycle segments Play defines for you — churned users who uninstalled, lapsed users who have not opened the app in 28 days, non-buyers, one-time buyers, repeat buyers, and lapsed buyers who have not purchased in 180 days. A custom listing is also reachable through its own URL parameter, which makes it the right destination for a campaign landing experience rather than a generic listing.
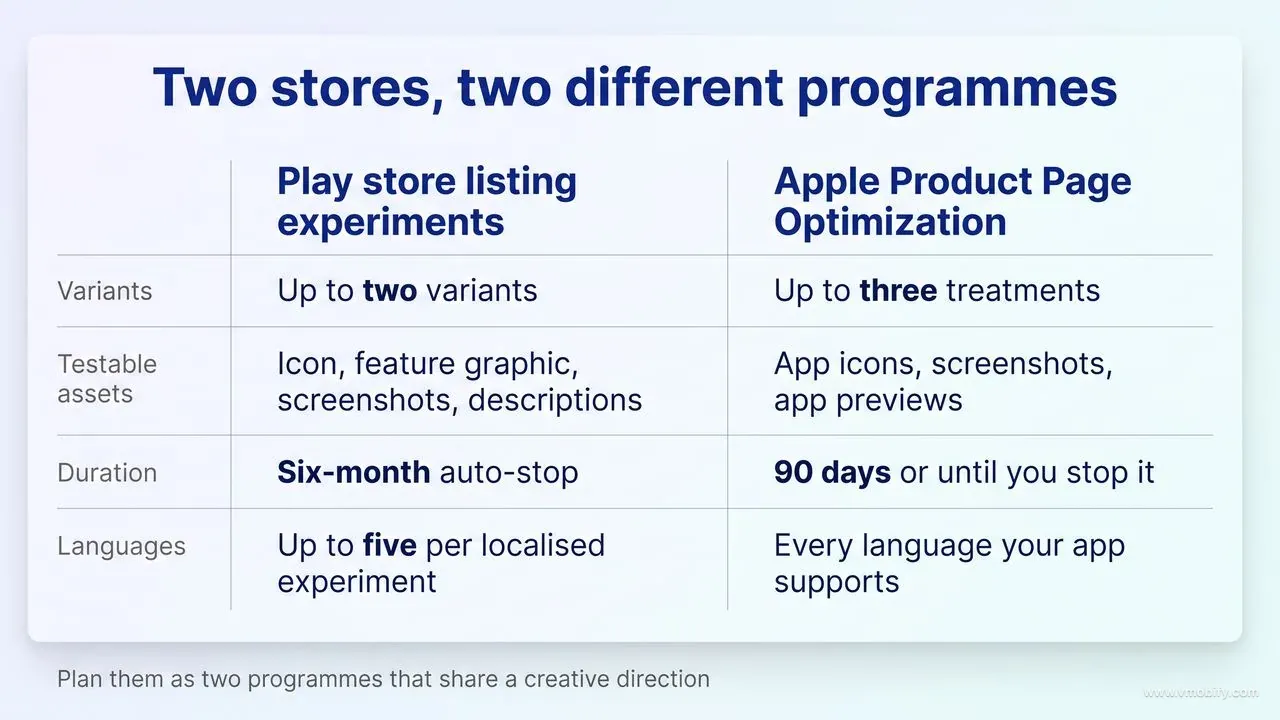
The iOS contrast is worth understanding if you run both platforms, because the systems are genuinely different rather than differently-named. Apple's equivalent is Product Page Optimization, and its shape differs on every axis that matters: a test can include up to three treatments against your original page rather than two, it covers app icons, screenshots and app previews rather than text, it runs for 90 days or until you stop it rather than six months, each treatment can be localised across every language your app supports, and the dashboard reports impressions, conversion rate, percentage improvement and confidence level against your chosen baseline. The nearest iOS analogue to a Play custom store listing is a different feature again, and our guide to App Store custom product pages covers where those two sit relative to each other.
The practical consequence is that you cannot run one creative testing calendar across both stores. The variant counts differ, the testable fields differ, the durations differ, and the text fields that Play will test are not testable on iOS at all. Plan them as two programmes that share a creative direction rather than one programme with two outputs. If you would rather hand the whole cycle — hypothesis, variant production, console configuration, and the retained-installer check afterwards — to a team that runs it every week, that is what our ASO service does.
Frequently Asked Questions
How many variants can you test in a Google Play store listing experiment?+
Up to two experimental variants against your current store listing. Your experiment audience percentage is split equally between them, so each variant is backed by only half the experiment audience and a two-variant test needs materially more traffic than a one-variant test to resolve.
Can you test your app title with store listing experiments?+
No. The testable assets are the icon, feature graphic and screenshots in a default graphics experiment, plus your short and full descriptions in a localised experiment. The app title, which is limited to 30 characters, is not among them. Custom store listings do let you customise the app name for a targeted segment, though that is a targeting tool rather than a controlled test.
How long should a Play Store listing experiment run?+
Google recommends at least a week so the result covers both weekday and weekend traffic patterns, but it does not enforce that floor — nothing in the console prevents you applying a winner after a day. The only limit the console applies is that experiments stop automatically after six months, at which point traffic reverts to your current listing and no variant is applied.
What does a draw mean in a store listing experiment?+
It means the difference between your variants and the control was smaller than the minimum detectable effect you set at setup. That is a genuine finding rather than a failure: it tells you the asset you changed is not constraining your conversion rate at the size you cared about, so the next test should move to a different asset.
Why are some users excluded from a default graphics experiment?+
If you have uploaded any localised graphic asset in a given language, users viewing your listing in that language are excluded from default graphics experiments — even when the asset you are testing is a different one. Teams with broad localisation coverage often test on a much narrower audience than they expect.
Does Play measure retention in store listing experiments?+
Not directly. The current Play Console Help documentation lists three target metrics: unique user install clicks, unique user open clicks and unique user pre-registration clicks. None of them is a retention rate — open clicks is the closest, and it counts installed users who opened your app rather than users who kept it. Retained installers lives in the separate acquisition report, where it counts users who kept the app installed for up to 30 days — and Google notes explicitly that this does not mean the app was opened. Check that report yourself four to six weeks after applying a winner.
How does this compare with A/B testing on the App Store?+
Apple Product Page Optimization allows up to three treatments rather than two, covers app icons, screenshots and app previews rather than text, runs for 90 days or until you stop it, and can be localised into every language your app supports. The two systems are different enough that you should plan them as separate programmes sharing a creative direction.
Sources
- Play Console Help — Run A/B tests on your store listing — Primary source: experiment types, the two-variant limit, target metrics, advanced settings and six-month auto-completion
- Google Play Console — Store listing experiments — Google best practices, including the one-week minimum and published developer results
- Play Console Help — Create custom store listings — The 50-listing limit, the full targeting segment list, and what each custom listing can customise
- Play Console Help — Add preview assets to showcase your app — Asset specifications: icon, feature graphic, screenshot counts and preview video rules
- Play Console Help — Best practices for your store listing — Policy rules that experiment variants must also satisfy, plus title and description character limits
- Play Console Help — Measure your app acquisition and retention — Definitions of first-time installers, retained installers and the acquisition channel breakdown
- Play Console Help — Asset Library — Managing and tagging experiment graphics, including the filter showing which assets are mid-test
- Apple Developer — Product Page Optimization — The iOS equivalent: three treatments, 90-day duration, icons, screenshots and app previews
About the author
Amol Pomane — Founder, Vmobify
Amol leads Vmobify, a mobile app growth agency that has driven 30M+ downloads and ranked 54K+ keywords across 300+ apps since 2013. He writes about ASO, paid user acquisition, retention, and the operational reality of scaling mobile apps in India and global markets.