ASO A/B Testing: The Framework We Use to Lift Conversion 30%+
ASO A/B testing sounds simple — it is full of statistical traps that produce false winners. Here is the framework we use to test smarter and lift conversion 30%+ reliably.

Why does ASO A/B testing need a framework?
Without a framework, ASO testing produces noise dressed up as insight — a graveyard of one-off tests with no through-line, declared winners that do not hold in production, and a slow drift toward worse store conversion than where you started. We have audited hundreds of test logs across our 300+ apps and the same four pathologies show up almost every time.
- Random variants: Tests get launched because someone in the team has an opinion, not because a hypothesis is on the table. You learn nothing transferable from a win.
- False positives declared early: Teams check tests daily and stop the moment a green number appears. The result is a parade of "winners" that revert when shipped.
- Low-impact element obsession: Teams test description body copy or screenshot 5 while the icon and first screenshot — the two elements that actually move the needle — go untouched for two years.
- Forgotten history: The same test gets re-run 18 months later by a new growth lead, with no record of what was already learned.
A framework fixes all four. It forces you to pick the high-leverage element first, write down the hypothesis, pre-commit to a duration and significance bar, and store the result somewhere a future team member will actually find it. Apple's own Custom Product Pages documentation and Google's Play launch best practices both push developers toward structured experimentation for a reason — unstructured testing on store listings is more likely to hurt than help.
The framework below is what we run on every ASO engagement. It has driven 30%+ install-rate lifts on dozens of apps in our portfolio, including titles where the previous team had run 40+ tests without a sustained gain. The change is not better creative — it is testing discipline.
One more reason a framework matters: testing capacity is rate-limited. Apple's Product Page Optimization caps you at one active test at a time per app, and Google Play Experiments has practical concurrency limits driven by traffic. If your annual testing budget is 20-30 tests, picking the wrong ones to run is more expensive than running them badly. The framework exists to make sure the tests you do run are the ones with the highest expected information value, in the right order, with the right success criteria. Skip any of that and you waste a year of testing slots that you cannot get back.
What should you test first?
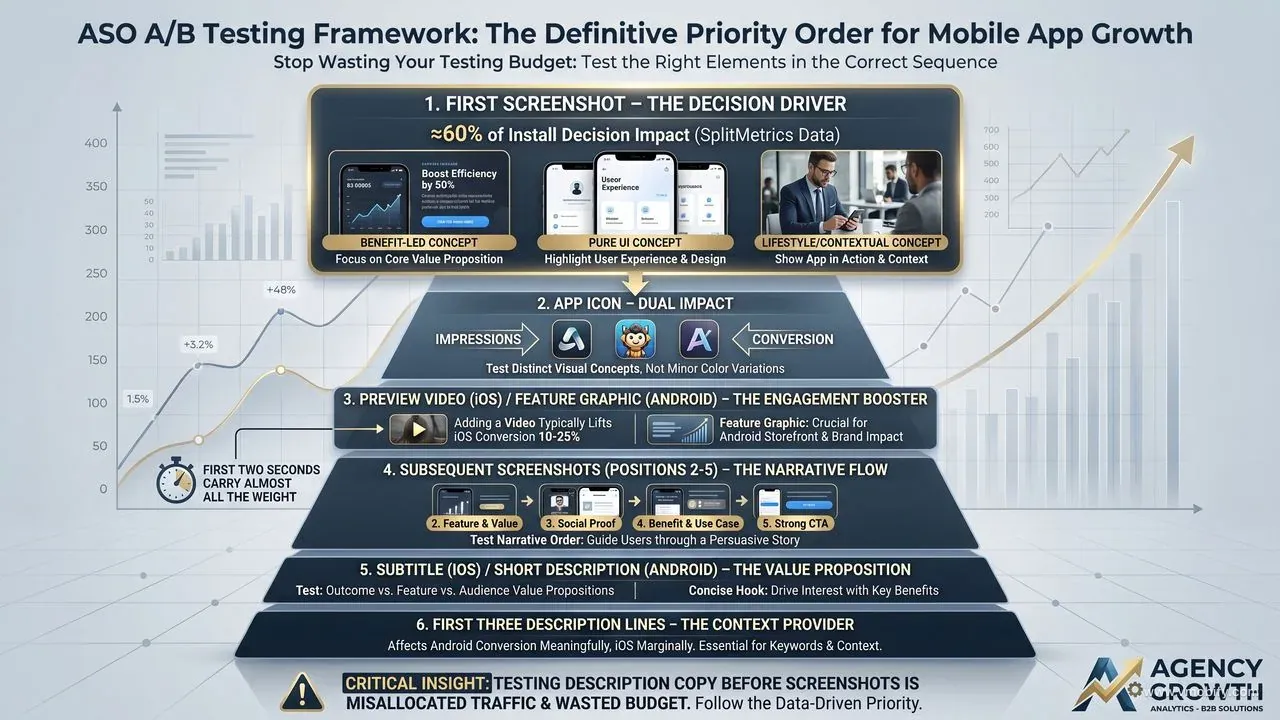
Test in descending order of impact: first screenshot, then icon, then preview video, then subsequent screenshots, then subtitle, then the first three description lines. Reversing this order — testing description copy before screenshots, for example — is the most common reason teams spend a year experimenting and never crack a meaningful conversion lift.
- 1. First screenshot. Drives roughly 60% of the install decision per SplitMetrics' aggregated A/B test data across thousands of apps. Test three genuinely different concepts: benefit-led copy over a hero UI, pure UI with no overlay, and lifestyle/contextual imagery. Subtle pixel-pushing here is the wrong test.
- 2. App icon. Affects both impressions (whether users tap your search result in the first place) and conversion (whether they progress to install). Test two to three distinct visual concepts — not minor colour variations. A new icon also resets ageing-creative fatigue, which is itself measurable in our portfolio.
- 3. Preview video (iOS) or feature graphic (Android). Adding a video to an iOS listing typically lifts conversion 10-25%. The first two seconds carry almost all the weight; everything after is a tax.
- 4. Subsequent screenshots (positions 2-5). Test the narrative order: feature focus, social proof, benefit, use case, CTA. Reordering existing screenshots without redesigning them is one of the cheapest 5-10% lifts available.
- 5. Subtitle (iOS) or short description (Android). Test three distinct value propositions — outcome ("Lose 5kg in 12 weeks"), feature ("AI-powered meal plans"), audience ("For runners over 40").
- 6. First three description lines. The lines visible without expanding. Affects conversion meaningfully on Android, marginally on iOS.
Notice what is not on the list: description body copy, keyword field, screenshot 6+, in-app event blurb. These all have second-order effects, but testing them before the top of the list is misallocated traffic. Once you have a winning first screenshot, icon, and preview, then revisit the lower-priority elements. We cover this sequencing in our complete ASO guide alongside the keyword research that feeds the metadata side.
Which A/B testing tools should you use?
Start with the native tools — App Store Connect Product Page Optimization on iOS and Google Play Console Store Listing Experiments on Android — and only reach for third-party tools when you need to validate a concept before committing to a store-listing test. The native tools are free, run on the real audience, and produce results that hold in production. Third-party paid-traffic tools are faster but biased.
- App Store Connect Product Page Optimization (PPO): Apple's native A/B test. Runs on a portion of real store traffic. Tests icon (via the Default Product Page), screenshots, and preview video. Limited to three treatment variants plus the control. Documented in the App Store Connect developer resources. The 90-day maximum test duration is generous; the bigger constraint is daily traffic volume on lower-volume apps.
- Google Play Console Store Listing Experiments: Google's native A/B test. Tests icon, screenshots, feature graphic, video, and description. Up to five variants. The statistical engine is robust — Google reports confidence intervals natively and recommends a decision once a 90% confidence threshold is hit (we hold for 95%).
- SplitMetrics, StoreMaven, SearchAdsHQ: Third-party tools that drive paid traffic to recreated store-listing pages. Faster than native because you control traffic volume. Useful for concept screening — narrowing six creative directions down to two before running the survivor pair as a native test. Not a substitute for native tests when shipping.
- Apple Search Ads creative tests: Test multiple ASA creative sets against each other. Useful for two reasons — ASA creative learnings often transfer to organic listing creative, and the data volume on a high-spend ASA account is materially larger than PPO traffic on the same app.
The most common tooling mistake is running third-party paid-traffic tests as if the results will hold organically. They usually do not. A creative that wins on Instagram-sourced paid traffic does not necessarily win on App Store search traffic, because the audience intent and pre-context are different. Use third-party tools for hypothesis generation, native tools for the binding decision.
A second under-used tool: Apple's Apple Search Ads custom product pages. By assigning different Custom Product Pages to different ASA keyword groups, you can run creative tests at much higher volume than PPO permits, and the data feeds back into your organic listing decisions. Apps in our portfolio spending ₹5L+/month on ASA effectively get a free A/B testing engine on top of their paid spend — most teams never use it that way. We cover the ASA-to-organic feedback loop in our Apple Search Ads strategy guide.
How do you design a test that actually works?
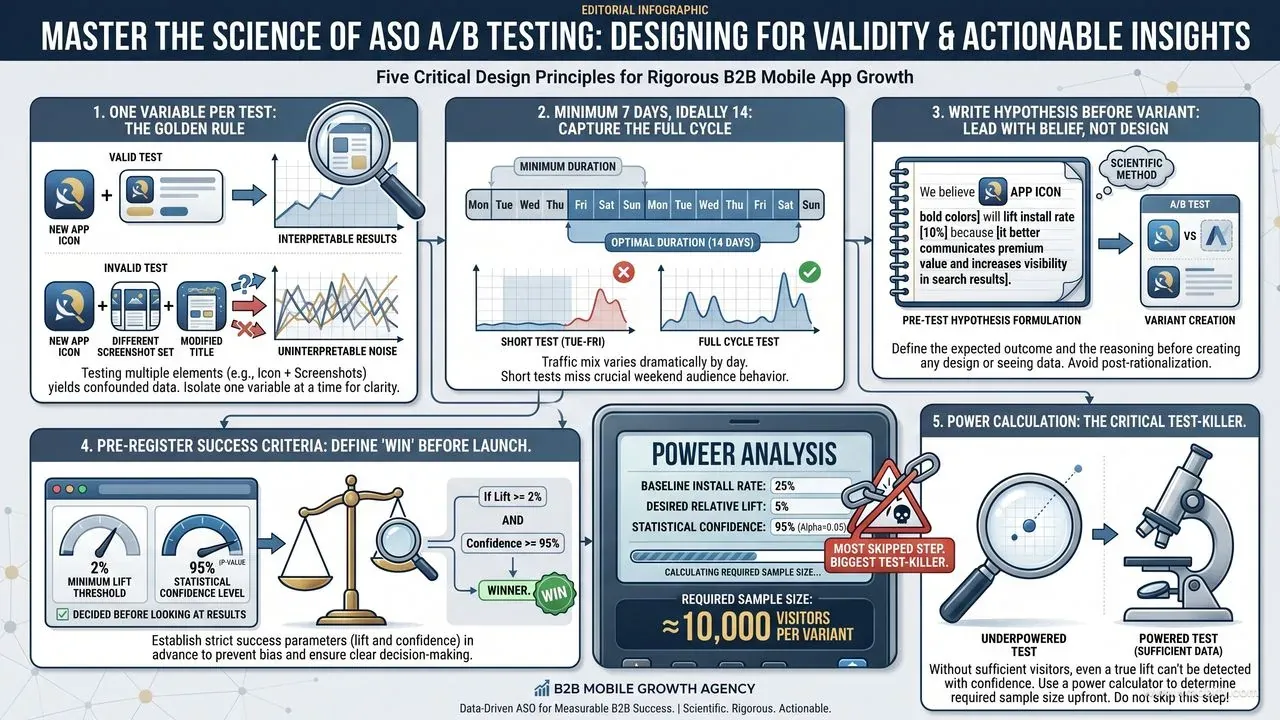
A good test answers exactly one question, runs long enough to clear weekly cycles, and has its success criteria written down before the first visitor lands on either variant. Skip any of those three and you are running a vanity exercise.
- One variable per test. Testing icon plus first screenshot simultaneously produces uninterpretable results — you have no idea which change drove the lift, so nothing transfers to the next test. Two single-variable tests beat one multi-variable test for the same total traffic.
- Minimum seven days, ideally 14. Day-of-week traffic mix varies dramatically. A Tuesday-to-Friday test misses your weekend audience entirely. Below seven days you are reading noise; below 14 you are exposed to novelty effects (see common mistakes).
- Hypothesis before variant. Write the sentence: "We believe a benefit-led first screenshot showing the outcome will lift install rate 10%+ versus the current feature-led screenshot, because cost-conscious users prefer outcome language." Now you have something to learn from whether you win or lose.
- Pre-register success criteria. What lift level and what statistical confidence equal a winner? "5% relative lift at 95% confidence" or "any positive lift at 90% confidence on a low-traffic app." Decide before looking at results. The temptation to move the bar after seeing the data is what produces false-positive ships.
- Run a power calculation. If your baseline install rate is 25% and you want to detect a 5% relative lift (so 26.25%) at 80% power with 95% confidence, you need roughly 10,000 visitors per variant. If your store listing gets 3,000 visitors per week, your test will run for over three weeks — plan for it or pick a bigger expected effect to test.
The power-calculation step is the one teams skip most often, and it is the one that quietly kills the most tests. Without it you are guessing how long to run, which usually means stopping too early. AppsFlyer's State of App Marketing data shows median app listings see well under the traffic needed to detect a 3% lift — so you have to design tests for bigger effects, or accept a longer runway.
How much statistical rigour do you really need?
Enough to stop yourself from shipping noise — which means confidence intervals on every reading, 95%+ confidence before declaring a winner, no peeking, and Bayesian methods on low-traffic apps where frequentist tests will never converge. This is the single biggest source of bad ASO conclusions across the industry.
- Confidence intervals, not point estimates. "Variant B at 28% versus control at 25%" tells you nothing on its own. "Variant B at 28% [95% CI: 26-30%] versus control at 25% [95% CI: 23-27%]" tells you the intervals overlap and the test is inconclusive. Always read the interval, never the point.
- 95% confidence minimum before shipping. 80-90% confidence is "directionally interesting, worth a sharper retest." It is not a ship decision. Google Play Experiments will sometimes surface a "winner" at 90% — we hold for 95% before pushing it live.
- Beware the sequential testing fallacy. Checking results every day and stopping at the first significant result inflates your false-positive rate from 5% to 30%+. This is not a small effect. Pre-commit to test duration and only read the result at the planned end date, or use sequential-testing-corrected methods (Google Play does this internally; many third-party tools do not).
- Bayesian methods for low-traffic apps. Frequentist tests need a fixed sample size and either accept or reject a null hypothesis. Bayesian tests give you a probability that B is better than A, updating continuously as data arrives. For apps with under 1,000 store visitors per week per variant, Bayesian is more honest about what you can and cannot conclude.
The teams in our portfolio who consistently win at ASO testing share one trait — they have an explicit "we do not stop tests early, ever" rule, written down, with someone responsible for enforcing it. Removing the human ability to peek-and-stop is worth more than any creative innovation.
One practical pattern that helps: blind the daily dashboard. Send the test owner a single end-of-test report rather than live access to the result. It sounds extreme; it eliminates the entire class of false-positive ships caused by sequential peeking. The same pattern is standard in clinical trials and increasingly in mature growth teams. If that feels too heavy-handed, the lighter version is requiring a written sign-off from a second team member before any early stop — that single check kills most premature ship decisions.
How do you interpret ASO test results correctly?
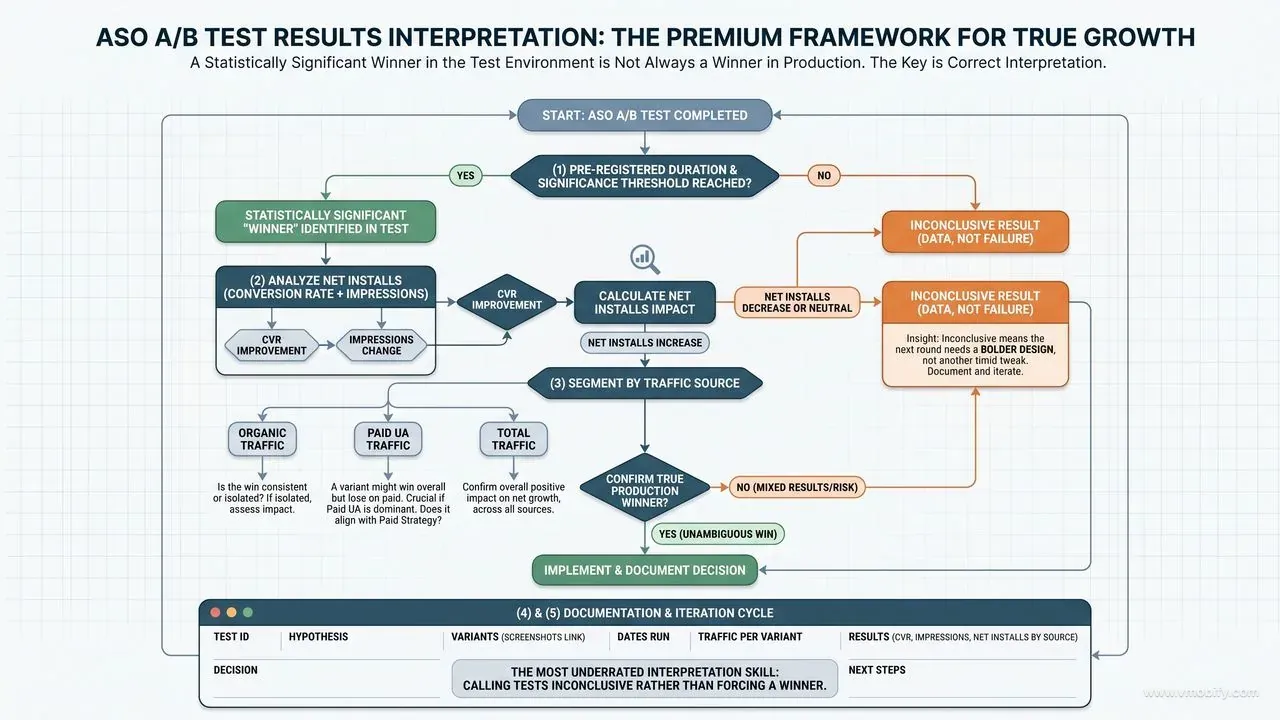
A statistically significant winner in the test environment is not always a winner in production — interpret every result by checking conversion against impressions, segmenting by traffic source, and documenting the test for whoever runs the next round.
- Winner does not mean ship. A 3% lift at 95% confidence on a 500,000-visitors-per-week app is a real, shippable result. A 3% lift at 95% confidence on a 5,000-visitors-per-week app is more likely to be a tail event than a true effect — even with the right statistics. Triangulate against intuition and the size of the underlying creative change.
- Look at conversion and impressions together. A variant might convert better but get fewer impressions because the store algorithm de-ranked it for some reason (icon similarity to a flagged app, for example). Net installs is what matters, not conversion rate alone. We have seen "winning" icons that delivered fewer total installs because impressions cratered.
- Segment by traffic source where you can. A variant might win overall but lose on paid traffic specifically — which matters a lot if your paid UA is the dominant install channel. Play Console Experiments expose this segmentation; PPO does not, so on iOS you may need to validate paid winners separately via Apple Search Ads creative tests.
- Document every test in a shared log. Hypothesis, variants, dates, traffic per variant, result, decision, screenshots of the creative. We use a simple Notion table — others use Google Sheets — but the format matters less than the discipline. Tests get re-run 18 months later under different assumptions, and the only thing that prevents wasted effort is a searchable history.
The single most underrated interpretation skill is calling tests inconclusive. Inconclusive is data. It tells you the variant is not different enough from the control to move the metric, which means the next round needs a bolder design — not another timid tweak in the same direction. We see real progress in our portfolio when teams start treating inconclusive results as actionable rather than as failures.
What are the most common ASO testing mistakes?
The five mistakes below account for the majority of bad ASO test outcomes we see when auditing growth teams' historical work — every one of them is preventable with the framework above.
- Stopping tests early on initial significance. The most common, most damaging mistake. Inflates false-positive rate from 5% to 30%+. Cure: pre-commit to test duration in writing, with a teammate responsible for enforcement.
- Testing on weekends only or weekdays only. Atypical traffic mix produces results that do not generalise. Always run tests across at least one full Monday-to-Sunday cycle, ideally two.
- Testing during a release, promotion, or external event. Extraordinary traffic distorts both variants asymmetrically. If your app got a TechCrunch mention mid-test, restart the test once traffic normalises — do not try to interpret through the spike.
- Variant differences too subtle to detect. If the design difference between variants is less than 10% of the visible canvas, the test will almost never produce statistical significance. Subtle pixel pushing belongs in design polish, not A/B tests. Test genuinely different concepts.
- Ignoring the novelty effect. New designs often outperform initially because they are new, then revert to baseline. A two-week minimum protects against this on most apps; for apps with strong returning-visitor traffic to the listing, extend to three weeks. The same dynamic shows up in our App Store algorithm analysis — freshness signals decay quickly.
The meta-mistake behind all five is treating ASO testing as a marketing activity rather than an experimental discipline. The teams that get it right borrow rigour from product analytics and data science — explicit hypotheses, power calculations, pre-registered thresholds, no peeking, documented results. None of this is exotic; it is just unfamiliar to most marketing teams. If you want a framework built and operated for you, talk to our team — we run testing programmes for clients ranging from pre-seed apps to top-50 category leaders, and the operating system is the same.
Frequently Asked Questions
How many tests can I run simultaneously?+
Two non-overlapping tests on different assets — for example an icon test on iOS and a first-screenshot test on Android. More than that creates interference. Otherwise, run sequentially.
How much traffic do I need for reliable A/B tests?+
Roughly 1,000+ unique store visitors per variant per week is the practical minimum for reasonably-powered tests. Below that, use directional Bayesian readings rather than frequentist significance decisions.
Should I A/B test icon and screenshots together?+
No — single-variable tests only. The interaction effects between icon and screenshots are real, but you cannot isolate them in typical store-listing traffic volumes. Test icon, ship the winner, then test screenshots on the new baseline.
What if results are inconclusive after the test runs?+
Inconclusive is data. It tells you the proposed change is not big enough to move the metric. Keep the control, design a bolder variant for the next round. Treat inconclusive as a prompt to think bigger, not as a failure.
Do native store A/B tests give the same results as paid-traffic tools?+
Not reliably. Native tests reflect the actual organic + paid audience that will see your listing in production. Paid-traffic tools test against a curated paid audience that is rarely a perfect match. Use third-party tools to screen concepts; use native tools to make ship decisions.
How long should an ASO A/B test run?+
Minimum seven days to clear day-of-week effects, ideally 14 days to clear novelty effects. Lower-traffic apps may need three weeks or more to hit statistical significance — run a power calculation up front so you know.
Why do my winners not hold when I ship them?+
Almost always one of three causes: you stopped the test early on initial significance, the test ran during an atypical traffic period, or the variant only won on a sub-segment that does not match your post-test traffic mix. The framework in this article addresses all three.
Sources
- SplitMetrics — First Screenshot Conversion Data — Aggregated A/B test data showing the first screenshot drives ~60% of install decisions
- Apple — Custom Product Pages — Apple documentation on alternative product page variants used alongside PPO testing
- App Store Connect Developer Resources — Official documentation including Product Page Optimization setup and limits
- Google Play — Launch Best Practices — Google guidance on structured experimentation for Play store listings
- AppsFlyer — State of App Marketing — Benchmark data on store listing traffic volumes and conversion rates by category
- StoreMaven ASO research — Industry research on creative testing methodology and result interpretation
- AppTweak ASO blog — ASO benchmarks and testing case studies across categories
About the author
Amol Pomane — Founder, Vmobify
Amol leads Vmobify, a mobile app growth agency that has driven 30M+ downloads and ranked 54K+ keywords across 300+ apps since 2013. He writes about ASO, paid user acquisition, retention, and the operational reality of scaling mobile apps in India and global markets.
Free Growth Audit
See exactly how to scale your app with 13+ years of expertise behind you.
Get My Strategy

