App Marketing Budget: How Much Should You Spend in Year 1?
The single most common founder question we get is "how much should I budget for marketing?" Here are honest year-1 budget benchmarks by stage and vertical for India.
How should you think about app marketing budget?
Marketing budget is a derived number, not an arbitrary one — it falls out of your install goal, your category CPI, your expected paid-to-organic ratio, and your remaining runway. Pulling a number from a competitor's deck or a "industry average" article is the most common way founders torch their first year.
The four inputs that actually determine the right number:
- What goal are you funding? 10K installs to test product-market fit is a fundamentally different exercise from 1M installs to dominate a category. The first is a learning budget; the second is a scale budget. Conflating them produces either over-spending on validation or under-spending on growth.
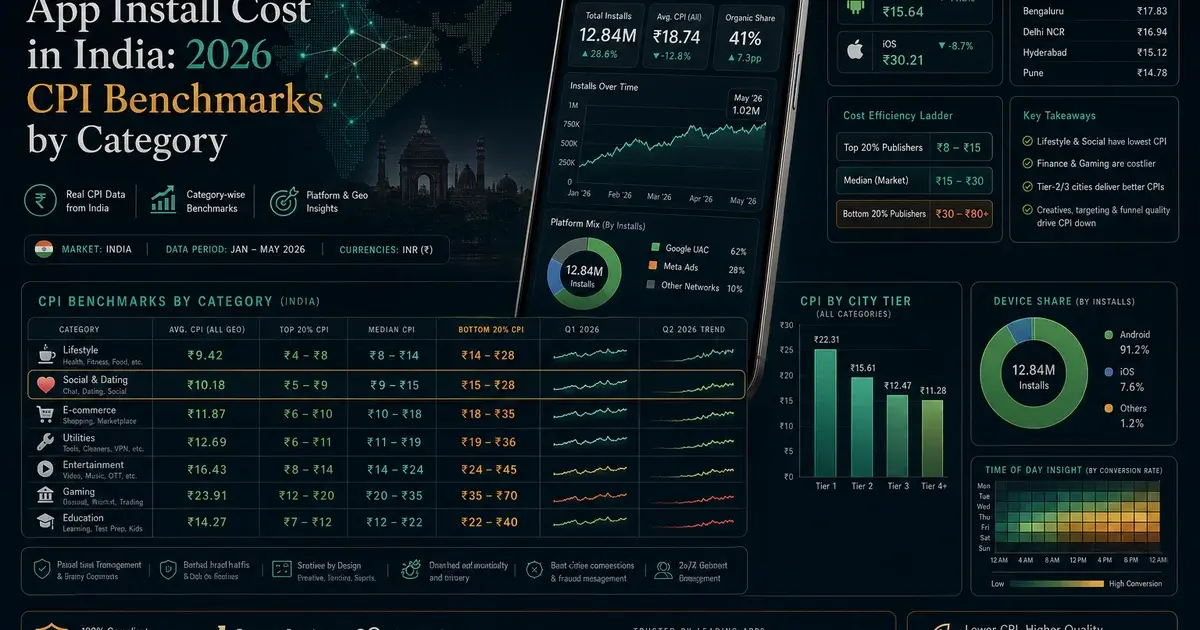
- What is your category CPI? Verticals span a 20x range. Hyper-casual games run ₹8-15 per install in India; fintech and insurance routinely run ₹150-400. AppsFlyer's Performance Index publishes quarterly CPI bands by vertical and geography — use it as your starting multiplier, not a US benchmark scaled by a guess.
- What ratio of paid to organic do you expect? Apps with strong organic engines (utilities with sharp keyword targeting, viral consumer apps, brand-driven launches) typically run 30-50% paid. Apps with weak organic — most fintech, most insurance, most niche B2B — run 70-90% paid. Modelling the wrong ratio inflates or deflates your budget by 2-3x.
- What is your runway? Burning 18 months of runway in 6 months of UA is reckless even when the unit economics work, because shocks happen — a creative fatigue cycle, a policy change on a key channel, a competitor entry. We have seen this exact pattern kill funded apps in our portfolio across 300+ apps managed since 2013.
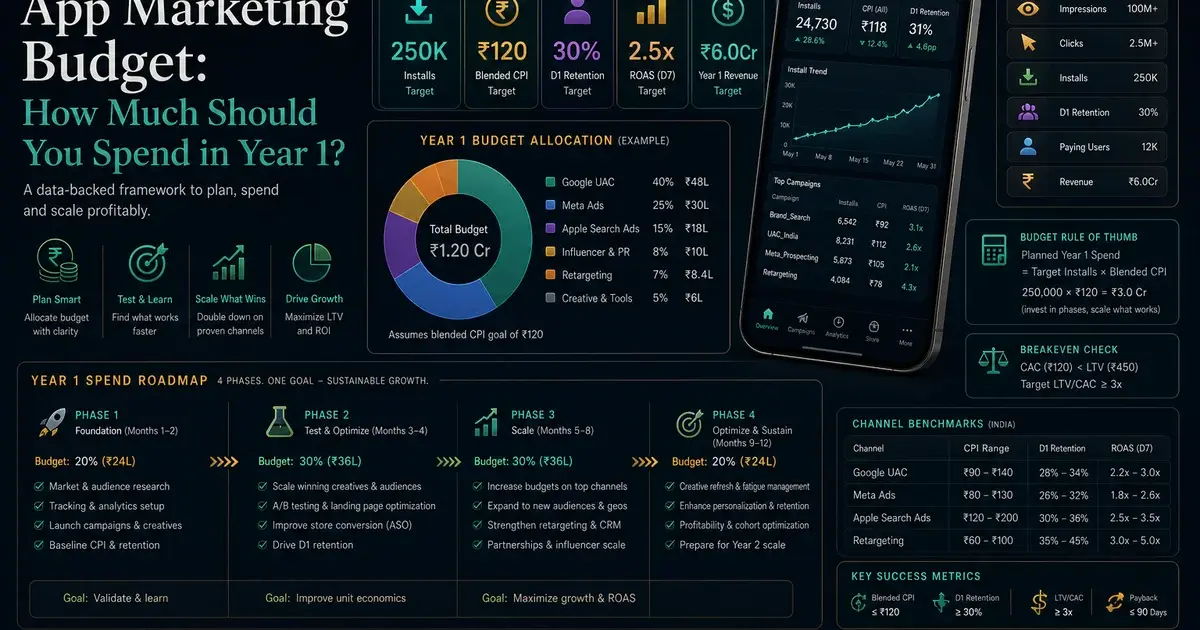
The formula we use with portfolio clients: Budget = (Target paid installs × Realistic CPI × 1.2 contingency) + Creative cost + Tools + Agency / team cost. The 1.2 contingency is non-negotiable. CPIs drift up in every category quarter-on-quarter as auctions get more competitive — AppsFlyer's State of App Marketing reports have documented this consistently for the last five years.
Once the formula gives you a number, sanity-check it against runway: if year-1 marketing exceeds 50% of total cash on hand and you do not have a Series A within 12 months, scale the goal down rather than the budget up. Cash dies faster than ambition recovers.
What should you budget by stage in year 1?
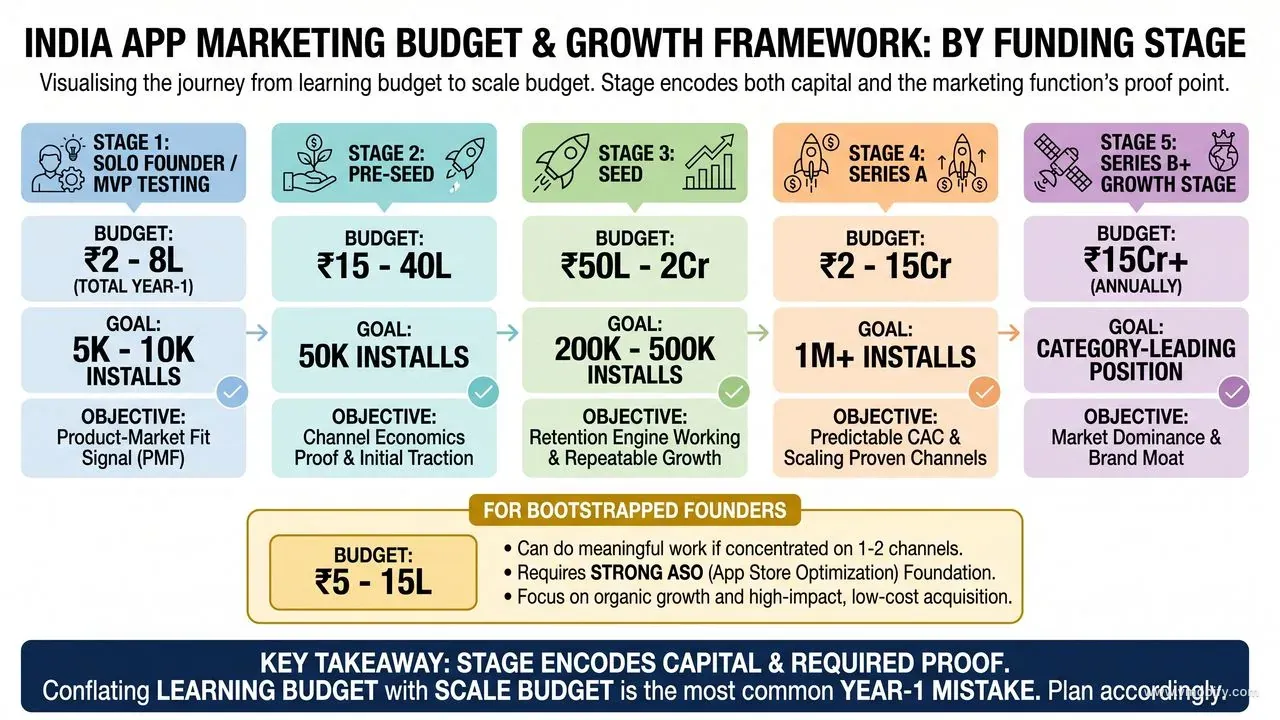
Stage is the single strongest predictor of the right year-1 marketing budget — because stage encodes both how much capital is available and what the marketing function is actually being asked to prove. The bands below are what we see working across our portfolio, calibrated to India 2026 CPIs:
- Solo founder / MVP testing — ₹2-8L total year-1 marketing budget. Goal: 5-10K installs, find a retention signal, validate the concept. Spend split: 60% paid (mostly Meta + light UAC), 30% creative, 10% tools. The output is not scale — it is a retention-curve dataset that tells you whether the product is worth scaling.
- Pre-seed startup — ₹15-40L total. Goal: 50K installs, basic monetisation validation, prep narrative for seed round. The marketing function here is proving channel economics, not scale. Two or three channels tested properly beats five channels tested badly.
- Seed-stage startup — ₹50L-2Cr total. Goal: 200K-500K installs, channel mix proven, retention engine working. This is the band where dedicated user acquisition infrastructure starts mattering — MMP, creative production pipeline, structured A/B testing. Below this budget you can fake the infrastructure; above it you cannot.
- Series A startup — ₹2-15Cr total. Goal: 1M+ installs, scaled channel mix across UAC, Meta, programmatic, and CPI; geographic expansion beyond initial market. The defining shift at Series A is moving from "can we acquire users?" to "can we acquire users predictably at a known CAC?"
- Funded growth-stage (Series B+) — ₹15Cr+ annually. Goal: category-leading position, defensive moat against new entrants, brand-level recall. Above ₹15Cr, share-of-voice considerations and brand marketing start mattering as much as direct-response performance.
For founders bootstrapping without VC funding the calculus is different: prioritise organic plus low-budget paid experiments, and accept a slower install ramp. Bootstrapped year-1 marketing budgets of ₹5-15L can produce meaningful learning if disciplined — concentrated on 1-2 channels, with a strong ASO foundation reducing paid dependency. The trap is trying to behave like a funded competitor on a bootstrapped budget; the math does not work and the runway evaporates.
Across our portfolio, the apps that get the stage-budget match wrong split into two failure modes: under-spending teams who never generate enough data to learn anything (and abandon channels prematurely), and over-spending teams who scale before product-market fit and burn 9 months of runway on users who churn. Both are recoverable; neither is cheap.
What does 100K installs cost by vertical in India?
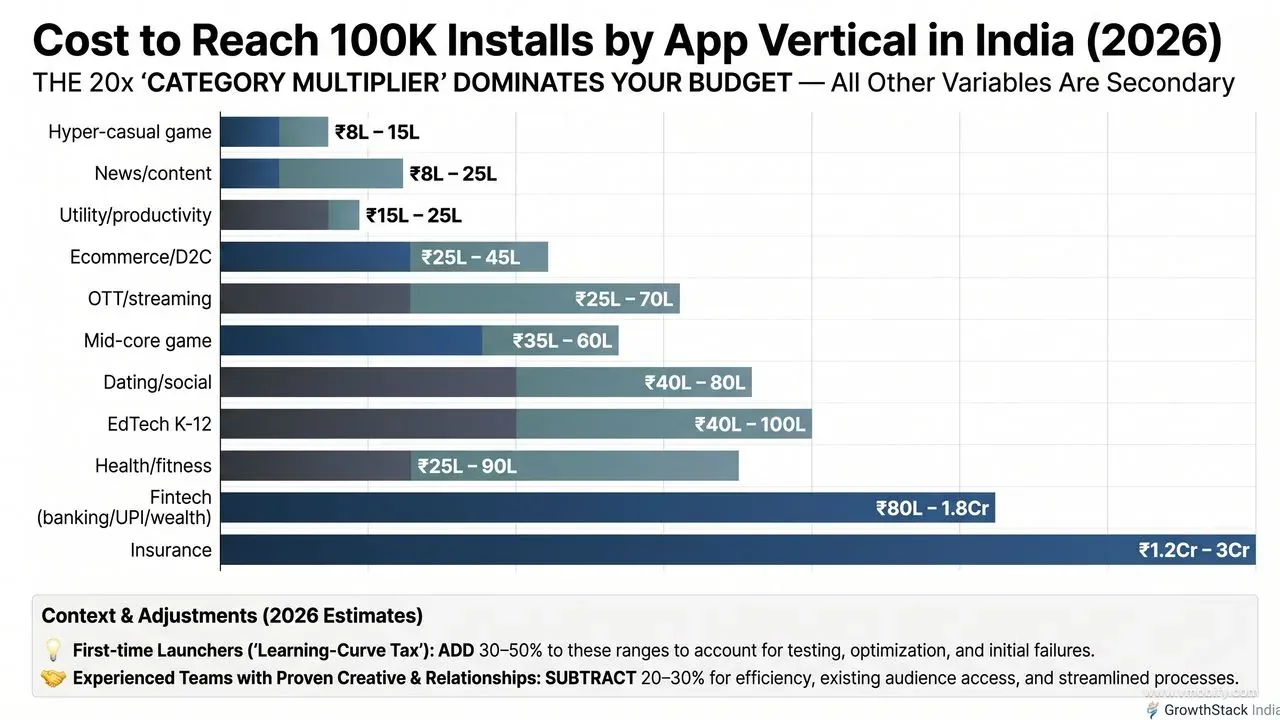
Vertical determines the per-install multiplier — and the multiplier varies by 20x or more across categories. The same 100K installs that costs ₹8-15L for a hyper-casual game costs ₹1.2-3Cr for an insurance app, because the auction density, intent signal, and acceptable CPI ceiling differ that dramatically. Year-1 budgets to land 100K real installs in India, by vertical:
- Hyper-casual game: ₹8-15L. Cheapest install economics on the planet right now. Cross-promotion, rewarded video inventory, and low CPI ceilings make this the most efficient vertical to acquire in.
- Mid-core game: ₹35-60L. Higher production values demand higher quality traffic; payer-targeting lookalikes raise effective CPI.
- Utility / productivity: ₹15-25L. ASO does heavy lifting here; well-optimised utility apps can hit 40-60% organic install share, dropping the paid budget proportionally.
- Ecommerce / D2C: ₹25-45L. Meta Advantage+ and Google Shopping integration drive scale; creative refresh cadence is the bottleneck more often than CPI.
- EdTech (K-12): ₹40-100L. High intent + high CPI; Sensor Tower category data shows EdTech CPIs in India rose 35-50% from 2023-2025 as competition intensified.
- Health / fitness: ₹25-90L. Wide band because subscription health apps cost far more to acquire than free fitness trackers.
- Fintech (banking, UPI, wealth): ₹80L-1.8Cr. Heavily regulated, expensive to acquire, but extremely high LTV when targeting works. SEBI advertising rules add compliance friction that further raises effective CPI.
- Insurance: ₹1.2-3Cr. The highest CPI vertical in India, with strict IRDAI advertising restrictions limiting creative latitude and pushing brands into expensive channels.
- Dating / social: ₹40-80L. Network-effect economics; cold-start budgets must concentrate geographically to reach critical user density.
- News / content: ₹8-25L. Cheap to acquire, hard to retain — budget the install number conservatively because retention determines whether the spend was useful.
- OTT / streaming: ₹25-70L. Bursty around content launches; sustained baseline spend underperforms event-driven spikes.
Add 30-50% to these numbers for first-time launchers (the learning-curve tax is real and unavoidable). Subtract 20-30% for experienced teams with creative inventory and channel relationships already built. For category-specific CPI deep-dives see our India CPI benchmark guide.
One pattern worth flagging from our portfolio: founders consistently underestimate the vertical multiplier on their first app and over-estimate it on subsequent apps. The first underestimation comes from "this category looks easy"; the second over-estimation from scar tissue. The actual numbers above are conservative-realistic for 2026 — neither optimistic nor pessimistic.
How should you allocate within the budget?
The defensible year-1 allocation across most verticals puts 50-65% of budget into paid media, 15-25% into creative production, 5-10% each into ASO and influencer/PR, 3-7% into MMP and analytics, and 10-20% into agency or in-house team cost. The exact split shifts with vertical, but the bands are remarkably stable across our portfolio:
- Paid media spend: 50-65% of total. Across Google App Campaigns, Meta Advantage+, TikTok, CPI networks, and programmatic. This is the actual purchase of installs — under-allocating here means under-investing in the function the budget exists to serve.
- Creative production: 15-25%. Video production, UGC, motion graphics, A/B test asset variation. Creative is the bottleneck of paid scaling — campaigns die on creative fatigue long before they die on audience exhaustion. Apps under-invest here at their own cost; we routinely see paid CPI fall 30-50% within 48 hours of a breakthrough creative going live.
- ASO + organic tools: 5-10%. AppTweak / Sensor Tower / data.ai subscriptions, Apple Search Ads management, and ASO production work. Small line item, oversized return — well-executed ASO drops effective paid CPI by improving store-page conversion across every campaign.
- MMP + analytics: 3-7%. AppsFlyer / Adjust / Singular for attribution, plus the in-product analytics platform. Below this allocation you cannot measure what is working; above it you are paying for capability you will not use in year 1.
- Influencer / PR: 5-10%. Especially for India launches with regional creator partnerships. Statista's India influencer market data shows the segment growing 25%+ year-over-year, with creator CPMs still well below platform CPMs for the right category match.
- Agency / team: 10-20%. Either internal marketing salary or agency fees. Below 10% you cannot afford senior judgement; above 20% you are spending on overhead at the expense of media.
Three allocation mistakes we see repeatedly in our portfolio: under-investing in creative (campaigns plateau within weeks), skipping the MMP line item to save 5% (and then making channel decisions on platform-reported data, which always inflates), and over-paying for tools whose features you will not use until Series A. Audit the line items quarterly and rebalance as the program matures.
When should you scale spend up?
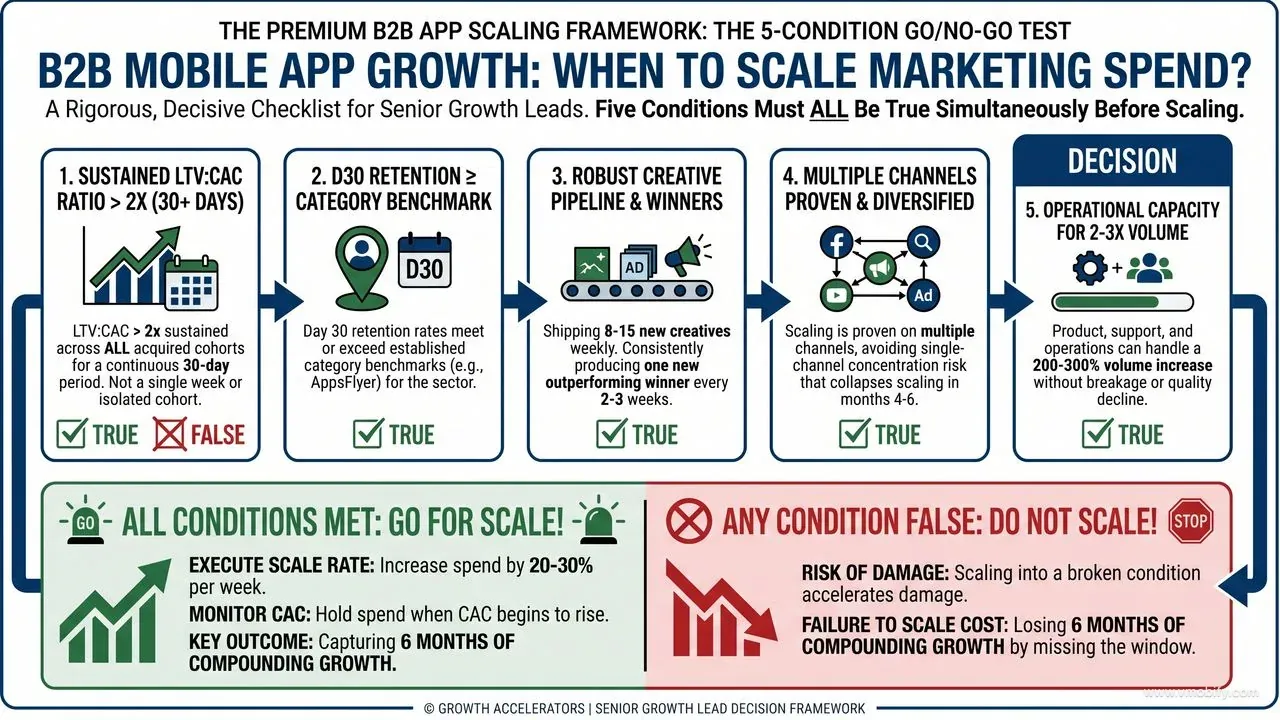
Scale spend only when five conditions hold simultaneously — not when any one of them is true. Scaling on a single signal (usually "CPI is low this week") is how teams accidentally 3x their burn into channels that have not actually proven sustainable. The five-condition test:
- LTV-to-CAC ratio sustained above 2x for 30+ days. Not a single week; not a single cohort. Thirty days of sustained 2x+ across the cohorts being acquired today, not historical cohorts.
- D30 retention at or above category benchmark. AppsFlyer's State of App Marketing publishes D1, D7, D30 retention benchmarks by category — use them as the floor, not an aspiration.
- Creative pipeline producing new winners every 2-3 weeks. A single winning creative is not a system. The signal you can scale is a repeatable production capability — typically 8-15 new creatives shipped weekly with at least one outperforming the incumbent every fortnight.
- Multiple channels proven, not just one. Concentration risk on a single channel is the most common reason scaling collapses in month 4-6 — a policy change, an algorithm shift, or a creative fatigue cycle takes out the only working channel and the whole program stalls.
- Operational capacity to support 2-3x volume without product/support breakage. Acquired users who churn on a broken onboarding or unresolved support tickets are worse than no users at all — they leave 1-star reviews that compound for months.
When all five are true, scale aggressively — 20-30% spend increase per week until CAC starts rising, then hold. The biggest mistake here is timidity: teams that find the five-condition combination but scale at 5% per week leave 6 months of compounding growth on the table. Conversely, jumping spend 100% in a week saturates the algorithm and produces volatile CPI swings that mask whether the underlying economics still hold.
For deeper unit-economics framework see our LTV-to-CAC calculator. The five-condition test is not a one-time check; revisit it monthly because any one condition can deteriorate without the others moving — and scaling into a deteriorating condition compounds the damage quickly.
When should you cut spend?
Cut spend immediately when any one of four conditions is true. Cutting is psychologically and operationally hard — but scaling at unprofitable economics burns runway faster than cutting and rebuilding ever does. The four cut-triggers:
- LTV-to-CAC below 1.2 for 30+ days across most channels. This is the "the unit economics no longer work" signal. Sustained sub-1.2 means every install acquired is destroying enterprise value, even if cash flow looks healthy in the short term.
- Retention dropping versus prior cohorts. Falling retention is almost always a product issue masquerading as a marketing issue — the same channels acquiring the same audience now retain worse, which means something about the in-app experience has degraded. Cutting paid spend protects runway while the product team diagnoses; running paid into a leaky bucket just amplifies the leak.
- Creative fatigue with no replacement pipeline. When CPI rises consistently across all live creatives and there is no winning replacement in test, paid economics deteriorate quickly. Pause paid scaling, fund creative production, and resume only when fresh inventory is proven.
- Runway under 9 months at current burn rate. Below 9 months, preserve cash aggressively — focus on organic and community-driven growth, defer paid media, and only spend on tightly proven, fast-payback channels. The math: if paid CAC payback is 6+ months and runway is 9 months, every rupee of paid spend is recovered after you have run out of money.
The mistake we see most in our portfolio: teams that "wait one more month" hoping a cohort recovers. Cohorts almost never recover; they decay. Cutting at the first sustained negative signal preserves 3-6 months more runway than cutting after "one more month" three times in a row.
Cutting is also not binary. Most apps in trouble should cut 40-60% of paid spend rather than 100% — preserving enough volume to keep the algorithm warm and the creative team learning, while protecting cash. The exception is fraud or policy violation, where 100% pause is the only safe response.
If you want a budget plan calibrated to your specific stage, vertical, and runway position — including which channels to prioritise and what allocation makes sense for your goal — talk to our team. See our portfolio of staged budget execution at vmobify.com/results.
Frequently Asked Questions
What percentage of revenue should I spend on marketing?+
In year 1, marketing typically exceeds revenue — apps invest ahead of monetisation. By year 3, target 25-50% of revenue for high-growth stage, 10-20% for steady-state. Below 10% almost always signals under-investment in growth.
Should I outsource to an agency or hire in-house?+
Agency for stages 1-2 — you need senior expertise without senior salary commitment, and you need channel relationships you cannot build in 12 months alone. In-house starting Series A, when scale and continuity justify a dedicated team and the cost of senior hires amortises across larger budgets.
How much of my budget should go to ASO vs paid?+
For most apps: 5-10% on ASO tooling and production, 50-65% on paid media. ASO has the highest ROI per rupee of any line item but a lower absolute spend ceiling than paid — you cannot scale ASO infinitely the way you can scale paid.
Is it possible to grow a mobile app without paid marketing?+
For viral consumer apps (rare) and B2B SaaS apps (sometimes) yes. For most India consumer apps in 2026 paid is required to reach material scale within reasonable timeframes — organic alone takes 2-4x longer to reach the same install count, which usually exceeds founder runway tolerance.
What is the riskiest budget mistake founders make?+
Front-loading paid spend before product-market fit. This burns runway producing acquired users who do not retain, which gives misleading signals about both the product (it looks worse than it is because acquired users are poorly-fit) and the channel (it looks worse than it is because the product is not ready).
How do I know if my CPI is too high?+
Compare against AppsFlyer Performance Index benchmarks for your vertical and geography. If your CPI is more than 50% above category median for 30+ days, the issue is usually creative quality, audience targeting, or store-page conversion — rarely the channel itself.
Should I spend on brand marketing in year 1?+
Generally no — until Series A, almost all budget should be direct-response performance media. Brand marketing has long payback periods that early-stage runway cannot tolerate, and brand-level recall is not what differentiates a year-1 app from competitors.
Sources
- AppsFlyer Performance Index — Quarterly CPI and retention benchmarks by vertical and geography — primary source for vertical multipliers
- AppsFlyer State of App Marketing — D1/D7/D30 retention benchmarks by category and longitudinal CPI drift data
- Sensor Tower — Category Trends Blog — Category-level spend and CPI movement data including EdTech India trajectory
- Google Ads — App Campaigns Help — UAC setup, bidding strategies, and creative volume guidance
- Apple Search Ads Documentation — Apple Search Ads campaign structure and budget guidance for ASO-adjacent paid
- IRDAI — Insurance Advertising Regulations — Regulatory restrictions affecting creative latitude and effective CPI for insurance apps
- SEBI — Financial Services Advertising Rules — Compliance framework affecting fintech and wealth app marketing budgets
- Statista — India Influencer Marketing Market Size — 25%+ YoY growth data for Indian creator economy line-item planning
About the author
Amol Pomane — Founder, Vmobify
Amol leads Vmobify, a mobile app growth agency that has driven 30M+ downloads and ranked 54K+ keywords across 300+ apps since 2013. He writes about ASO, paid user acquisition, retention, and the operational reality of scaling mobile apps in India and global markets.
Free Growth Audit
See exactly how to scale your app with 13+ years of expertise behind you.
Get My Strategy