App Install Cost in India: 2026 CPI Benchmarks by Category
Indian CPI benchmarks vary 10x across categories and 3x within the same category depending on channel and tier. Here are the real numbers from our portfolio and how to bring yours down.
What does CPI actually measure?
CPI (Cost Per Install) is the average amount you pay for one verified install — total ad spend divided by attributed installs. It is the headline number every UA team reports, and it is also the most misread metric in mobile marketing. Before reading any benchmark table, three distinctions matter.
CPI is not CAC. CAC (Customer Acquisition Cost) is what you pay for a paying customer or qualified user. CPI is per install. If 5% of installs become paying customers, your CAC is 20x your CPI. A ₹40 food-delivery CPI looks great until you learn that activation runs 8% and first-paid-order conversion runs 35%, putting your true CAC north of ₹1,400. The MMP reports CPI because installs are easy to count; the finance team cares about CAC because that is what shows up in unit economics.
Blended CPI is not channel CPI. Channel-reported CPIs (UAC, Meta, TikTok) are routinely 20-40% lower than your true blended CPI because organic-assisted attributions get claimed by multiple channels under last-touch models. AppsFlyer's State of App Marketing report consistently flags this discrepancy across categories — channel dashboards optimistically over-claim by 15-50% depending on attribution window and category.
iOS and Android CPIs are not interchangeable. iOS reach in India is roughly 4-6% of smartphone users per Statista's India mobile market data, so iOS auctions are denser and CPIs run 30-80% higher than Android for the same vertical. The benchmarks below are Android-blended unless noted.
Across the 300+ apps in our active portfolio we report two CPI numbers to every client: the channel-reported CPI (what each ad platform claims) and the blended attributed CPI (total spend ÷ MMP-verified installs after deduplication). The numbers in this post are blended attributed CPIs — what you actually pay per install across a campaign run, after basic fraud filtering.
What are India CPI benchmarks by category in 2026?
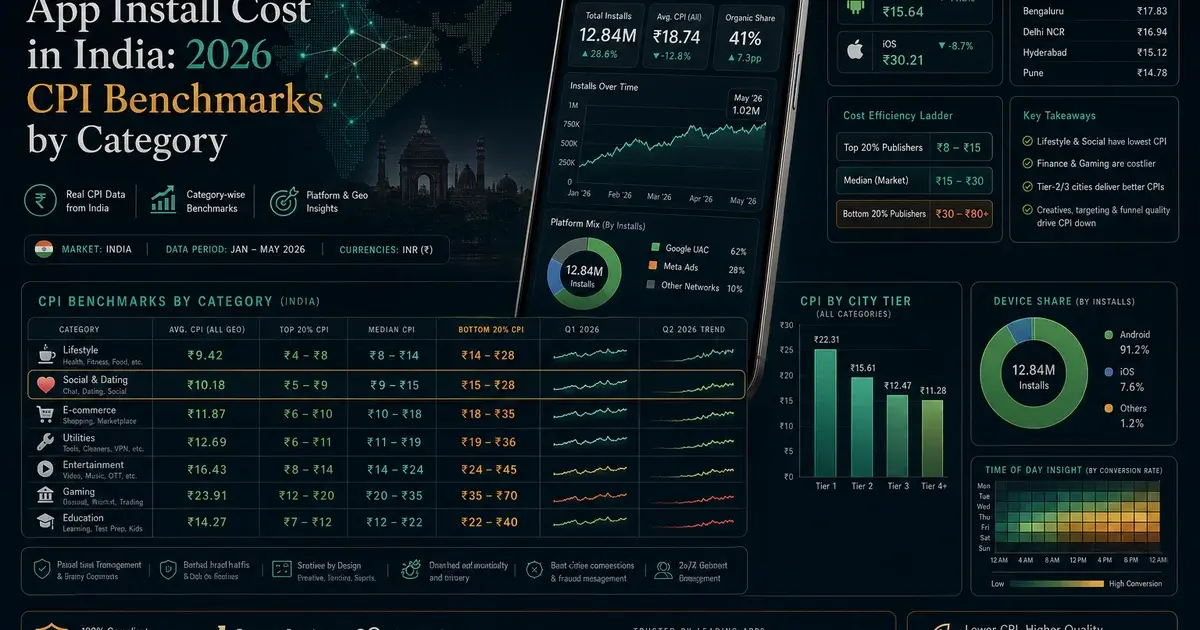
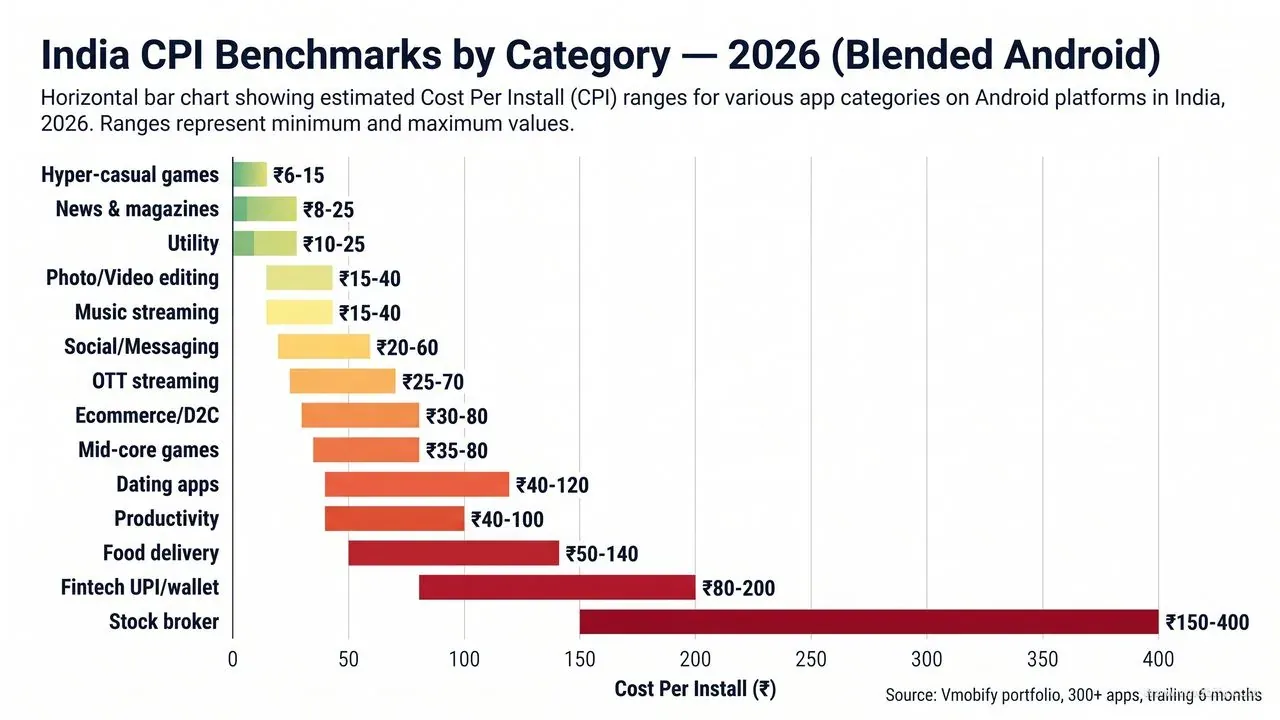
India CPI ranges 10x across categories — from ₹6 for hyper-casual games to ₹450 for crypto exchanges — driven by audience size, regulation, and competitive density. The numbers below come from active campaigns in our portfolio over the trailing 6 months, blended across Google UAC, Meta, TikTok, ASA, and vetted CPI inventory. Each range reflects Tier-1 metro lows to all-India blended highs.
Games and entertainment:
- Hyper-casual games: ₹6-15. The cheapest install vertical anywhere. Tier 2/3 fills regularly clear at ₹4-6.
- Mid-core games (strategy, RPG, casino-style): ₹35-80. Higher LTV justifies aggressive bidding from well-funded studios.
- Real-money / fantasy gaming (Dream11-style, where regulated): ₹120-350. State-by-state legality fragments the auction; only ~22 states are openly addressable.
Utility, productivity, and creative:
- Utility (file managers, scanners, cleaners): ₹10-25. Volume vertical with weak monetisation — works only at scale.
- Productivity / business apps: ₹40-100. SMB-targeted apps run hotter due to enterprise bidding competition.
- Photo & video editing: ₹15-40. UGC and AI features have pulled CPIs up 20-30% YoY.
Communication and content:
- Social / messaging: ₹20-60. Network-effect categories where viral loops should subsidise paid.
- Dating apps: ₹40-120. Tinder, Bumble, Hinge bidding aggressively in metros pushes the top of the range.
- News & magazines: ₹8-25. Vernacular news apps deliver the cheapest installs in the category.
- OTT / streaming: ₹25-70. JioCinema, Hotstar, and Netflix bidding wars define the auction.
- Music streaming: ₹15-40. Spotify and JioSaavn dominate the auction.
Commerce and lifestyle:
- Ecommerce / D2C: ₹30-80. Tier-2 D2C brands compete hard against horizontal players.
- Food delivery: ₹50-140. Swiggy and Zomato have driven incumbent CPI ceilings up across the category.
- Travel booking: ₹80-200. Seasonal — runs 30-50% hotter in October-December.
- Real estate: ₹120-300. Lead-form apps see the worst CPIs because installs are rarely the meaningful conversion.
Regulated finance:
- Fintech (UPI, wallet, neobank): ₹80-200. SEBI and RBI ad-policy tightening since 2024 has compressed addressable creator inventory.
- Stock broker / trading: ₹150-400. Zerodha, Groww, Upstox in a permanent auction war.
- Insurance: ₹120-350. IRDAI disclosure requirements limit creative formats and raise compliance overhead.
- Crypto exchange (where allowed): ₹150-450. Most expensive install vertical in India in 2026.
EdTech, health, wellness:
- EdTech (K-12, test prep): ₹40-120. Parent-targeted creatives perform very differently from student-targeted.
- EdTech (adult upskilling): ₹100-300. LinkedIn-style audiences are expensive everywhere.
- Health & fitness: ₹30-90. Cult.fit and Healthify have lifted the floor in metros.
- Wellness / meditation: ₹40-120. English-language creative limits Tier 2/3 reach.
Across these verticals, our own data tracks closely to public benchmarks published by Adjust's Mobile App Trends and the Sensor Tower State of Mobile reports — usually within 15-20% on the headline ranges. Where the public reports diverge meaningfully from our portfolio is in the regulated verticals, where the gap between best-in-class and median operators is wider than industry averages suggest.
How does CPI vary by channel?
For the same app in the same market, switching channels alone changes CPI by 2-3x — and the channel with the lowest CPI is rarely the channel with the lowest CAC. Here is how the major channels compare against a Google UAC baseline of 100%.
- Google UAC (Android baseline): 100%. The highest-volume paid install channel globally. Google's UAC documentation covers reach across Search, YouTube, Play, Discover, and Display in a single campaign — broadest reach per rupee for most Android-heavy verticals.
- Meta Advantage+ App Campaigns: 120-160%. Higher CPI than UAC for most verticals, but typically higher D7 retention because Meta's broad-targeting audience model tends to produce more committed users. Often the best blended-CAC channel despite the CPI premium.
- TikTok For Business: 90-130%. Highly variable. Strong for gaming, dating, social, ecommerce; weak for fintech and insurance where the audience age curve does not match. Creative-led — bad creative on TikTok performs catastrophically.
- Apple Search Ads (iOS): 140-200% vs Google on iOS. Most expensive channel per install but highest intent quality — users who tap an ASA result already searched for your app's keyword. Conversion-to-paid is usually 2-3x higher than display channels.
- Programmatic DSPs (Liftoff, Moloco, Aarki): 90-150%. Best when audience targeting is precise and you have a strong lookalike seed. Below baseline for re-engagement; above baseline for cold prospecting.
- CPI Networks (non-incent): 50-80%. Headline CPI looks cheap but D7 retention is typically 30-50% lower than Google or Meta. Useful for ranking velocity bursts; rarely the right backbone for sustained UA. See our breakdown in the CPI network service guide.
- Incentivised offerwall (Tapjoy, ironSource offerwall): 20-40%. Cheapest CPI on paper. Retention is dramatically worse — typically 5-15% of organic baseline by D7. Use only for top-of-chart ranking pushes where install volume drives discovery, never as a primary acquisition source.
The lesson the channel-mix table teaches: optimising on CPI alone systematically pushes you toward incentivised and CPI-network traffic, which destroys retention. Every serious UA team optimises on cost-per-retained-user (CPRU) or cost-per-paying-user instead. CPI is the input metric; CPRU is the output that matters.
In our portfolio, the typical winning channel mix for a category-leading consumer app in India looks like 45-55% Google UAC, 25-30% Meta, 10-15% ASA (for iOS reach), 5-10% TikTok or programmatic, and CPI networks reserved for tactical ranking bursts only. For deeper context see our UAC vs Meta vs CPI comparison.
How much cheaper is Tier 2/3 than Tier 1 in India?
Tier 2 cities deliver installs at 50-70% of Tier-1 CPI; Tier 3 and rural deliver at 25-50% of Tier-1 CPI. But the gap only materialises if your product is genuinely usable for that audience. Geographic targeting on its own is not a CPI-reduction strategy — it is a market-fit strategy with CPI consequences.
- Tier 1 (Mumbai, Delhi, Bangalore, Chennai, Kolkata, Hyderabad, Pune): 100% baseline. Densest auctions, highest competitive bidding, English-language creative dominant. Approximately 15% of India's smartphone base but 50%+ of national paid-UA spend per IAMAI industry reports.
- Tier 2 (Jaipur, Ahmedabad, Indore, Lucknow, Kochi, Coimbatore, Chandigarh, etc.): 50-70% of Tier-1 CPI. Hindi and regional creative starts to outperform English by 30-50% on click-through.
- Tier 3 and rural: 25-50% of Tier-1 CPI. English-language creative collapses; vernacular is essential. Device base skews toward sub-₹15,000 Android with 2-3GB RAM and patchy 4G.
Apps targeting Tier 2/3 specifically can run blended CPIs 40-60% below the all-India benchmarks in the category table above — but only if the product is suitable for that audience. The non-negotiable product requirements:
- Vernacular UI — Hindi minimum, ideally Tamil, Telugu, Marathi, Bengali, Gujarati for serious Tier 2/3 plays. AppsFlyer's Performance Index shows vernacular apps in India deliver 40-60% lower CPIs and 2-3x higher D30 retention than English-only equivalents in the same vertical.
- Sub-25MB APK — large APKs see install drop-off rates of 40%+ on slow connections. Android App Bundles and dynamic feature modules are essential.
- Low-end device support — apps that crash on a Redmi 9A lose 60%+ of their Tier 3 audience silently.
- Offline-capable flows — meaningful onboarding without continuous connectivity.
Across our portfolio, the apps that have successfully captured the Tier 2/3 CPI advantage all rebuilt onboarding, payment flows, and creative for that audience first — then targeted. Apps that simply changed geo-targeting on existing campaigns saw CPI drop but D7 retention collapse by 50-70%, wiping out the CPI savings within a month.
The creative side matters as much as the product side. Vernacular creative is not just English creative with translated subtitles — the visual codes, music, casting, and pacing that work in Lucknow or Indore differ meaningfully from what works in Bandra or Koramangala. The teams that win in Tier 2/3 brief regional UGC creators directly rather than translating metro creative. Cost per produced asset is 40-60% lower, and click-through rates run 2-3x higher on the resulting variants.
One more practical note on tier targeting: Google UAC and Meta Advantage+ both behave better when each tier runs as a separate campaign with its own conversion goal, bid strategy, and creative pool. Bundling all three tiers into one campaign lets the algorithm spend disproportionately in the cheapest tier — which sounds good until you realise it is also the tier with lowest LTV in most verticals. Separation gives you actual control over the spend mix and the LTV mix simultaneously.
Which four levers move your CPI by 30-50%?
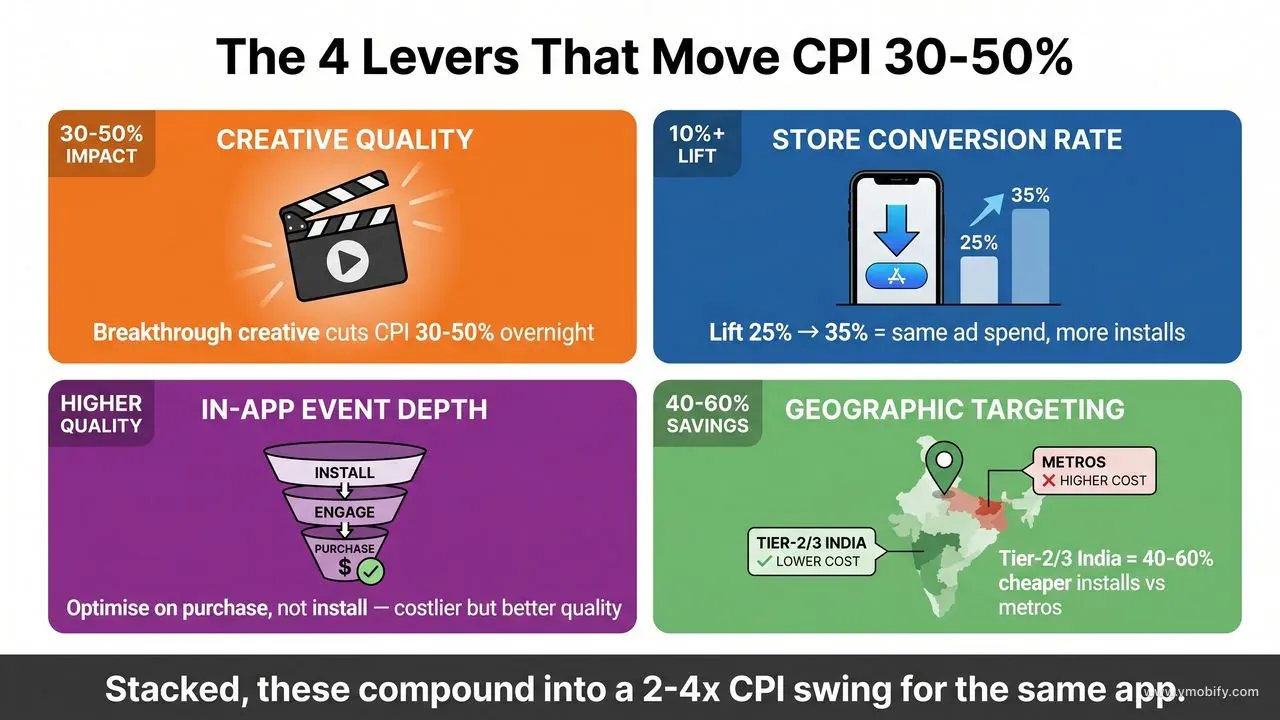
Same app, same market, different operators get CPIs that differ by 2-4x — and the difference always comes down to four levers. Each one moves CPI by 30-50% in isolation; stacked, they compound to a 2-4x swing. If your CPI is materially above the benchmarks in this post, one or more of these is the cause.
1. Creative quality. The single largest variable. A breakthrough creative — usually a UGC video with a sharp 2-second hook — cuts CPI 30-50% within 48 hours of going live and uncaps your scalable paid spend. In our portfolio, the gap between an average creative and a top-quartile creative is consistently 2-3x in blended CPI on the same audience and channel. Teams that invest in a sustained creative pipeline (8-12 new variants per ad group per month) materially outperform teams that ship 2-3 creatives and let them run.
2. Store conversion rate. Lifting your store-page conversion from 25% to 35% reduces CPI by roughly 30% — same ad spend, same click-through, more installs counted. The first screenshot drives approximately 60% of the install decision per SplitMetrics' aggregated test data; the icon, ratings, and review-tone signals carry most of the rest. Most apps in our portfolio leave 10-25 percentage points of store conversion on the table — that is pure CPI reduction available for the cost of a focused ASO sprint.
3. In-app conversion event depth. Channels optimise on whatever events you track. Track only shallow events (install, first session) and the algorithm finds you cheap, low-retention installs that pad the dashboard but never convert. Track deeper events (registration, first purchase, day-7 return, subscription) and your reported CPI rises 30-70%, but your CAC improves materially because the algorithm is now optimising toward your actual valuable user. Singular's State of Mobile reports consistently show that apps reporting value-based optimisation outperform install-only campaigns on D30 ROAS by 40-80% across most verticals.
4. Geographic targeting precision. Switching from "All India" to "Tier 1 only" can double your CPI; "Tier 3 only" can halve it. Apps running undifferentiated all-India campaigns systematically over-pay for metro installs and under-bid in Tier 2/3 where they could win cheaply. The fix is splitting campaigns by tier and managing each as a distinct unit — separate creatives, separate bid strategies, separate conversion goals. This single operational change has cut blended CPI by 25-40% for many apps in our portfolio.
Two more honest observations from running 300+ India campaigns: budget alone does not move CPI — adding spend at fixed creative and tracking maturity raises CPI as auctions compress. And changing channels does not move CPI nearly as much as fixing the four levers above. The teams trying to escape a high-CPI problem by switching from Meta to TikTok or from UAC to programmatic almost always discover the problem follows them; the creative and store-page work is unavoidable. See our mass UA strategy guide for the full operating model.
How should you budget for a 6-month India launch?
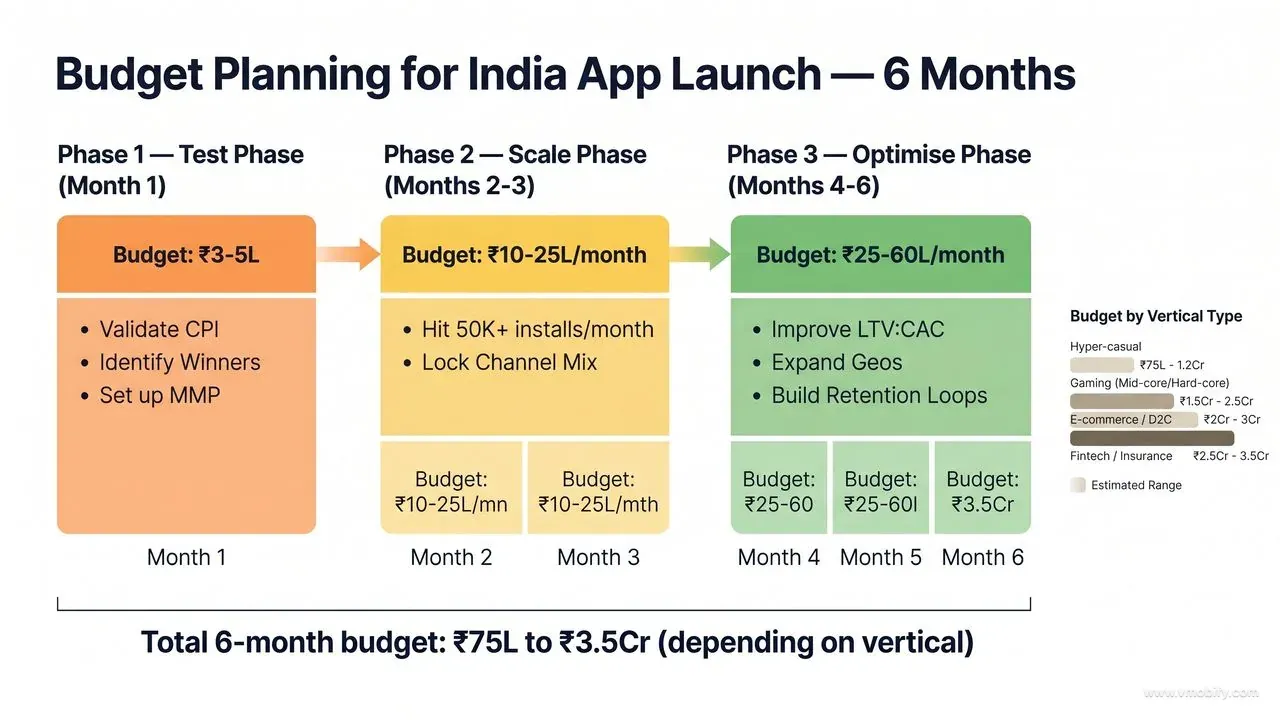
A serious 6-month India launch runs ₹75L to ₹3.5Cr depending on vertical. Anything under ₹15L for the full 6 months produces statistically noisy data and is better spent on ASO and influencer until product-market signal is clearer. Here is a phase-by-phase planning framework that works for most consumer apps.
Phase 1 — Validate (Month 1): ₹3-5L
- Goal: validate CPI within ±30% of benchmark, identify 2-3 winning creatives, lock MMP and attribution properly.
- Spend split: 60% Google UAC, 25% Meta, 10% Apple Search Ads (for iOS), 5% creative production.
- Targets: 5,000-15,000 installs, D7 retention within 20% of category baseline, at least one creative with CPI 30%+ below average.
- Exit criteria: clear winning channel mix, validated CPI, retention curve credible enough to commit to scale.
Phase 2 — Scale (Months 2-3): ₹10-25L/month
- Goal: hit 50,000+ installs/month, lock channel mix, build a creative pipeline producing 8-12 new variants/month.
- Add: TikTok if the audience matches, programmatic DSPs for incremental reach, light CPI network use for ranking velocity bursts.
- Targets: blended CPI within 15% of category benchmark, top-50 category ranking in primary store, D30 retention curve flattening at 15%+ of D1.
- Operational shift: hire or contract a dedicated creative producer; weekly creative testing cycles.
Phase 3 — Optimise (Months 4-6): ₹25-60L/month
- Goal: improve LTV-to-CAC ratio toward 3:1 minimum, expand to new geographies and tiers within India, build retention loops (referrals, push, lifecycle).
- Add: value-based bidding once 200+ conversions are tracked, lookalike audiences off your high-LTV cohorts, lifecycle CRM (push, email, WhatsApp).
- Targets: top-20 category ranking, organic-to-paid ratio above 1:1, payback period under 6 months on paid cohorts.
Total 6-month budget by vertical:
- Content / news / OTT: ₹40-90L. Low CPI categories with broad addressable audience.
- Utility / productivity: ₹60-1.2Cr. Volume play; budgets driven by retention curve quality.
- Ecommerce / D2C: ₹80-1.5Cr. Performance-marketing density requires sustained creative investment.
- EdTech / health / wellness: ₹1-2Cr. Higher CPIs but better LTV justifies the spend.
- Fintech / insurance / broker / crypto: ₹2-3.5Cr. Regulated verticals where ₹200+ CPIs are normal and CAC payback runs 9-18 months.
The budget numbers above assume reasonably-built product, MMP correctly implemented, and a creative production capability of at least 8 new variants per month. Apps that try to scale paid UA before fixing onboarding leaks, attribution gaps, or creative production capacity systematically overspend by 40-80%. Get a custom budget estimate for your specific app and category, or see our case studies for examples of how the framework plays out across verticals.
Frequently Asked Questions
Why are fintech CPIs so much higher than gaming in India?+
Regulated categories have smaller addressable audiences, stricter ad-policy constraints from SEBI, RBI, and IRDAI, and competitor bidding wars among well-funded players like Zerodha, Groww, Paytm, and PhonePe. Combined, these factors triple or quadruple auction prices versus open consumer verticals.
Can I get CPIs below the benchmark range?+
Yes — by 30-50% — with above-average creative, above-average store conversion, deeper event tracking, and disciplined geographic targeting. Below-range CPIs are achievable in our portfolio but require sustained creative investment of at least 8-12 new variants per ad group per month.
Should I worry if my CPI is higher than these benchmarks?+
Not necessarily. What matters is CPI relative to LTV and payback period. A ₹250 CPI with ₹2,000 LTV and 4-month payback is excellent; a ₹50 CPI with ₹80 LTV is unprofitable. Always benchmark on cost-per-paying-user or cost-per-retained-user, not on raw CPI.
Do these benchmarks apply to iOS too?+
No — iOS CPIs in India run 30-80% higher than these Android-blended numbers due to lower iOS reach (4-6% of smartphone base) and denser auctions on Apple Search Ads. iOS LTV is typically 2-4x higher than Android in India, so the higher CPI is usually justified for monetised apps.
How often do CPI benchmarks change in India?+
Meaningfully every 3-6 months. New entrants flooding a category (e.g. Jio launching adjacent apps), holiday seasonality (October-December auctions run 30-50% hotter), and platform policy changes (SKAdNetwork updates, MMP changes) all move benchmarks. We update our internal portfolio benchmarks monthly.
What is the cheapest legitimate way to acquire installs in India?+
Vernacular-creative Google UAC campaigns targeted at Tier 2/3 audiences, paired with a regional micro-influencer push. Effective blended CPIs under ₹15 are achievable for utility, news, content, and casual gaming categories with this combination — provided the product is genuinely built for the audience.
How long before a new India campaign produces reliable CPI data?+
Most channels need 100+ conversions and 7-10 days of run-time before reported CPIs are statistically reliable. Below that, daily CPI swings of 30-50% are normal and not signal. Plan a minimum 2-week validation phase before making major channel-mix decisions.
Sources
- AppsFlyer — Performance Index — Quarterly India and global CPI, retention, and ROAS benchmarks by category
- AppsFlyer — State of App Marketing — Channel-reported vs blended CPI discrepancy analysis across verticals
- Adjust — Mobile App Trends Resources — Public CPI and retention benchmarks used to triangulate portfolio data
- Singular — State of Mobile App Marketing — Value-based bidding and event-depth impact on CAC and ROAS
- Sensor Tower — State of Mobile — Category-level install volume and spend trends for India market
- Statista — India Mobile Internet Usage — iOS vs Android share and smartphone-base data for India audience sizing
- IAMAI — Industry Reports — India internet and mobile industry data on metro vs non-metro spend distribution
- Google Ads — App Campaigns Help — Official Google UAC documentation on bidding, targeting, and creative requirements
About the author
Amol Pomane — Founder, Vmobify
Amol leads Vmobify, a mobile app growth agency that has driven 30M+ downloads and ranked 54K+ keywords across 300+ apps since 2013. He writes about ASO, paid user acquisition, retention, and the operational reality of scaling mobile apps in India and global markets.
Free Growth Audit
See exactly how to scale your app with 13+ years of expertise behind you.
Get My Strategy

