Google UAC vs Meta vs CPI Networks: Which Channel for Your App in 2026?
Most teams default to whichever channel they tried first. Here is the honest 2026 comparison across pricing, quality, attribution, and scalability — plus the stage-based framework for deciding which channel earns your next rupee of paid spend.

Which channel wins when?
Start with Google UAC for volume and Android-heavy geographies. Add Meta Advantage+ when your audience has clear demographic or interest definition and your creative pipeline can sustain weekly refresh. Use CPI networks for ranking bursts and geographic fills — not as a primary acquisition channel. That is the whole answer in three sentences. Everything below is the data, reasoning, and 2026-specific nuance behind it.
In our portfolio of 300+ apps managed since 2013, the apps that scale efficiently almost never run on a single channel. The teams that succeed treat UAC, Meta, and CPI as complementary tools with distinct jobs. The teams that struggle pick a favourite, pour 90% of budget into it, and then scramble when the auction breaks or the algorithm changes.
The 2026 landscape has specific new considerations: Google UAC now penalises poor Android Vitals scores through reduced delivery; Meta Advantage+ has fully automated audience selection with broad targeting now clearly outperforming interest stacking; SKAN 4 has reshaped iOS attribution for both channels; and CPI network quality has bifurcated sharply between vetted non-incentivised publishers and fraud-heavy bottom-tier supply. The comparison below covers all of this — plus the stage-based framework we use to decide where each rupee of paid spend should go next month.
How do these three channels actually differ structurally?
The three channels are often lumped together as "paid UA" but they are fundamentally different distribution models with different economics, different controls, and different failure modes. Treating them as interchangeable is the root cause of most channel-mix mistakes we see across portfolio reviews.
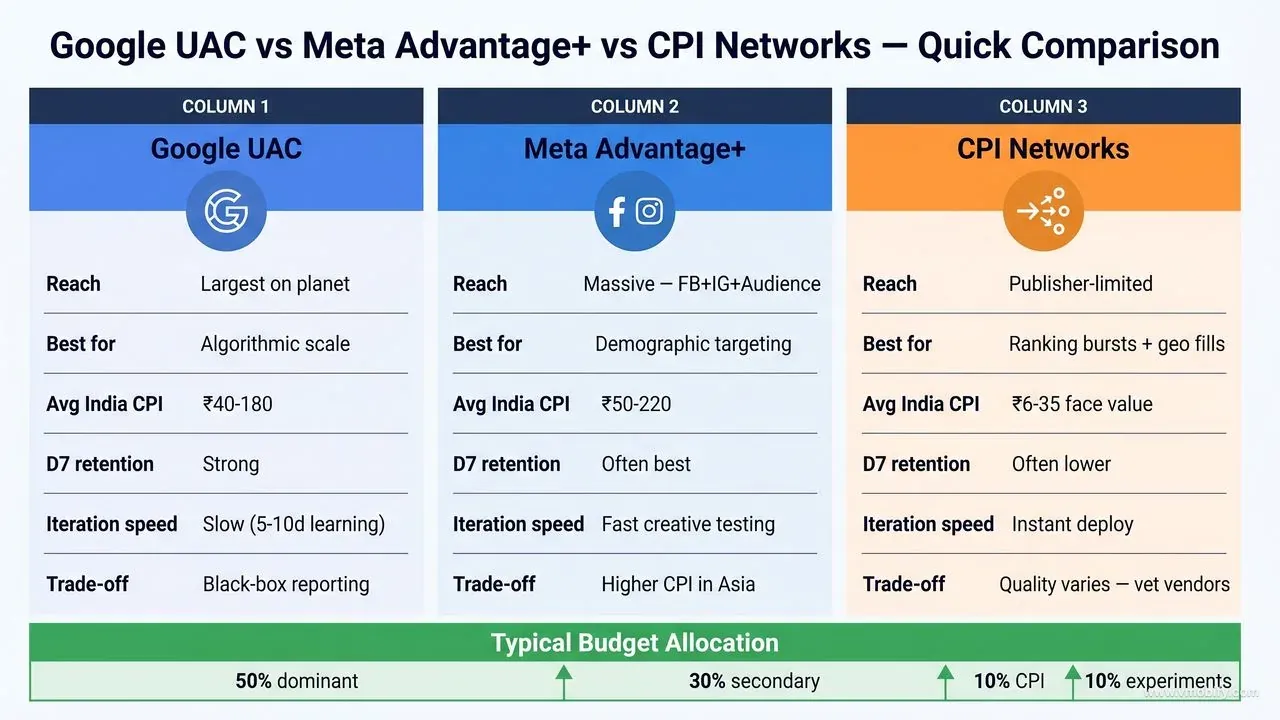
| Dimension | Google UAC | Meta Advantage+ | CPI Networks |
|---|---|---|---|
| Pricing model | Auction-based CPA/ROAS bid | Auction-based CPM/CPC/CPI bid | Fixed CPI — deterministic |
| Audience control | Minimal — algorithm-driven | Broad + optional custom audiences | Publisher-set (opaque) |
| Learning phase | 5–10 days minimum | 7–14 days minimum | None — installs start immediately |
| Scales over time? | Yes — compounds as algorithm learns | Yes — compounds with creative refresh | No — same unit economics on day 30 |
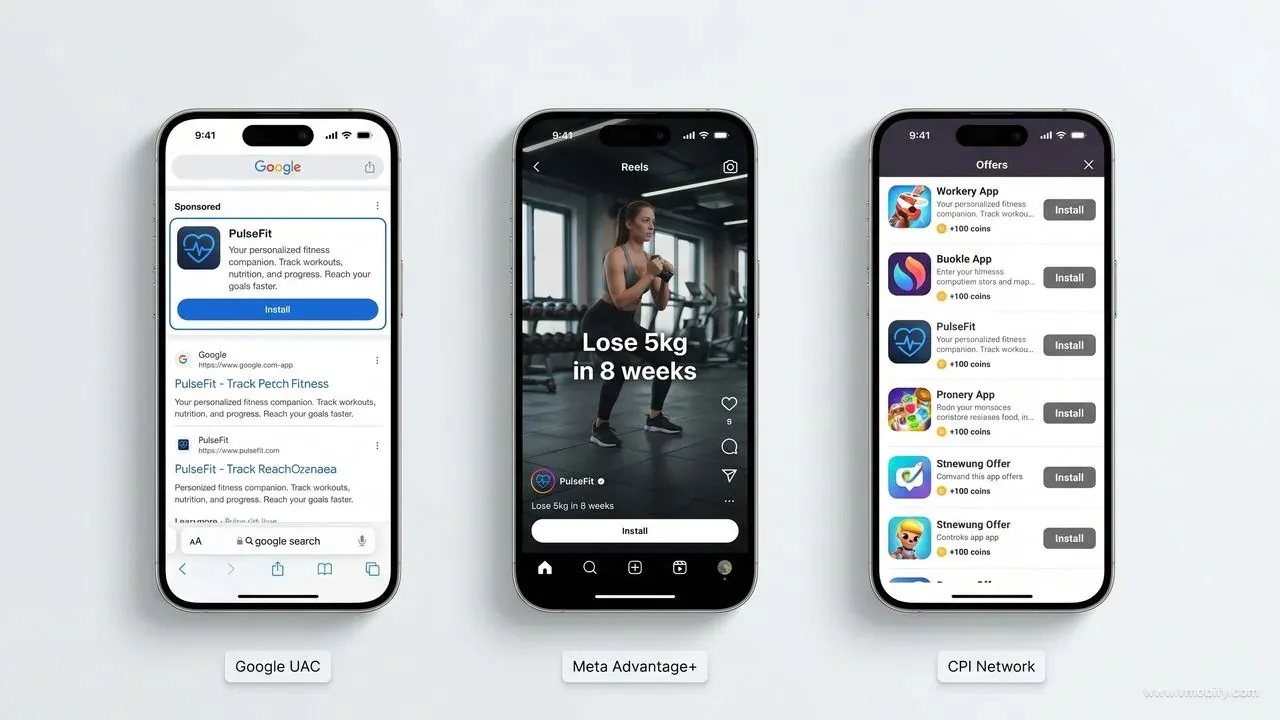
| Primary inventory | Search, YouTube, Play, Discover, Display | Facebook, Instagram, Messenger, AN | Publisher apps, offerwalls |
| iOS attribution | SKAN 4 + modelled | SKAN 4 + AEM | MMP postback (variable) |
| Fraud risk | Low — walled garden | Low–Medium (AN has some risk) | High on bottom-tier; low on vetted supply |
The first two channels are algorithmic, bid-based, and auction-driven. They compound — a winning creative and audience combination gets cheaper as the algorithm learns and optimises. CPI is deterministic and CPI-locked. A CPI network campaign costs the same on day 30 as on day 1. That single difference shapes every other decision: ramp speed, predictability, creative requirements, and risk profile.
The key structural question is: do you need learning-phase durability or burst-speed execution? UAC and Meta are built for the former. CPI networks are built for the latter. Running them as though they serve the same purpose is the most expensive mistake in paid UA.
What makes Google UAC the foundation of most paid stacks?
Google App Campaigns (UAC) is the largest single paid install channel on the planet and the only channel that combines active Search intent with display-scale volume. For most apps with broad consumer appeal in Android-heavy geographies — India, SEA, LATAM — UAC should be the foundation of the paid mix, not an add-on.
2026-specific strengths worth understanding:
- AI creative optimisation: UAC's algorithm now automatically tests and mixes image, video, HTML5, and app-preview formats across placements. Campaigns with 10+ creative assets consistently outperform those with 2–3 by 30–50% on CPI in our managed campaigns. Google's updated App Campaigns best practices recommend up to 20 video assets and 20 image assets to give the algorithm sufficient test surface.
- tROAS vs tCPI bidding: Start with target-CPI (tCPI) for the first 50–100 install conversions, then graduate to target-ROAS (tROAS) once you have 30+ days of consistent in-app revenue data. tROAS attracts higher-value users but requires significantly more conversion signal — do not attempt it in volume markets like India Tier-2/3 where purchase events are sparse. tCPA optimised toward a mid-funnel event (registration, trial start) is typically the right call for India volume campaigns.
- Android Vitals impact on delivery: Since 2025, Google's algorithm reduces UAC delivery to apps with poor Android Vitals scores (crashes, ANRs, battery drain). An app with a Vitals score below the Play Store category threshold can see 20–40% lower impression delivery even with competitive bids — the channel effectively penalises poor app quality. This is one of the least-discussed performance variables we see across portfolio audits.
- Geographic cost structure: India metro CPIs (Mumbai, Delhi, Bengaluru) run 2–3× more expensive than Tier-2/3 cities for the same vertical. Separating into geo-segmented campaigns lets you scale Tier-2/3 volume without paying metro rates. Utility and EdTech apps in our portfolio typically run Rs 12–20 CPI in Tier-2/3 versus Rs 25–40 in metro on the same campaign objective.
Weaknesses that trip teams up:
- Black-box reporting: Placement-level transparency is limited. You see aggregate performance, not which specific publishers or surfaces are driving installs.
- Long learning phase: Under Rs 50K/week in India, campaigns often fail to exit learning and produce unreliable data. Budget minimums matter more than most teams realise.
- iOS variability: SKAN 4 constraints mean iOS UAC data is modelled, not deterministic. Coarse conversion values and 3-postback windows require careful MMP configuration to extract meaningful optimisation signals.
Pro tip — Android Vitals health check
Before scaling UAC spend, audit your Play Console for Vitals. A crash rate above 1.09% (Play Store threshold for bad behaviour) actively suppresses UAC delivery. Fix the Vitals first, then scale the spend.
Best fit: Apps with broad appeal, clearly defined post-install conversion events, Android-heavy target geographies, and Rs 50K+/week budget to exit learning. India fintech, utility, ecommerce, EdTech, OTT, and productivity all skew UAC-heavy in the portfolios we manage. See our user acquisition service for managed UAC campaign setups.
How does Meta Advantage+ App Campaigns perform in 2026?
Meta Advantage+ is the strongest channel for apps where the target user has clear demographic or psychographic definition and the creative system can sustain high-frequency refresh. Where UAC wins on raw reach and Android scale, Meta wins on precision, creative leverage, and D7 retention for the right verticals.
2025–2026 automation updates that changed the channel:
- Full broad audience advantage: Meta's 2025 update removed most manual audience controls from Advantage+ App Campaigns and pushed broad targeting (country + age band only) as the default. The data is clear — broad targeting consistently outperforms interest stacking because the algorithm has more signal to work with. Meta's official Advantage+ guidance is explicit on this point.
- Creative diversity requirements: The algorithm now requires a minimum of 6 creative variants per campaign to activate full optimisation. Apps with only 1–2 creatives produce CPIs 60–80% higher than apps with 8–12 variants in our managed portfolio — we see this consistently across verticals.
- iOS attribution with SKAN 4: Meta uses a combination of SKAN 4 postbacks and its own Aggregated Event Measurement (AEM) framework for iOS attribution. Running dedicated iOS and Android campaigns (rather than combined) is essential for accurate optimisation signals.
India-specific CPI benchmarks (2026, Advantage+):
| Vertical | India CPI Range | D7 Retention vs Organic |
|---|---|---|
| Fintech / BFSI | Rs 40–90 | 70–85% |
| D2C ecommerce | Rs 30–65 | 65–80% |
| Utility / productivity | Rs 20–50 | 70–85% |
| Dating / social | Rs 25–60 | 60–75% |
| Hyper-casual games | Rs 8–20 | 55–70% |
Weaknesses to plan around:
- Creative fatigue is faster than UAC: Meta audiences saturate faster. Without 6–12 fresh creatives per month per ad set, CPMs creep upward consistently and CTRs decline. Creative operations is the single biggest operational bottleneck for sustained Meta scale.
- Higher headline CPI than UAC in most Asian markets: Typically 30–80% above UAC before retention math is applied. Many teams reject Meta on face CPI alone — this is wrong. The channel must be evaluated on cost-per-retained-user, not raw CPI.
- Audience Network quality: The Audience Network has variable quality. For retention-sensitive verticals, excluding it and concentrating budget on Facebook/Instagram feeds and Reels often improves D7 metrics.
Warning — the narrow-targeting trap
The most expensive Meta mistake: stacking 10+ interest targets on top of Advantage+ campaigns. This starves the algorithm of signal and consistently produces CPIs 40–60% higher than pure broad targeting. Remove interest stacking entirely and let Advantage+ work as designed.
Best fit: Apps where the target user has clear demographic or psychographic definition — dating, wellness, women-focused commerce, finance for specific income segments, lifestyle commerce. See our full Meta App Install Campaigns playbook for campaign structure and creative testing protocols.
When do CPI networks actually beat the walled gardens?
CPI networks beat Meta and Google in exactly three scenarios: ranking-velocity bursts before featuring or competitive moments, geographic fills the walled gardens cannot serve efficiently, and rapid market-entry tests before committing larger algorithmic spend. Outside those three use cases, they rarely win on cost-per-retained-user.
The quality spectrum — this is the most important thing to understand:
CPI networks are not a homogeneous category. The difference between a top-tier non-incentivised publisher network and a bottom-tier offerwall is the difference between 25% D7 retention and 3% D7 retention. AppsFlyer's Performance Index quantifies this — quality spread within the CPI network category is larger than the spread between categories.
| Network Type | India CPI | D7 Retention | IVT / Fraud Rate | Best Use |
|---|---|---|---|---|
| Tier-1 non-incent | Rs 15–35 | 20–30% | <2% | Quality bursts, market entry |
| Mid-tier non-incent | Rs 8–18 | 12–22% | 3–8% | Tier-2/3 geographic fills |
| Incentivised (disclosed) | Rs 3–10 | 5–15% | 5–15% | Ranking-only bursts |
| Bottom-tier / unvetted | Rs 1–5 | <5% | 20–60%+ | Avoid entirely |
OLX India case study — 35% CPI reduction through CPI network optimisation: One of the most cited recent examples in the India market is OLX India's structured network segmentation programme, which achieved a 35% reduction in blended CPI by routing Tier-2/3 geographic fills through vetted mid-tier non-incentivised networks rather than supplementing metro UAC campaigns. The key was measuring each publisher on D7 retention, not raw CPI, and pruning any publisher below 60% of organic retention baseline.
Bot traffic red flags to monitor actively:
- D1 retention below 3% (legitimate users open the app at least once after install)
- Session length under 10 seconds averaged across the cohort
- Install-to-registration conversion below 5% (organic typically runs 20–40%)
- Geographic clustering — installs from implausibly narrow device clusters
- MMP fraud-flag rate above 5% on any publisher line item
Warning — IVT rates on the long tail
Sub-tier CPI networks carry genuine fraud exposure. Mobile install fraud remains a multi-billion-dollar industry problem — AppsFlyer's State of App Marketing reports consistently document IVT rates of 20–60% on unvetted publisher supply. The only defence is MMP-based fraud monitoring on every CPI line item from day one.
Best fit: Ranking bursts before featured launches, geographic fills (Tier-2/3 India, specific SEA countries), market-entry tests, and defensive pushes against well-funded competitors. Vmobify's CPI network service operates on pre-vetted publishers only — fraud rates across our managed campaigns run below 1% since 2013.
When should TikTok and Apple Search Ads enter the mix?
TikTok belongs in the mix when your audience skews under 35 and your creative inventory can sustain weekly refresh. Apple Search Ads belongs whenever iOS represents 25%+ of your install target — nearly regardless of vertical. Both are too often treated as afterthoughts when they should be evaluated as primary channels for the right apps.
TikTok App Install Ads in 2026:
TikTok has matured into the third major algorithmic paid install channel. It behaves similarly to Meta — broad targeting, creative-driven, algorithm-optimised — with important differences:
- Spark Ads: Boosting organic creator content consistently outperforms manufactured brand ads on TikTok. For D2C ecommerce targeting Gen Z, Spark Ads campaigns regularly achieve CPIs 25–40% below equivalent static creatives. The authenticity signal in organic-style content is the competitive moat.
- Emerging market CPIs: TikTok CPMs in India, Indonesia, Vietnam, and the Philippines are materially lower than Meta for comparable audience reach in 2026. For gaming verticals especially, TikTok India CPIs run Rs 6–18 — competitive with quality CPI networks but with algorithmic optimisation that compounds over time.
- Where TikTok underperforms: Fintech (regulatory restrictions on financial services creative), B2B (audience mismatch), and verticals where the target user skews 40+. TikTok's algorithm is very strong at finding 18–34 year olds but thin outside that band.
See our dedicated TikTok App Install Campaigns guide for Spark Ads setup, creative briefing, and bidding structure.
Apple Search Ads (ASA) — a different proposition entirely:
ASA is not an algorithmic display channel; it is bottom-of-funnel keyword bidding inside the App Store. Apple's own data indicates 70%+ of App Store visitors use search to discover apps. ASA captures that intent at the highest-intent moment in the discovery funnel.
- Always include ASA when iOS is 25%+ of your install mix. CPI is higher than display channels but install quality is materially better — users searching your category right now are the highest-intent cohort in paid UA. We see D7 retention from ASA run 20–40% above Google UAC cohorts in our iOS-heavy portfolio apps.
- Brand defence first: Bid your own brand keyword before anything else. Competitors bidding on your brand name is common; defending it is almost always positive ROI.
- Category keyword expansion: After brand defence, layer in 20–50 category-relevant keywords. Refine weekly on conversion rate per keyword. Our Apple Search Ads strategy guide covers full keyword architecture.
For most apps in 2026, the realistic full-channel mix is 4–5 channels running concurrently: UAC + Meta + one of TikTok or programmatic + ASA + tactical CPI. Apps running only 1–2 channels are leaving meaningful efficient volume on the table.
Which channels should you pick by app vertical and stage?
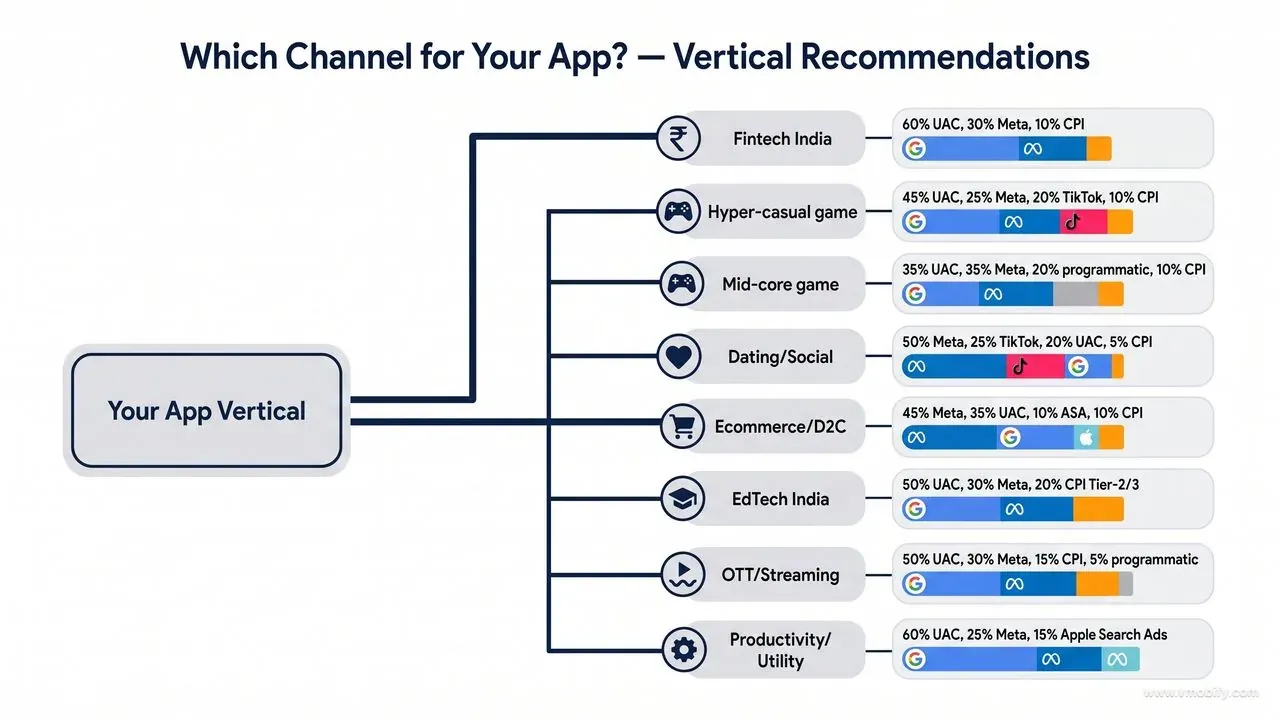
Vertical fit overrides general channel preference. Below are the channel splits we run as starting points across our portfolio of 300+ apps — these are not industry averages but working allocations refined over 30-day evaluation cycles.
| Vertical | Primary | Secondary | Supplement | Key reason |
|---|---|---|---|---|
| Fintech / BFSI (India) | UAC 55% | Meta 30% | ASA 10%, CPI 5% | UAC Search captures high-intent finance queries |
| Hyper-casual games | UAC 40% | TikTok 25% | Meta 20%, CPI 15% | Creative volume is the bottleneck; video-native channels win |
| Mid-core games | UAC 35% | Meta 30% | Programmatic 20%, CPI 15% | LTV-driven tROAS optimisation requires both channels |
| Dating / social | Meta 50% | TikTok 25% | UAC 20%, CPI 5% | Demographic precision decisive; Meta audience graph wins |
| D2C ecommerce | Meta 45% | UAC 35% | ASA 10% (iOS), CPI 10% | Meta retargeting and lookalikes drive repeat purchase efficiently |
| EdTech (India) | UAC 50% | Meta 30% | CPI 20% (Tier-2/3 fills) | EdTech buyers research heavily; UAC Search captures intent |
| OTT / streaming | UAC 50% | Meta 30% | CPI 15%, programmatic 5% | Broad consumer appeal favours algorithmic scale |
| Utility / productivity | UAC 55% | Meta 25% | ASA 15% (iOS), CPI 5% | High-intent search queries dominate the install funnel |
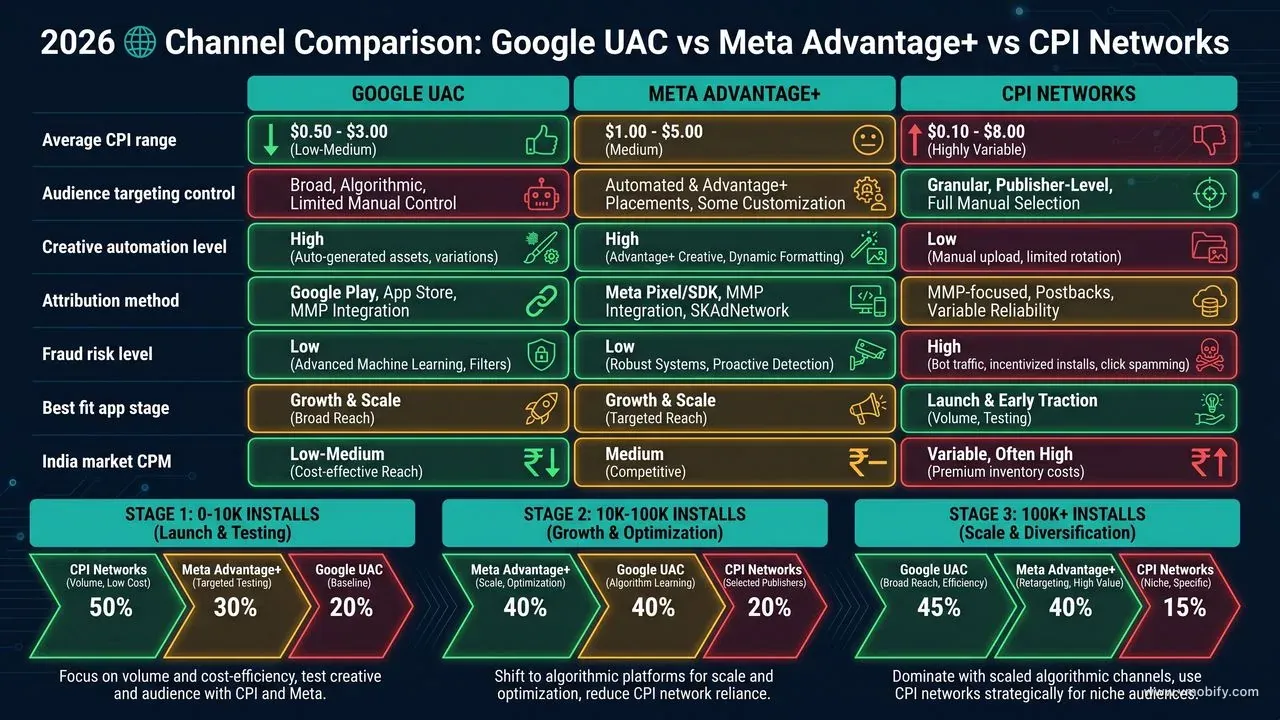
Stage matters as much as vertical:
- 0 to 10K installs: Prioritise Meta (70%) for targeting precision and creative testing speed. UAC (20%) for initial Android reach and learning. CPI (10%) for ranking proof-of-concept. Organic/ASO as the non-paid foundation.
- 10K to 100K installs: Shift to UAC (50%) as the algorithm has sufficient conversion data to self-optimise. Meta (30%) sustains retention-quality traffic with creative refresh. CPI networks (10%) for selective volume bursts. Influencer partnerships (10%) for authentic social proof.
- 100K+ installs: UAC dominates (40%) for scale and retention. Meta (25%) for cross-platform reach and retargeting. Programmatic DSPs like Moloco and AppLovin (15%) for advanced targeting. CPI (5%) reserved for ranking moments only. Other channels including TikTok and Snap (15%).
One pattern holds consistently across our portfolio: gaming verticals are the only ones where TikTok earns 20%+ of the paid mix consistently. For non-gaming consumer apps, TikTok is typically a 5–15% complement to Meta. For B2B and developer-tool apps, TikTok is generally skippable.
How does MMP attribution work across all three channels?
Attribution is no longer a post-launch task — it is campaign-critical infrastructure that shapes how every channel optimises. In 2026, running UAC, Meta, and CPI networks without a properly configured MMP is like running three separate races with three different finish lines. The channel comparison becomes meaningless.
The three-channel attribution stack:
- MMP selection: AppsFlyer, Adjust, and Singular are the three dominant platforms. All three integrate with UAC, Meta, and major CPI networks via postback. Pick one and instrument it deeply across all channels before launching multi-channel campaigns.
- Google UAC attribution: Android attribution is reliable via Firebase + Google Play referrer. iOS uses SKAN 4 postbacks (three windows: 0–48h, 3–7 days, 8–35 days) plus modelled data for events outside the postback windows. Configure your SKAN conversion value schema in your MMP before launch — a poorly mapped schema produces unusable optimisation data.
- Meta attribution: Android mirrors UAC via MMP postback. iOS uses SKAN 4 alongside Meta's Aggregated Event Measurement (AEM). Meta recommends configuring a maximum of 8 conversion events in your AEM priority list — rank by business value, not frequency. Misranked AEM events produce misaligned campaign optimisation.
- CPI network attribution: Standard MMP postback. The critical requirement: enable fraud protection rules on every CPI network partner before campaign start. Run AppsFlyer Protect360, Adjust Fraud Prevention Suite, or Singular's fraud detection — not vendor-supplied attribution. Self-reported attribution from CPI networks is systematically biassed toward over-counting installs.
Fingerprinting sunset impact: Apple's deprecation of probabilistic fingerprinting still affects attribution completeness for iOS campaigns across all three channels. In 2026, iOS attribution accuracy on Meta and CPI networks runs 60–75% of actual install volume in most MMP dashboards — the remainder is either unattributed organic or modelled. Plan for this gap in your channel comparison methodology; do not penalise iOS campaigns for attribution gaps that are structural, not performance-related.
SKAN 4 specific setup requirements:
- Fine conversion values (0–63) for the first postback window — map your highest-value early actions here
- Coarse conversion values (low/medium/high) for windows 2 and 3 — map revenue tiers
- Source app identifier (4-digit) for placement-level signals — useful for CPI network publisher quality analysis
- Lock-window configuration in your MMP — do not use default settings; customise for your app's engagement timing
For a full MMP setup walkthrough across all three channels, see our portfolio case studies which cover attribution architecture for fintech, gaming, and utility verticals.
How should you split budget across channels by growth stage?
For an app at any scale, never put more than 70% of paid budget on a single channel. Algorithm changes, audience saturation, and platform pricing shifts make single-channel dependence the most common cause of sudden CPI inflation we see across our portfolio. The 2023 Meta iOS targeting degradation and the 2024 UAC bidding algorithm update both produced 30–80% CPI spikes for teams concentrated on a single channel — diversified portfolios absorbed the same changes with 10–20% blended CPI movement.
Starting allocation framework by stage:
- 50% on the dominant channel for your vertical (UAC or Meta based on the vertical table above).
- 30% on the secondary channel — whichever of UAC/Meta is not dominant for your vertical.
- 10% on CPI or programmatic for tactical bursts and geographic fills.
- 10% on experiments — new channel tests, new audience tests, new creative formats, new geographies.
The 10% experiment budget is the most commonly cut line item under pressure and the most correlated with sustained growth. Cutting experiments protects this quarter and starves next quarter. We have watched apps fall from category top-20 to outside top-100 within six months of eliminating their experiment budget — the channel mix becomes a static asset while competitors iterate.
Reallocation cadence: Monthly, based on rolling 7-day blended CPA. Channels hitting CPA targets get budget bumps; misses get cuts. Do not over-reallocate week-to-week — auction dynamics fluctuate and short-window decisions add noise without improving outcomes.
Pro tip — optimise on cost-per-retained-user, not raw CPI
CPI networks consistently show the lowest face CPI and the worst D30 retention across our portfolio. The actual cost per active user at day 30 is often 2–3 times higher than UAC despite the headline price difference. Always optimise on cost-per-retained-user at D7 or LTV/CAC ratio — never on raw CPI alone.
Budget minimums that matter:
- UAC India: Rs 50K/week minimum to exit learning phase; Rs 1L+/week for reliable optimisation data
- Meta Advantage+ India: Rs 40K/week minimum; Rs 80K+/week for creative rotation testing
- CPI network burst: Rs 50K minimum for a meaningful ranking test; Rs 3–15L for a market-moving burst
- Western markets: Multiply by 3–5 times for equivalent install volume
Below these minimums, results are too noisy to compare channels fairly. An underfunded UAC campaign that fails to exit learning is a budget failure, not a channel failure — do not draw channel conclusions from campaigns that never had enough spend to stabilise.
What does a 30-day channel evaluation framework look like?
A fair channel comparison requires 30 days minimum per channel after the learning phase exits. Comparing CPIs at week one is comparing learning-phase noise, not equilibrium performance — it is the single most common decision-making mistake we see teams make. We have seen teams pause campaigns that would have reached CPA targets by day 21 simply because day-7 CPIs looked bad.
The 30-day framework we use across portfolio reviews:
- Days 1–7: Learning phase. Do not draw conclusions. CPIs are inflated by 30–80% above equilibrium, conversion data is sparse, the algorithm is actively exploring. Do not pause based on week-one numbers.
- Days 8–14: Stabilisation. CPIs should drop 20–40% from week-one peaks as the algorithm converges. Identify which creatives are pulling weight — pause the bottom quartile, scale the top quartile by 2 times. On Meta, add fresh creative variants to prevent early fatigue.
- Days 15–21: Optimisation. Consider switching UAC from tCPI to tROAS if you have 30+ in-app revenue events. Layer in custom audiences and lookalikes on Meta. Add new geographies on channels showing strong economics. Begin MMP cohort analysis to compare retention across channels.
- Days 22–30: Measurement. Calculate cost-per-retained-user at D7 and D14 for each channel. This is the number that determines next month's budget allocation — not face CPI. The channel with the lowest cost-per-retained-D7 earns the budget increase.
Metrics to track per channel (measured at day 30, blended over the full window):
- Blended CPI (face value — context only)
- D1, D7, D14 retention by channel cohort
- Cost-per-retained-user at D7 (primary decision metric)
- ARPU/LTV by channel cohort (if economics support measurement)
- MMP fraud-flag rate per channel and publisher
- SKAN 4 conversion value distribution (iOS-specific)
The most important sanity check: compare retention by channel cohort against your organic baseline. A channel running at 80%+ of organic retention is high quality. Below 50% indicates either poor audience match or fraud — investigate before scaling. AppsFlyer's Performance Index and data.ai's market insights both publish annual retention benchmarks by channel and category useful for cross-industry calibration.
Run this framework quarterly. Channel performance shifts with platform changes, creative fatigue, and seasonal demand. The mix that worked last quarter is rarely optimal next quarter — the teams that win run the framework every 90 days rather than annually. For a managed evaluation across your live channels, talk to our team or review our portfolio case studies to see how we have applied this framework across fintech, gaming, and utility verticals.
If you are building your first multi-channel stack, our guide to getting your first 10K installs covers the full channel sequencing for early-stage apps, and our mass user acquisition strategy guide covers how to scale beyond 100K installs without blowing your blended CPA.
Frequently Asked Questions
Which channel has the lowest CPI in India in 2026?+
CPI networks are cheapest at face value (Rs 3–12 for non-incentivised Tier-2/3 fills), but lower retention often makes them more expensive per retained user. Google UAC typically delivers the best blended cost-per-retained-user at scale — Rs 12–35 for utility and fintech in India — because the algorithmic optimisation compounds over time in a way fixed-CPI networks cannot match.
Should I use Meta Advantage+ broad targeting or detailed interest targeting?+
Broad targeting — country + age band only — consistently outperforms interest stacking on Advantage+ App Campaigns. Meta's own guidance recommends this, and across our portfolio we see CPIs 40–60% higher on interest-stacked campaigns versus pure broad targeting. Remove interest targeting entirely and let the Advantage+ algorithm work as designed.
How does SKAN 4 affect the Google UAC vs Meta performance comparison?+
SKAN 4's three postback windows and coarse conversion values affect both channels on iOS but in different ways. UAC uses SKAN 4 plus modelled data via Google's on-device signals. Meta uses SKAN 4 alongside its own Aggregated Event Measurement (AEM) framework. Both produce attribution gaps of 25–40% versus actual iOS install volume — plan for this in your channel comparison and do not penalise iOS campaigns for structural attribution gaps.
Are CPI networks safe for a growth-stage app?+
Reputable non-incentivised CPI networks are safe and widely used by major apps. The vendor matters far more than the channel category — vet every network on D7 retention parity with organic before scaling. Enable MMP fraud detection from day one and flag any publisher with D1 retention below 3% or IVT rates above 5%. Bottom-tier networks are high-risk; top-tier vetted networks are production-safe.
When should I add Apple Search Ads to my channel mix?+
Whenever iOS represents 25%+ of your install target. ASA captures bottom-of-funnel intent at the highest-intent moment in the App Store discovery funnel — users searching your category keyword right now. D7 retention from ASA typically runs 20–40% above Google UAC cohorts in iOS-heavy apps. The CPI is higher than display channels but install quality justifies the premium.
How long before I can fairly compare these channels?+
Minimum 30 days per channel after the learning phase exits — so 35–44 days total from campaign launch including learning phase. Earlier comparisons are dominated by learning-phase noise. The most common mistake we see is pausing campaigns at day 7 based on inflated learning-phase CPIs that would have normalised by day 14–21.
How much budget do I need to run a meaningful three-channel test in India?+
Minimum Rs 50K/week per channel (Rs 1.5L/week total for UAC + Meta + CPI) to produce statistically meaningful data. Below that threshold, results are too noisy to compare channels fairly. An underfunded UAC campaign that fails to exit learning is a budget failure, not a channel failure — do not draw channel conclusions from campaigns that never had enough spend to stabilise.
Sources
- Google Ads — App Campaigns Help — Official UAC documentation covering bidding strategy, creative asset requirements, and campaign structure
- Google Ads — App Campaigns Best Practices — Updated 2026 asset library and creative volume recommendations for UAC
- Meta — Advantage+ App Campaigns Documentation — Official Meta guidance on broad targeting, AEM configuration, and Advantage+ setup
- AppsFlyer Performance Index — Quarterly retention and ranking benchmarks by channel, vertical, and geography
- AppsFlyer State of App Marketing — Annual benchmarks for channel mix, IVT fraud rates, and category performance
- Adjust Resources — Mobile Attribution — MMP attribution documentation covering SKAN 4 configuration and fraud prevention
- Singular Resources — UA Analytics — Multi-channel attribution methodology and ROI benchmarks across paid UA channels
- data.ai Market Insights — Mobile market data on install volumes, category benchmarks, and channel performance by geography
About the author
Amol Pomane — Founder, Vmobify
Amol leads Vmobify, a mobile app growth agency that has driven 30M+ downloads and ranked 54K+ keywords across 300+ apps since 2013. He writes about ASO, paid user acquisition, retention, and the operational reality of scaling mobile apps in India and global markets.
Free Growth Audit
See exactly how to scale your app with 13+ years of expertise behind you.
Get My Strategy

