LTV vs CAC: Calculator, Benchmarks, and How to Use the Ratio
LTV-to-CAC ratio is the single most important number for app marketing decisions. Here is how to calculate it correctly, the benchmarks for your category, and what to do when the ratio breaks.

Why does the LTV-to-CAC ratio matter so much?
LTV-to-CAC is the single most important number in app marketing because it tells you, in one ratio, whether each acquired user is worth more than you paid for them, by how much, and how aggressively you are allowed to scale. Every other metric — CPI, CTR, install volume, ROAS day-7 — is just an input that eventually rolls up into this one ratio.
The ratio breakpoints are unforgiving and well-understood across the industry:
- Ratio < 1: You lose money on every user you acquire. Scaling spend simply accelerates the bleed. Most teams in this zone do not realise it until 90 days of data lands.
- Ratio 1-1.5: Break-even territory. There is no margin to fund the next cohort of growth, salaries, or product investment. Functionally a no-go.
- Ratio 1.5-3: Healthy. Sustainable growth is fundable from operating cash flow and the business compounds.
- Ratio 3+: Exceptional. Scale aggressively — every rupee deployed into UA returns 3+ rupees of contribution margin.
This is not theoretical. AppsFlyer's State of App Marketing consistently shows that the apps which compound year after year sit in the 2.5-4x band, while the apps that flame out after a Series A typically had a sub-1.5x blended ratio they were quietly subsidising with venture money. The ratio is also the number every sophisticated investor will ask for first in a fundraise — sometimes before they ask what the app actually does.
Across the 300+ apps we have worked with at Vmobify since 2013, every successful scaling story has the same shape: founders measured LTV:CAC honestly, segmented it by channel, and made hard cuts on the losers. Every failure story involved either ignoring the ratio entirely or massaging the inputs to make it look better than it was. There is no third path.
One more nuance most teams miss: the ratio is a decision-making tool, not a vanity metric. It only matters if you actually change spend allocation based on what it tells you. A weekly LTV:CAC review that does not lead to channel-level budget shifts within 30 days is a ritual, not a system. The teams that win treat the ratio the way a trader treats a P&L — read it daily at the cohort level, act on it weekly at the channel level, and rebuild the model quarterly as retention curves and category CPIs move.
How do you calculate LTV for a mobile app?
The base LTV formula is ARPU × Average Customer Lifetime, but the version that survives contact with reality requires four additional refinements that most teams skip.
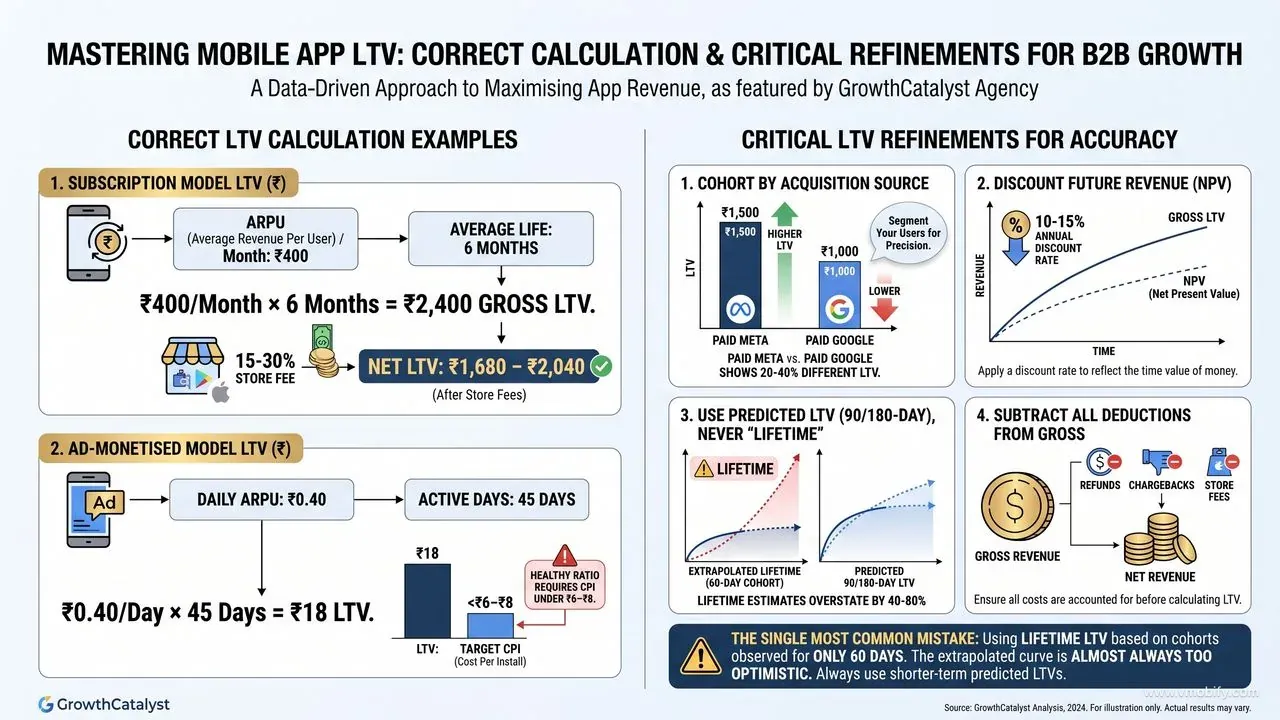
Subscription example: An OTT or fitness app with ₹400/month ARPU and a 6-month average subscription life produces ₹400 × 6 = ₹2,400 LTV per paying user. Net of Apple/Google's 15-30% store fee per App Store Connect's published commission structure, the take-home is closer to ₹1,680-₹2,040 — and that is the number that should feed your ratio, not the gross.
Ad-monetised example: A casual game earning ₹0.40 daily ARPU from rewarded video and interstitials, with users active 45 days on average, lands at ₹0.40 × 45 = ₹18 LTV. For an ad-monetised app that LTV has to support a CPI under roughly ₹6-8 to deliver a healthy ratio — a brutal constraint that explains why hyper-casual scaling is so dependent on India and other low-CPI geographies.
Refinements that separate real LTV from fantasy LTV:
- Cohort by acquisition source. Paid Meta users routinely show 20-40% different LTV than paid Google users for the same app. Blending them hides which channel deserves more budget. We segment all UA programmes at the source level by default.
- Discount future revenue. ₹1 today is worth more than ₹1 in 12 months. Apply a 10-15% annual discount rate when projecting beyond month 3. This is basic finance, frequently skipped in growth teams.
- Use 90-day or 180-day predicted LTV — never "lifetime." Lifetime estimates are unfalsifiable for 18+ months and reliably overstate value by 40-80%. Adjust's pLTV research shows model accuracy drops sharply past 180 days for almost every vertical.
- Subtract refunds, chargebacks, and store fees from gross revenue. Refund rates of 5-15% are common in EdTech and subscription apps; ignoring them inflates LTV by exactly that much.
In our portfolio, the single most common LTV mistake is using a "lifetime" number based on cohorts that have only been observed for 60 days. The model extrapolates a curve, and the curve is almost always too optimistic. We force every client model back to 90/180-day predictions before any scaling decision gets signed off.
How do you calculate CAC correctly?
CAC is total marketing spend divided by paying customers acquired in the same period — and the most damaging mistake in the entire ratio is confusing it with CPI. CPI is cost per install; CAC is cost per paying customer. If 5% of your installs convert to paid, your CAC is 20× your CPI. A ₹50 CPI quietly becomes a ₹1,000 CAC, and many teams have never honestly done that arithmetic.
What belongs inside the CAC numerator:
- All paid media spend — Google App Campaigns, Meta Advantage+, TikTok, programmatic DSPs, CPI networks, Apple Search Ads
- Creative production cost, amortised over the period it runs. UGC video shoots, motion design, and copy testing all count.
- Influencer and affiliate fees — both flat and performance
- Marketing technology spend (MMP licences such as AppsFlyer or Adjust, analytics tools, A/B testing platforms) — amortised per acquired customer
- Marketing salaries, amortised. Often excluded in early-stage CAC; always included in mature-company calculations and definitely included by any acquirer doing due diligence.
Blended CAC vs paid CAC: Blended divides total marketing spend by all new paying customers (paid + organic). Paid CAC divides paid spend by only paid-attributed paying customers. Use blended for board reporting and overall business health; use paid CAC for channel-level scaling decisions. Mixing the two — for example, dividing paid spend by all customers — is one of the most common ways teams flatter themselves into believing a channel is profitable when it is not.
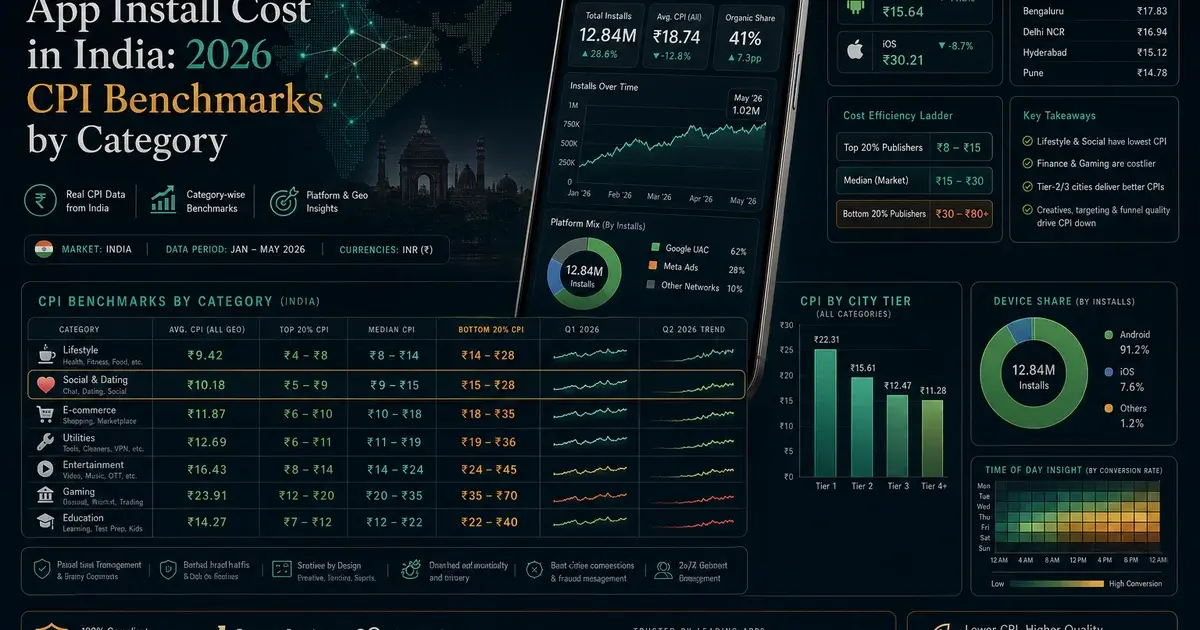
For Indian apps specifically, blended CAC tends to look 30-60% better than paid CAC because organic install share is high. That is fine for narrative but dangerous for budget decisions. We covered the underlying CPI economics in detail in our India CPI benchmark guide.
What are realistic LTV:CAC benchmarks by category?
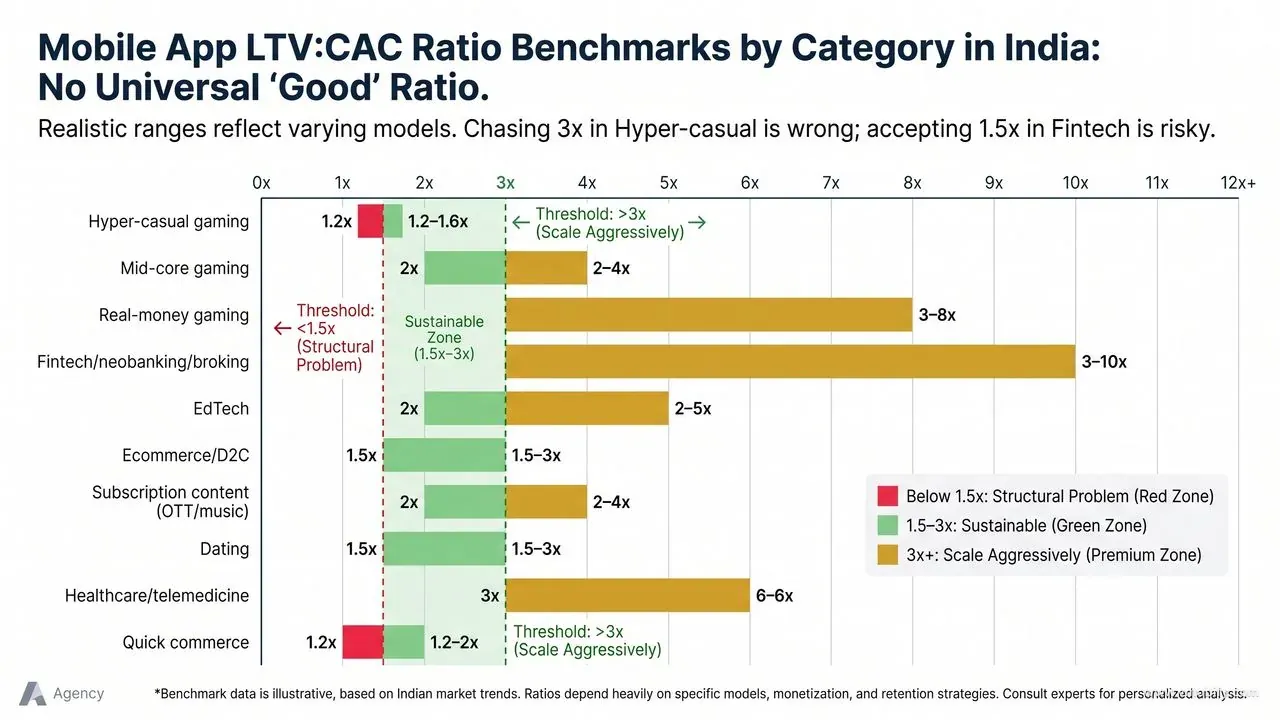
Sustainable LTV:CAC ratios vary wildly by category — there is no universal "good" number, and chasing a 3x ratio in a hyper-casual game is as wrong as accepting a 1.5x ratio in fintech. Here are the bands we see across our portfolio and corroborated by published industry data:
- Hyper-casual gaming: 1.2-1.6x — thin margins, scale to win, every percentage point of CPI matters
- Mid-core gaming: 2-4x — IAP-driven, depends heavily on whale retention
- Real-money gaming (RMG): 3-8x — highest LTV in the industry, also the highest CAC
- Fintech / neobanking / broking: 3-10x — long lifetimes, expensive to acquire, regulated environment per SEBI guidelines
- EdTech: 2-5x — wide range driven by refund rates and completion behaviour
- Ecommerce / D2C: 1.5-3x — frequency-led, dependent on repeat rate
- Subscription content (OTT, music, news): 2-4x — annual plans push ratios upward
- Dating: 1.5-3x — high churn caps LTV; lifecycle marketing is the lever
- Healthcare / telemedicine: 3-6x — long lifetimes once trust is established
- Quick commerce: 1.2-2x — frequency-led, thin per-order margin, profitable only at high order velocity
Anything below 1.5x sustained for more than two quarters indicates a structural problem in the business model, not a marketing problem. No amount of creative testing or bid optimisation will fix an LTV that is fundamentally too low for the category's CPI auction. Sensor Tower's category benchmarks regularly track CPI movement by vertical and are a useful cross-check on whether your numbers are at, above, or below the market norm.
What should you do when the ratio is too low?
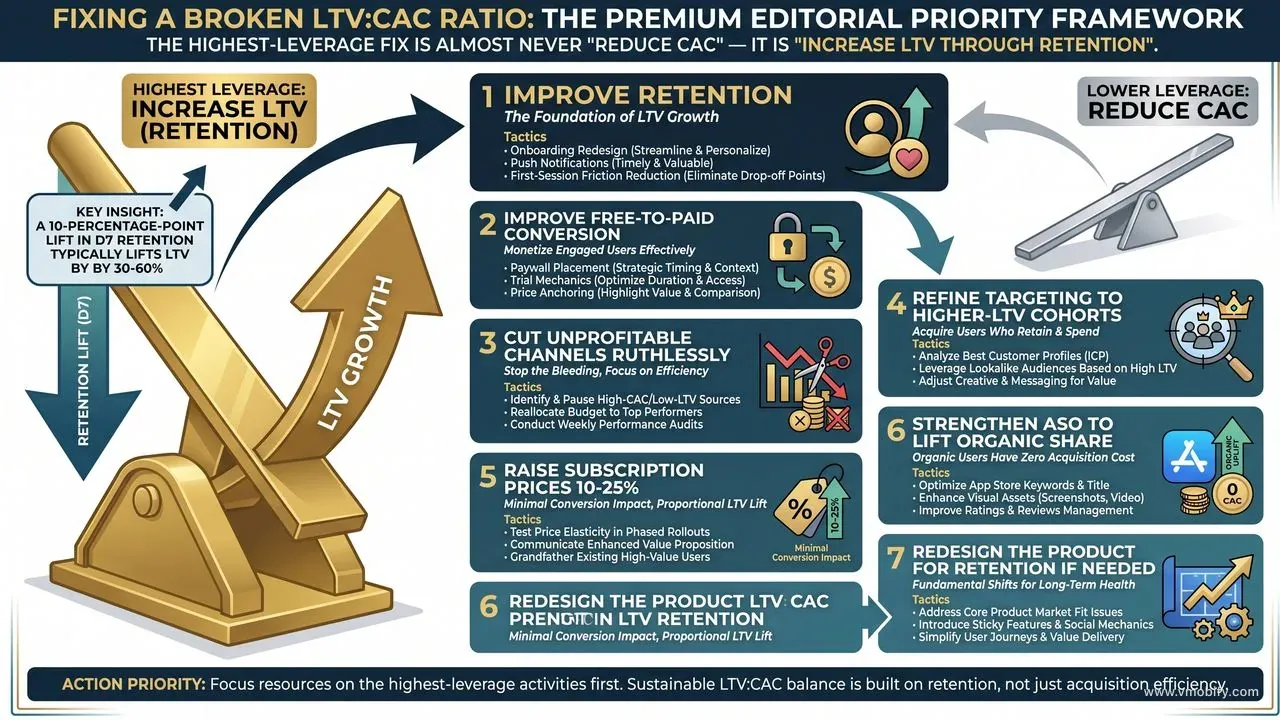
If LTV:CAC is consistently below 1.5x, the single highest-leverage fix is almost never "reduce CAC" — it is "increase LTV through retention." A 10-percentage-point lift in D7 retention typically lifts LTV by 30-60% because users stay through more monetisation cycles. Cutting CPI by 30% rarely delivers a comparable LTV multiplier.
In rough priority order, here is what to do:
- Improve retention first. Onboarding redesign, push notification strategy, first-session friction reduction. This is where to spend product time before spending more marketing money.
- Improve free-to-paid conversion. A 50% lift in free-to-paid conversion doubles LTV with zero change to acquisition cost. Paywall placement, trial mechanics, and price anchoring are usually undertested.
- Cut unprofitable channels ruthlessly. Some channels deliver users whose LTV is structurally lower than others — even if their CPI looks cheap. The cheap CPI is often what is causing the LTV problem.
- Refine targeting to higher-LTV cohorts. Geography, age band, device class, lookalike seeds based on paying users rather than installers. Our UA team rebuilds lookalike audiences from payer cohorts as a default optimisation.
- Raise prices on subscription apps. A 10-25% price increase typically has minimal effect on conversion but lifts LTV proportionally. This is the single most under-used lever in app monetisation.
- Strengthen ASO to lift organic share. Organic users have effectively zero acquisition cost and lift the blended ratio without any media spend change.
- Redesign the product for retention. If the product cannot retain at category benchmark, no marketing tactic will fix LTV:CAC sustainably. This is the hardest fix, and sometimes the only one.
Across our portfolio, the pattern is consistent: the apps that fix LTV:CAC sustainably do it through retention and conversion work; the apps that try to fix it only through CAC reduction stall within two quarters and end up cutting growth investment instead. See our app retention strategy guide for the specific tactics that move D1, D7, and D30 numbers.
Which calculation mistakes break the ratio most often?
Most "we hit our target LTV:CAC" claims fall apart under five minutes of audit because of one of the same five mistakes — every time.
- Using lifetime LTV instead of 90/180-day: Predicting too far into the future inflates LTV and creates false confidence. The further out you project, the wider the error bars, and most pLTV models lose accuracy fast beyond 180 days.
- Ignoring refunds, chargebacks, and store fees: Gross revenue is not net revenue. Apple and Google take 15-30% per App Store Connect's commission terms; refund rates of 5-15% are routine. Inflating LTV by 25%+ with this mistake is common.
- Including organic customers in paid CAC: Makes paid CAC look better than it is, which causes overspend on the channels that already had the best blended look. Always isolate paid-attributed customers in the paid CAC calculation.
- Excluding creative production cost: Modern UA is entirely creative-led. UGC shoots, motion design, copy testing, and platform-specific cutdowns all cost real money. Excluding them understates CAC and quietly subsidises the creative team.
- Not segmenting by cohort or channel: A blended LTV:CAC of 2.0x can hide one channel running at 4.5x and another at 0.8x. Without segmentation, you cannot scale the winners or cut the losers — and the blended number gives no actionable signal at all.
Across the 300+ apps we have audited, at least one of these five mistakes shows up in roughly 80% of incoming LTV:CAC numbers. Fixing the calculation often changes the strategic picture more than any new tactic. Get an LTV:CAC audit for your specific app, or browse our case studies to see how the corrected numbers reshaped scaling decisions for apps in your category.
Frequently Asked Questions
What is a good LTV-to-CAC ratio target?+
3x is the commonly-cited target. In reality 1.5-3x is sustainable for most app categories; below 1.5x means structural issues, above 3x means you can scale aggressively.
How long should I calculate LTV over?+
90 days for fast-cycle apps (commerce, content). 180 days for subscriptions. 12 months only for very mature businesses with stable retention curves and 18+ months of cohort history.
Should I include organic users in CAC calculations?+
Use both — blended CAC for board reporting and business health, paid CAC (paid spend divided only by paid-attributed customers) for paid channel scaling decisions specifically.
When should I cut a paid channel?+
When that channel's cohort LTV is below the channel's CAC consistently over 30+ days. Single bad weeks are noise; 30-day rolling cohorts give a reliable signal.
How does churn affect LTV?+
Massively. A 10% reduction in monthly churn rate typically lifts LTV 30-50% because users stay paying for many more cycles. Retention work almost always outperforms CAC work for fixing the ratio.
What is the difference between CAC and CPI?+
CPI is cost per install; CAC is cost per paying customer. If 5% of installs convert to paid, CAC is 20x CPI. Treating CPI as CAC is one of the most common — and most expensive — mistakes in app marketing.
Should marketing salaries be included in CAC?+
Yes for mature companies and any due-diligence-grade calculation. Often excluded in early-stage reporting to keep the number clean, but an honest fully-loaded CAC always includes them.
Sources
- AppsFlyer Performance Index — Quarterly LTV, retention and CPI benchmarks segmented by vertical and geography
- AppsFlyer State of App Marketing — Aggregated LTV:CAC and unit-economic benchmarks across categories
- Adjust Mobile App Trends — pLTV model research and accuracy degradation past 180 days
- Sensor Tower State of Mobile — CPI movement and category benchmarks for cross-checking acquisition cost
- Apple App Store Connect — Official documentation on 15-30% store commission structure
- Google Ads — App Campaigns Help — UAC bidding, tCPA and tROAS setup that feeds CAC measurement
- SEBI — Regulatory environment shaping fintech / broking CAC in India
About the author
Amol Pomane — Founder, Vmobify
Amol leads Vmobify, a mobile app growth agency that has driven 30M+ downloads and ranked 54K+ keywords across 300+ apps since 2013. He writes about ASO, paid user acquisition, retention, and the operational reality of scaling mobile apps in India and global markets.
Free Growth Audit
See exactly how to scale your app with 13+ years of expertise behind you.
Get My Strategy