App Retention Benchmarks 2026: D1/D7/D30 by Industry
A reference table of D1, D7 and D30 retention benchmarks by industry for 2026 — social, fintech, productivity, gaming and e-commerce — plus the "7% rule" and how to read your own numbers without fooling yourself. The data, not the playbook.

Why benchmark retention by industry rather than against a global average?
Retention rates vary by 4–5x across app categories, so a single "average app retention rate" is a number that describes no real app — the only comparison that produces a decision is your app against your category's median. A 6% D30 retention rate is excellent for an e-commerce app and a disaster for a social app, and no blended figure can tell those two situations apart.
This post is a reference asset, not a how-to. It exists to answer one question precisely — "what retention numbers are normal for an app like mine in 2026?" — so you can place your own cohorts on a credible scale before you spend a rupee deciding what to do about them. If you already know where you stand and want the interventions, our app retention strategy playbook covers onboarding compression, push sequencing and churn prediction in depth. Keep the two separate in your head: this is the map, that is the route.
The reason a global average misleads is structural. Different categories ask different things of a user. A messaging app is used because the people you talk to are on it, which makes its retention curve naturally high and sticky. A retail app is opened when you happen to want to buy something, which makes its curve naturally low and spiky — and that is not a failure, it is the shape of the demand. Comparing the two on one axis is like comparing a cardiologist and a sprinter on resting heart rate. The context is the whole point.
The figures throughout this guide are directional industry ranges aggregated from published benchmark studies — chiefly UXCam's mobile app retention benchmarks, AppsFlyer's Performance Index and Adjust's mobile benchmark data — cross-checked against our own portfolio. Treat every number as a band, not a target line. Across our 300+ apps managed since 2013, the single most common analytics mistake we see is a team celebrating or panicking over a retention number they never benchmarked against the right peer set.
What are D1, D7 and D30 retention benchmarks by industry in 2026?
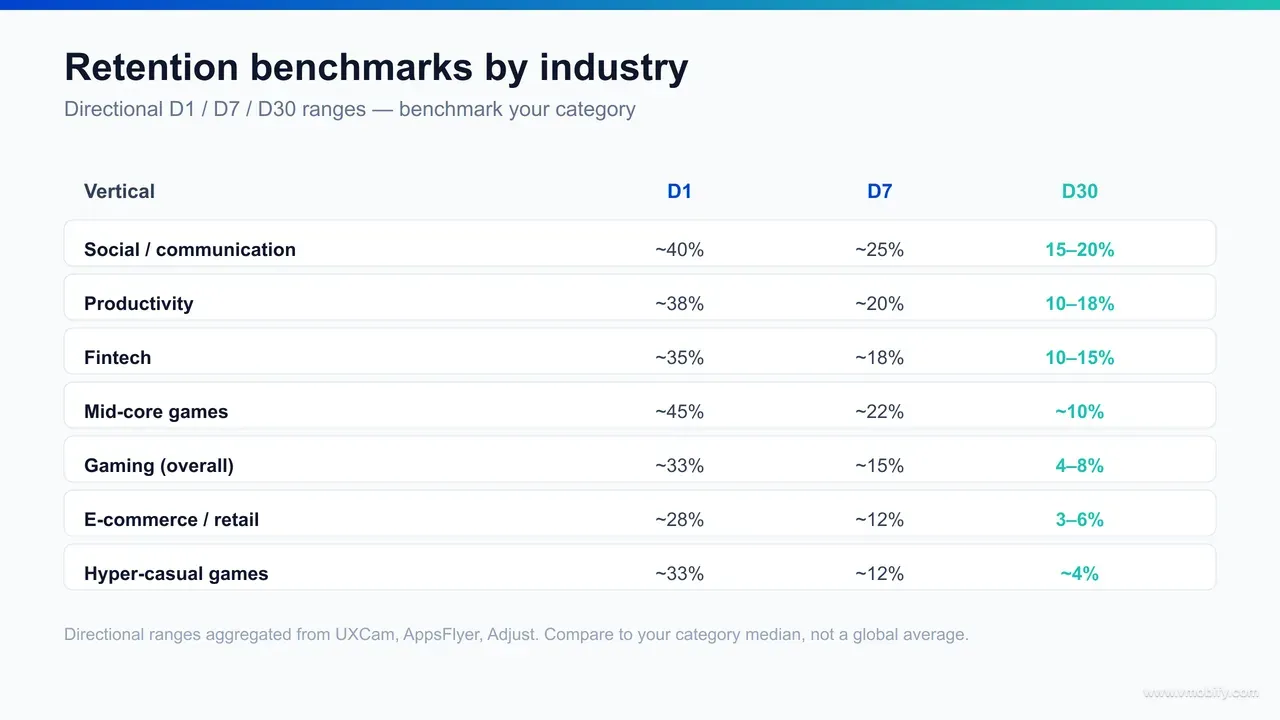
By Day 30, directional retention ranges in 2026 are roughly: social and communication apps 15–20%, fintech and banking 10–15%, productivity and utility 10–18%, gaming 4–8% and e-commerce or retail 3–6% — with hyper-casual games sitting at the very bottom of the gaming band. D30 is the most differentiating checkpoint because it strips out the curiosity installs and shows you only the users for whom the app earned a durable place.
Here is the reference table, expressed as ranges. Anchor on D30 — it is where categories separate most clearly — and read each band as "normal," not "good":
- Social & communication: D30 ~15–20%. The stickiest consumer category, because the network effect does the retaining for you.
- Productivity & utility: D30 ~10–18%. Wide band — a daily-use tool retains like social, a once-a-month utility retains like retail.
- Fintech & banking: D30 ~10–15%. Necessity-driven and account-anchored, but with longer natural gaps between sessions than social.
- Gaming (overall): D30 ~4–8%. A broad church — mid-core and strategy titles reach the top of this band and beyond, hyper-casual sits at the floor.
- E-commerce & retail: D30 ~3–6%. Intent-driven and intermittent by nature; the curve is spiky and low, and that is the category norm rather than a fault.
Two things to hold onto when you use this table. First, these are directional bands drawn from cross-industry studies — your own median, measured on your own cohorts, always beats a published figure for decision-making. Second, the spread between categories (a ~5x gap from social to e-commerce at D30) is larger than the spread you will ever realistically close through optimisation inside your own category. That is exactly why the comparison has to be like-for-like: the category sets the realistic ceiling, and your work is to reach the top of your own band, not someone else's.
What are retention benchmarks for verticals beyond the core five?
Beyond the five headline categories, directional D30 ranges in 2026 look roughly like this: music and audio streaming sits near the top alongside social at ~15–22%, edtech at ~12–18%, news and content at ~10–15%, food delivery at ~8–14%, dating at ~5–10%, and health & fitness, travel and one-off transactional apps at the bottom near ~3–7% — every figure a directional band that varies materially by source and by how each study defines an "active" user. Treat these as neighbourhoods rather than addresses; the behavioural logic behind each band predicts where an app lands better than the category label does.
Read each vertical through the question "what makes a user come back?" — habit, intent or obligation — because that is what sets the band:
- Music & audio streaming: directional D30 ~15–22%. Among the stickiest consumer categories, because listening is daily, passive and habit-anchored — the app becomes background infrastructure rather than a destination. It sits in or near the social band for the same network-and-habit reason.
- Edtech (K-12 and upskilling): directional D30 ~12–18%, and a wide band. Streak mechanics and a course-completion arc create genuine habit for committed learners, while casual sign-ups churn within the first week — so the median hides a steep split between the two cohorts.
- News & content: directional D30 ~10–15%. Habitual daily readers retain like a utility; headline-chasers acquired from a single viral story churn almost immediately, which is why blended news retention swings with the acquisition source more than almost any other vertical.
- Food delivery: directional D30 ~8–14%. Once a user adopts the app as their default for a recurring need it is genuinely sticky, but acquisition frequently pulls in coupon-hunters who churn the moment the first-order discount expires — a classic case where blended retention understates the retained core.
- Dating: directional D30 ~5–10%, and unusually spiky. The category has a structural quirk no other vertical shares: the product succeeding for a user — a match, a relationship — is itself a churn event. Even a healthy dating app shows low long-run retention by design, so the band must be read against that built-in ceiling.
- Health & fitness: directional D30 ~3–7%. Among the lowest-retaining consumer categories because the intention-to-action gap is brutal: the January install goes silent by February. Strong onboarding and streaks lift the top of the band, but the category floor is low for behavioural reasons no amount of marketing fully solves.
- Travel & one-off transactional (ticketing, insurance, tax): directional D30 ~3–7% on classic N-day — but here the metric itself misleads. Usage is seasonal or episodic by design, so range retention measured over the relevant cycle is the honest read, not D30. We return to why these apps need a different metric in the final section.
Two caveats hold for every band above. First, these are directional ranges drawn from cross-industry studies (UXCam, AppsFlyer, Adjust) and they shift with each study's definition of an active user — so the spread between two sources for the same vertical can be wider than you expect. Second, your own measured cohorts always beat a published figure for any decision. Use the bands to answer "is my number in a plausible neighbourhood for an app like mine?" and nothing more precise than that.
What is the difference between D1, D7 and D30 retention?
D1, D7 and D30 are the three standard retention checkpoints, and each measures a different question: D1 asks whether onboarding landed, D7 asks whether a habit formed, and D30 asks whether the app delivers durable value worth keeping. They are not three readings of the same thing — they are three different diagnostics, and a healthy app needs to pass all three in sequence.
- Day 1 retention is the share of new users who return the day after install. It is decided almost entirely in the first session — by time-to-value and onboarding friction. A weak D1 means users never reached the moment that makes the app worth reopening.
- Day 7 retention is the most diagnostic single number in the funnel. By the end of the first week, the novelty has worn off and only genuine habit survives. Users still active on D7 are several times more likely to remain active at D30, which makes the D1→D7 window the highest-impact stretch of the entire curve.
- Day 30 retention is the durable-value test. It tells you whether the app has become part of a routine or merely survived a curious week. It is the checkpoint that maps most directly to lifetime value and to the unit economics of paid acquisition.
The checkpoints are sequential, and that ordering dictates where you look first. You cannot fix D7 without a solid D1, and you cannot fix D30 without a solid D7 — a leak upstream caps everything downstream. So when a benchmark comparison flags a gap, the diagnosis starts at the earliest checkpoint that falls below its band. If your D1 is healthy but D7 collapses, the problem is habit formation, not onboarding. If D1 itself is below band, no amount of re-engagement effort downstream will help until the first session is fixed.
One measurement note that quietly distorts a lot of benchmark comparisons: "retention" can be measured as classic N-day retention (active on exactly that day), rolling/unbounded retention (active on that day or later), or range retention (active at any point in a window). These definitions produce materially different numbers for the same cohort, with rolling retention always reading higher than classic. Before you compare your figure to any published band, confirm you are measuring the same way the benchmark does — usually classic N-day. We unpack how each of these formulas is computed, and when to reach for which, in the next section — because comparing a rolling number to a classic benchmark is the most common way teams convince themselves they are above average when they are not.
How is app retention actually calculated — classic, rolling or range?
There are three common formulas and they produce different numbers for the same cohort: classic N-day retention counts users active on exactly day N, rolling (unbounded) retention counts users active on day N or any day after, and range (bracket) retention counts users active at any point inside a window — rolling always reads highest and classic lowest, so the formula you pick matters as much as the number it produces. A benchmark comparison is only meaningful when both sides use the same formula, and most teams never check.
The three definitions, and what each is honest about:
- Classic / N-day retention. Of the install cohort, the share active on exactly day N. It is strict, it is the default in most published cross-industry tables (UXCam, Adjust, AppsFlyer), and it is the right lens for habit and cadence diagnosis. Its weakness is that it punishes any app whose natural usage is not daily — a weekly app will look broken on classic D7 even when it is performing perfectly.
- Rolling / unbounded retention. The share of the cohort active on day N or any day after. It is forgiving by construction, always reads higher than classic, and suits low-frequency or episodic apps where a single later session still counts as "retained". It is the most useful lens for lifetime-value questions, but the easiest to quote misleadingly against a classic benchmark.
- Range / bracket retention. The share active at least once inside a defined window — week 2, or days 7–13, for example. It smooths out the day-to-day noise that classic retention is sensitive to, and it is the honest metric for weekly-cadence or seasonal apps. Benchmark range-to-range, never range against a daily classic figure.
Two more details quietly swing the number. The first is the denominator: are you dividing by everyone who installed, or only by users who activated (completed onboarding, reached the first value moment)? An activated-cohort retention rate reads far higher than an install-cohort one, and published tables almost always use the install cohort. The second is the formula itself — Adjust's retention-rate glossary lays out the classic, rolling and range definitions precisely, and confirming which one a benchmark uses takes two minutes and prevents a quarter of wrong conclusions.
The practical rule: choose the formula that matches your app's natural cadence — classic N-day for daily apps, range/bracket for weekly ones, rolling for genuinely episodic apps — then only ever compare against a benchmark computed the same way. Most cross-industry tables report classic N-day, so if your app is intrinsically weekly, classic will understate you and the fix is to benchmark range-to-range rather than to conclude you are below par.
What do retention curves look like for mobile games specifically?
Games make the shape of a retention curve unusually legible, because the genre splits cleanly: hyper-casual titles land around D1 33% / D7 12% / D30 4%, while mid-core and strategy games sit closer to D1 45% / D7 22% / D30 10%. The same two numbers — D1 and D30 — tell two completely different stories, and games are the clearest place to see why the decay matters more than any single checkpoint.
Read the two profiles side by side:
- Hyper-casual: ~D1 33% / D7 12% / D30 4%. These games are designed for high install volume and fast, shallow sessions. The curve drops steeply because the model never depended on long retention — it depends on cheap installs and ad monetisation inside a short window. A 4% D30 here is the business model working as intended, not a leak.
- Mid-core & strategy: ~D1 45% / D7 22% / D30 10%. Progression systems, social mechanics and long-arc goals give users reasons to return for weeks. The curve starts higher and, crucially, flattens later — the D7-to-D30 retention (10% out of 22%) is the tell that a durable cohort exists.
The instructive contrast is the slope between D7 and D30. Hyper-casual loses two-thirds of its D7 users by D30 (12% to 4%); mid-core loses well under half (22% to 10%). Two apps can share a similar D1 and still diverge enormously by D30 because one curve keeps falling and the other flattens. This is the single most important idea in reading retention: the tail tells you more than the head. A high D1 with a steep tail is a leaky bucket; a modest D1 with a flat tail is a real business.
If your game sits below these bands, the fix is genre-specific and lives in the product — core-loop tuning, progression pacing and session design — which sits outside this reference. For the channel and creative side of game growth, our work on user acquisition covers how acquisition quality feeds the top of these curves.
What is the "7% retention rule" and how do you use it?
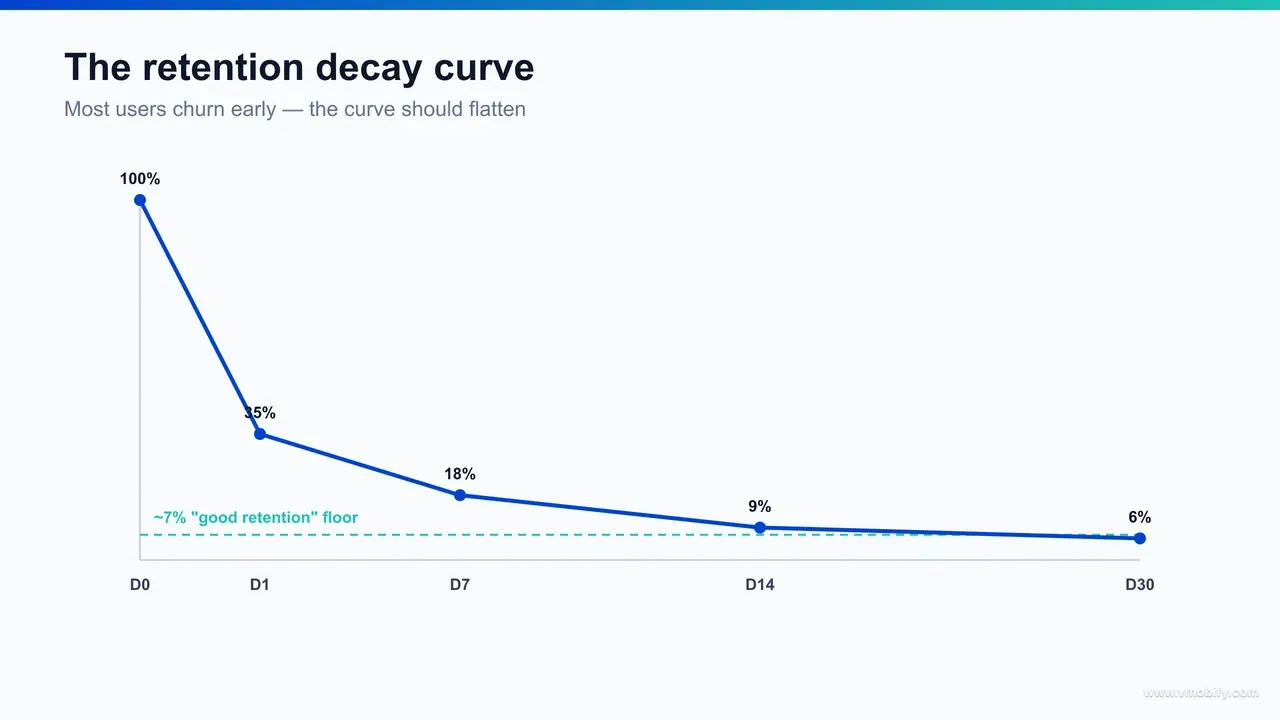
The "7% rule," popularised by Amplitude, is the observation that when a retention curve flattens and holds above roughly 7%, the app has found a core of users for whom it delivers durable value — a directional signal of product-market fit. The rule is not about hitting a magic number on any single day; it is about the curve stopping its fall and settling on a stable plateau.
The mechanism is the flattening, not the threshold. Almost every app loses a large share of users early — that decay is normal. What separates a product with a future from one without is whether the curve eventually stops falling and levels off, or keeps sliding toward zero. A flat asymptote, even a low one, means a real cohort returns indefinitely; that plateau is what compounds into lifetime value and what makes paid acquisition pay back. Amplitude's product analytics research frames ~7% as a directional flattening point above which a consumer app typically has a viable retained base — useful as a sanity check, not a law of physics.
How to use it in practice: stop staring at D1 alone and look at the slope of your curve from roughly D14 onward. Three diagnoses follow. If the curve flattens above ~7% and holds, you have an engaged core — the priority shifts to acquiring more of the users who look like that core. If it flattens but well below 7%, the core is too thin to scale on — the work is product value, not acquisition. If it never flattens at all and keeps trending toward zero, you do not yet have product-market fit, and spending on growth simply pours users into a bucket with no bottom.
Treat the 7% figure as directional and category-aware rather than absolute. A B2B productivity tool with weekly natural usage will plateau at a different level than a daily social app, and the threshold should bend to your usage cadence. The transferable idea is the discipline: judge the flatness of the tail, not the height of the head. In our portfolio, the apps that scale cleanly are almost always the ones whose curve had visibly flattened before paid spend was opened up.
How do iOS and Android retention benchmarks differ?
Across most published studies iOS retention runs a few points higher than Android at every checkpoint — directionally, iOS D30 often lands around 1.2–1.5x its Android counterpart in the same category — but that gap is mostly a device-and-market artefact rather than a verdict on platform quality, and it widens sharply in emerging markets where entry-level Android dominates the install base. Reading the iOS-versus-Android gap as "iOS users are simply more loyal" leads to the wrong fix; reading it as a device-tier and audience effect leads to the right one.
Three structural reasons explain almost all of the gap:
- Audience composition. The iOS base skews toward higher-income users on newer hardware, who tend to retain better in nearly every category regardless of platform. Android spans flagships down to sub-budget devices, so the blended Android number averages two very different populations into one.
- Hardware consistency. iOS runs on a narrow, predictable device range. Android's fragmentation means an app behaves very differently on a flagship than on an entry-level handset with constrained RAM and storage — and inconsistent performance is itself a retention drag.
- Notification reliability. Aggressive battery-saver and OEM notification-management behaviour on low-end Android silently suppresses the push and re-engagement messages that carry users across the D1→D7 gap, so the same retention campaign simply reaches fewer users on those devices.
The operational takeaway is that a premium Android cohort frequently retains much like iOS, while the entry-level tier drags the blended Android figure down — which means you should never compare a blended Android number against an iOS benchmark. Segment by device tier first (the discipline covered in the next section), then compare like with like. In our India-market work, the same app routinely posts iOS-like D7 on premium Android handsets and far weaker numbers on sub-₹10,000 devices; the blend hides both the healthy tier and the broken one.
That pattern scales up to the geography level. In India and other emerging markets where entry-level Android is the majority of the install base, blended retention reads materially below Western benchmarks for structural reasons — device constraints, notification reliability and data cost — not product failure, so judging an India-first app against a US-derived band is simply the wrong comparison. The data observation belongs here; the playbook for actually closing that gap — lite-mode builds, regional-language onboarding, UPI-native flows and festival-cadence campaigns — lives in our companion retention strategy playbook, not in this reference.
How does app retention translate into lifetime value?
Lifetime value is essentially the area under your retention curve multiplied by what each retained user is worth per active day — so two apps with identical revenue-per-user but differently shaped curves produce very different LTV, and the flat tail of the curve, not the height of D1, is what compounds into revenue. This is the financial reason a benchmark anchored on D30 and curve shape matters more than a flattering D1 figure.
The mechanism is geometric. If you sum, day by day, the retained fraction of a cohort multiplied by the revenue that fraction generates per active day, you get cumulative value — which is why LTV tracks the area beneath the retention curve rather than any single checkpoint. A curve that decays to zero encloses a small, bounded area; a curve that flattens above zero encloses a recurring base whose area keeps accumulating for as long as the tail holds. That is exactly why the 7% flattening discussed above is a financial signal and not merely a product one: a sustained two-point lift across the tail compounds into far more revenue than a flashy ten-point lift at D1 that has decayed away by week two.
Crucially, the monetisation model decides which part of the curve you should care about:
- Ad-monetised, high-volume apps (hyper-casual games, much of news) extract most of their LTV in the first days, inside a short, high-frequency window — so a low D30 can be perfectly healthy, because the area that matters sits at the front of the curve.
- Subscription and transactional apps (fintech, SaaS tools, commerce with repeat purchase) live almost entirely off the tail — the D30-and-beyond retention is the business, because revenue accrues from users who keep returning month after month.
The same logic governs whether paid acquisition is sustainable: cumulative LTV has to clear your CAC inside your payback window, and the shape of the retention curve sets both how fast and how high that cumulative-revenue line climbs. The retention-to-LTV relationship is documented across AppsFlyer's State of App Marketing data, which consistently shows top-retention apps achieving dramatically better unit economics on the same media spend. This reference exists to tell you what shape your curve is in relative to peers; turning a better-shaped curve into more revenue — the levers behind it — is the job of the companion retention strategy playbook, not this page.
How do you benchmark your own retention without fooling yourself?
The honest way to benchmark is to compare like-for-like — your category, your retention definition, and your cohorts segmented rather than blended — because a single aggregate number hides every leak that actually matters. Most teams that believe they are "around average" are averaging together cohorts that move in opposite directions, and the blend tells them nothing they can act on.
Four disciplines keep a benchmark comparison honest:
- Match the definition. Confirm the published benchmark uses classic N-day retention and measure yours the same way. Mixing classic and rolling definitions is the fastest route to a flattering, false conclusion.
- Match the category — and the sub-category. "Gaming" spans a 2.5x range from hyper-casual to mid-core. Benchmark a strategy game against strategy peers, not against the genre average that hyper-casual drags down.
- Segment by acquisition source. Organic, paid and incentivised cohorts retain very differently — often 2–3x apart in the same app. A blended retention number can look healthy while a paid channel quietly loses money on a retained-user basis.
- Segment by device tier and geography. In India especially, entry-level Android cohorts retain materially worse than premium devices for performance reasons, which can pull a blended number well below band while your premium tier is fine.
The point of segmentation is that it converts a benchmark from a verdict into a diagnosis. "Our D7 is below band" is not actionable. "Our D7 is at band on organic and iOS but far below on paid-Android" points straight at the fix. This kind of cohorting is core to how our mobile analytics work is set up — the benchmark is only the first cut, and the segments are where the decisions live. The detailed measurement framework, including how to instrument cohorts by source and tier, is laid out in our retention strategy playbook rather than repeated here.
How should you act once you know where your retention stands?
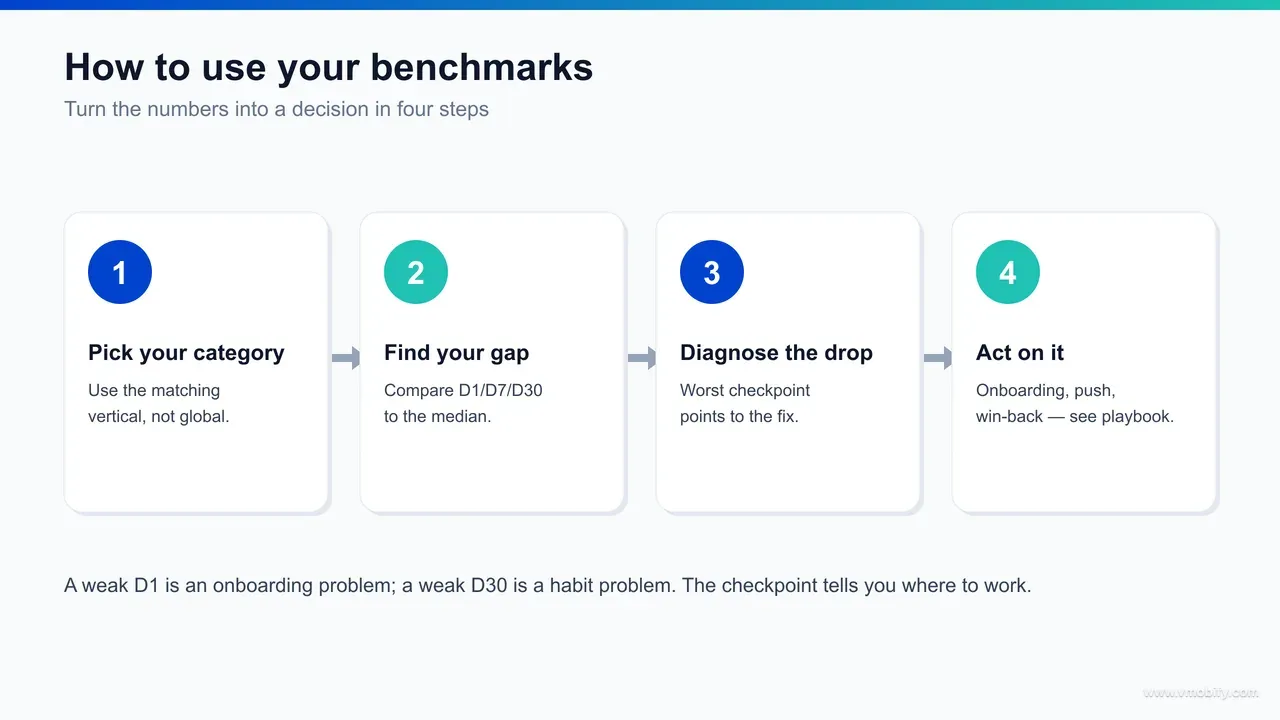
Once you have placed your cohorts against the right band, the benchmark resolves into one of three decisions — fix the product, scale acquisition, or re-examine the channel mix — and which one depends on where the gap sits, not on the headline number. A benchmark tells you whether you have a problem; it does not tell you how to solve it, and conflating the two is where most teams waste a quarter.
Read your position, then route to the right action:
- Below band, all cohorts: the problem is the product, and it is upstream. Start at the earliest failing checkpoint — usually onboarding for a weak D1, or habit mechanics for a collapsing D7 — and fix that before anything else. Scaling acquisition into a leaky curve only multiplies the loss.
- At or above band, curve flattening above ~7%: you have earned the right to scale. The priority moves to acquiring more users who resemble your retained core, which is a user acquisition and targeting problem rather than a retention one.
- At band overall but one segment far below: the problem is channel or device-specific. Adjust the mix — pause the paid source whose retained-user economics fail, or ship the performance work for the device tier that is dragging the blend.
For the actual levers behind each route — compressing onboarding, sequencing push notifications for the D1→D7 window, and predicting churn before it happens — the retention strategy playbook is the companion to this page. This post deliberately stops at "here is your number and what it means"; that one continues to "here is exactly what to do about it." In our portfolio, the teams that move retention fastest are the ones that get this sequence right: benchmark first, diagnose the failing checkpoint, then apply the lever — never reaching for tactics before the data has named the problem.
When do these benchmarks not apply to your app?
Industry benchmarks stop being useful when your app's natural usage cadence, business model or audience differs structurally from the category median — in which case the published band describes a different animal than yours. Knowing when to ignore a benchmark is as important as knowing how to read one, because a confidently wrong comparison is worse than no comparison.
The situations where the standard bands mislead:
- Naturally low-frequency apps. A tax-filing app, an annual-insurance app or a seasonal travel app is used in bursts, by design. Classic N-day retention will read alarmingly low against any band, yet the app may be performing perfectly — range retention over the relevant cycle is the honest metric, not D30.
- B2B and account-anchored tools. Usage follows the work week and the contract, not consumer habit loops. A weekly-active pattern that looks weak on daily checkpoints can represent excellent retention for the use case.
- Pre-product-market-fit apps. Before the curve has flattened at all, benchmarking against a mature category median is premature — the only question that matters is whether the tail is flattening from cohort to cohort, not how you compare to an established peer.
- Radically different monetisation. A hyper-casual game living on a 4% D30 is healthy; a subscription app on the same 4% is failing. The acceptable floor moves entirely with how the app makes money.
The throughline is that benchmarks are a starting reference, never a verdict. Use them to get oriented quickly — "is my number in a plausible neighbourhood for an app like mine?" — and then trust your own segmented cohorts over any published figure for every decision that follows. If you want a retention diagnostic scoped to your specific category, usage cadence and device mix rather than a generic average, that is exactly the work our team does day to day — talk to us and we will benchmark your cohorts against the right peer set, not a blended one.
Frequently Asked Questions
What is a good app retention rate by industry in 2026?+
It depends entirely on the category. At Day 30, directional ranges are roughly: social and communication 15–20%, productivity 10–18%, fintech 10–15%, gaming 4–8% and e-commerce 3–6%. A 6% D30 is strong for retail and weak for social — always compare to your own category band, not a global average.
What is the average D30 retention rate for mobile apps?+
There is no single meaningful average because categories vary by 4–5x. Across consumer apps, D30 retention commonly lands anywhere from about 3% for intent-driven retail to 20% for social. Benchmarking against a blended cross-industry average produces no actionable signal — the category median is the only comparison that helps.
Which retention metric matters most — D1, D7 or D30?+
D7 is the most diagnostic single metric. It marks the point where novelty fades and genuine habit shows, and D7-active users are several times more likely to still be active at D30. That said, D7 depends on a solid D1, and D30 depends on a solid D7 — the checkpoints are sequential, so fix the earliest failing one first.
What is the 7% retention rule?+
It is an Amplitude-popularised idea that when a retention curve flattens and holds above roughly 7%, the app has a durable core of returning users — a directional signal of product-market fit. The key is the flattening of the tail, not hitting an exact number, and the threshold should bend to your app's natural usage cadence.
Why is my retention so much lower than the benchmark?+
Most often the comparison is not like-for-like. Check that you are measuring classic N-day retention the same way the benchmark does, comparing to your sub-category rather than a broad genre, and segmenting by acquisition source and device tier — a blended number frequently hides a single weak paid channel or device cohort.
How does Vmobify use retention benchmarks?+
We use them as the first cut in an analytics diagnosis, then segment cohorts by source, device tier and behaviour to find the real leak. The benchmark says whether there is a problem; the segments say where it is. See our /services/analytics work for how we instrument and read retention cohorts.
Where can I get current retention benchmark data?+
Published cross-industry studies from UXCam, AppsFlyer (Performance Index) and Adjust are the most credible public sources, and Amplitude is the reference for the 7% rule. Treat all of them as directional ranges and validate against your own measured cohorts before making decisions.
Sources
- UXCam — Mobile App Retention Benchmarks — D1/D7/D30 retention ranges by industry vertical
- AppsFlyer — App Marketing Performance Index — Category and geography retention benchmarks
- Adjust — Mobile benchmarks and resources — Cross-category D1/D7/D30 retention and engagement data
- Amplitude — Product analytics blog — Origin of the "7% rule" and retention-curve flattening as a PMF signal
- AppsFlyer — State of App Marketing — Retention by category and the retention-to-LTV relationship
- Adjust — App retention guide — Classic vs rolling vs range retention definitions
- UXCam — Average app retention rate analysis — Why category-level benchmarking beats a global average
About the author
Amol Pomane — Founder, Vmobify
Amol leads Vmobify, a mobile app growth agency that has driven 30M+ downloads and ranked 54K+ keywords across 300+ apps since 2013. He writes about ASO, paid user acquisition, retention, and the operational reality of scaling mobile apps in India and global markets.
Free Growth Audit
See exactly how to scale your app with 13+ years of expertise behind you.
Get My Strategy

