App Soft Launch Strategy: Test Markets, Metrics and Go/No-Go Gates
A soft launch is not a bigger beta. It is a paid, live, revenue-generating test of whether your app can be bought profitably — run in a market small enough that being wrong is cheap. Here is how to pick the market, size the spend, and write the go and no-go gates before you start.
On this page
- What is a soft launch actually for?
- Which countries make good test markets, and why?
- How long should a soft launch run before you decide?
- Which metrics should be your go or no-go gates?
- How much should you spend to get a readable signal?
- What do you do when the numbers say no?
- How do you carry soft-launch learnings into the global launch?
- What breaks when you scale from a test market to a tier-1 market?
- Frequently Asked Questions
What is a soft launch actually for?
A soft launch exists to answer one commercial question — can this app be bought profitably — in a market small enough that being wrong is cheap. Everything else people put in a soft launch belongs somewhere earlier and cheaper.
The confusion is understandable, because three different activities all get called "testing" and they answer completely different questions. Closed testing and TestFlight answer does the software work. A soft launch answers does the business work. And the global launch is not a test at all — it is the moment you commit budget on the strength of what the soft launch told you.
The distinction matters operationally, because teams routinely burn a soft launch on work the free tracks already cover. Apple lets you invite up to 10,000 external testers per app through TestFlight, with up to 100 internal testers in a group. Google Play allows 100 testers on an internal test track, and those testers can be anywhere — Play grants internal testers access even in countries where your production, open or closed testing versions are not available. Closed testing is larger again by an order of magnitude: Play Console Help on setting up an open, closed or internal test permits tester email lists of up to 2,000 people each, with up to 200 lists in the account and up to 50 lists attached to a single track — far more tester capacity than almost any team actually uses. If you are still finding crashes, force-closes and broken sign-up flows, you have not finished the free stage and you should not be spending money on installs yet.
One Google Play rule reshapes the schedule before you have written a line of the plan, and it catches independent developers repeatedly. Under Play Console Help on production access requirements, personal Play Console accounts created after 13 November 2023 must first run a closed test with a minimum of 12 testers opted in continuously for at least 14 days, and then apply for and be granted production access, before they can publish to production at all. The fourteen days have to be consecutive for each tester — someone who opts in, tests for a few days and opts out does not count towards the twelve, and neither does someone who opts out and back in again. Organisation accounts are not subject to it, but if yours is a personal account this is a hard prerequisite sitting in front of every date in the rest of this article. Treat the closed test, the fourteen days and the review of your access application as a scheduled phase of their own rather than a formality you discover in week one.
What a soft launch does that no free track can is put three things in the same measurement at the same time:
- The retention curve under real acquisition. Friends and beta testers retain because they know you. Bought users do not. The shape of the curve from paid traffic is the only shape that predicts anything.
- Monetisation at real prices. Live in-app purchases, live subscriptions, live ads, live refunds. Sandbox purchases tell you the plumbing works; they tell you nothing about willingness to pay.
- Acquisition cost against early value. The ratio between what a user costs and what a user is worth by day 30 is the entire thesis of your business, and it does not exist until you buy traffic.
Across the 300+ apps we have managed since 2013, the teams that get the most out of a soft launch treat it as a paid, live, revenue-generating release that happens to be geographically limited. The teams that get the least treat it as a bigger beta, ship it to a friendly market with no media spend, watch a few hundred organic installs behave beautifully, and conclude they are ready. They are not — they have measured the one cohort that will never be representative.
Category changes the shape of the answer more than anything else. Games, particularly free-to-play games with long monetisation tails, soft launch for months because the metric that decides their fate — the value of a player at day 90 or later — takes months to observe. A utility app with a one-time purchase can settle its question in weeks. A subscription app sits in between, gated by whichever trial length it uses. Decide which of those you are before you set a date, because a game team and a utility team running the same eight-week plan will both be wrong.
Which countries make good test markets, and why?
The right test market is the smallest market that still behaves like your target market — and those two properties pull directly against each other, which is why no published list of "best soft launch countries" is right for every app. Every choice you make is a trade between how cheap the data is and how far it transfers.
The classic markets and the actual reason each one gets picked:
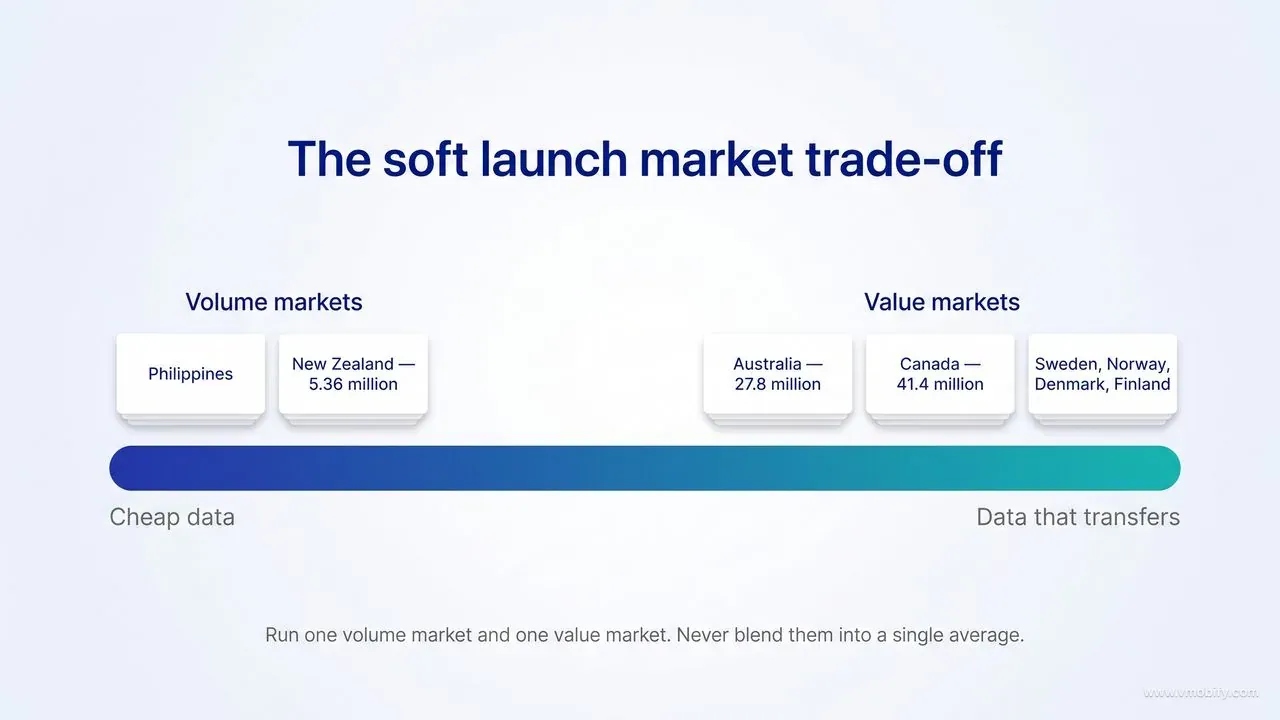
- Canada. The best available proxy for the United States. Statistics Canada's quarterly demographic estimates put the population at about 41.4 million as of 1 April 2026, against a US resident population the Census Bureau estimated at roughly 342 million in mid-2025 — so Canada is about an eighth of the market it stands in for, with English as the working language for most of the country, a similar device mix, a similar competitive set and an ad auction that behaves like the American one. It is the market to pick when your real target is the US and monetisation is the thing you need to read. It is also the market where the cost advantage is smallest.
- Australia. The Australian Bureau of Statistics put the national population at about 27.8 million at 31 December 2025 in its quarterly national, state and territory population release. English-speaking, high income, high card penetration, and a time zone that lets Asia-based teams watch a live market during their own working day. The caveat is a genuinely different competitive landscape — local incumbents in banking, delivery, media and retail that have no US or European equivalent — so category-level reads travel less well than monetisation-level ones.
- New Zealand. Stats NZ put the provisional estimated resident population at about 5.36 million at 31 March 2026 in its national population estimates release. That is the appeal and the problem in one number. It is cheap, English-speaking and behaves like a small Australia, but you can exhaust the addressable audience for a niche app in weeks, and once frequency climbs your install cost stops being a signal about your creative and starts being a signal about market saturation.
- The Philippines. The largest of the classic soft-launch markets by a wide margin, English is an official language, and it is heavily Android. This is the volume market: you can buy a very large cohort for very little, which makes it excellent for reading funnels, onboarding drop-off, crash rates on low-end devices and the shape of an early retention curve. It is a poor predictor of tier-1 revenue per user, and treating it as one is the single most expensive mistake in this whole discipline.
- The Nordics — Sweden, Norway, Denmark, Finland. High income, high smartphone penetration, very high card and digital-payment adoption, and English proficiency good enough that an English build will not collapse. They are the value markets: small enough to be affordable, wealthy enough that a willingness-to-pay read means something. The catch is that store listings genuinely do need localisation to convert, so a Nordic test tells you about your paywall more reliably than it tells you about your store listing.
Say the trade-off plainly, because most guidance dances around it: cheap markets give you cheap data, and cheap data may not transfer. A sub-dollar install in Manila and a mid-single-dollar install in Toronto are not measuring the same user, and no amount of index-adjusting makes one into the other. Those gaps are large — often a five- to ten-fold difference in cost per install between a high-volume Southeast Asian market and a tier-1 English-speaking one — and they are directional rather than fixed, so run your own numbers in your own category rather than borrowing anyone's published figure, this article's included. What you can carry across is behavioural — did people find the core action, did the onboarding hold, did the second session happen. What you cannot carry across is financial.
Which is why the pattern that works in our portfolio is almost always two markets, not one: a volume market that buys you enough users to read the funnel with statistical confidence, and a value market that tells you what a user is actually worth. Run them simultaneously, keep the cohorts strictly separate, and never blend the two into a single average — the blended number describes a country that does not exist.
One operational detail that catches teams out every time: Google Play targets by the country registered to the user's Play account, not by where the device physically is. Per Play Console Help on distributing releases to specific countries, testing tracks also inherit your production country settings by default unless you deliberately unsync them. If your engineering team sits in Bengaluru with Indian Play accounts, they will not see a Philippines-only release on their own phones, and the half-day spent working that out is a half-day nobody budgets for.
How long should a soft launch run before you decide?
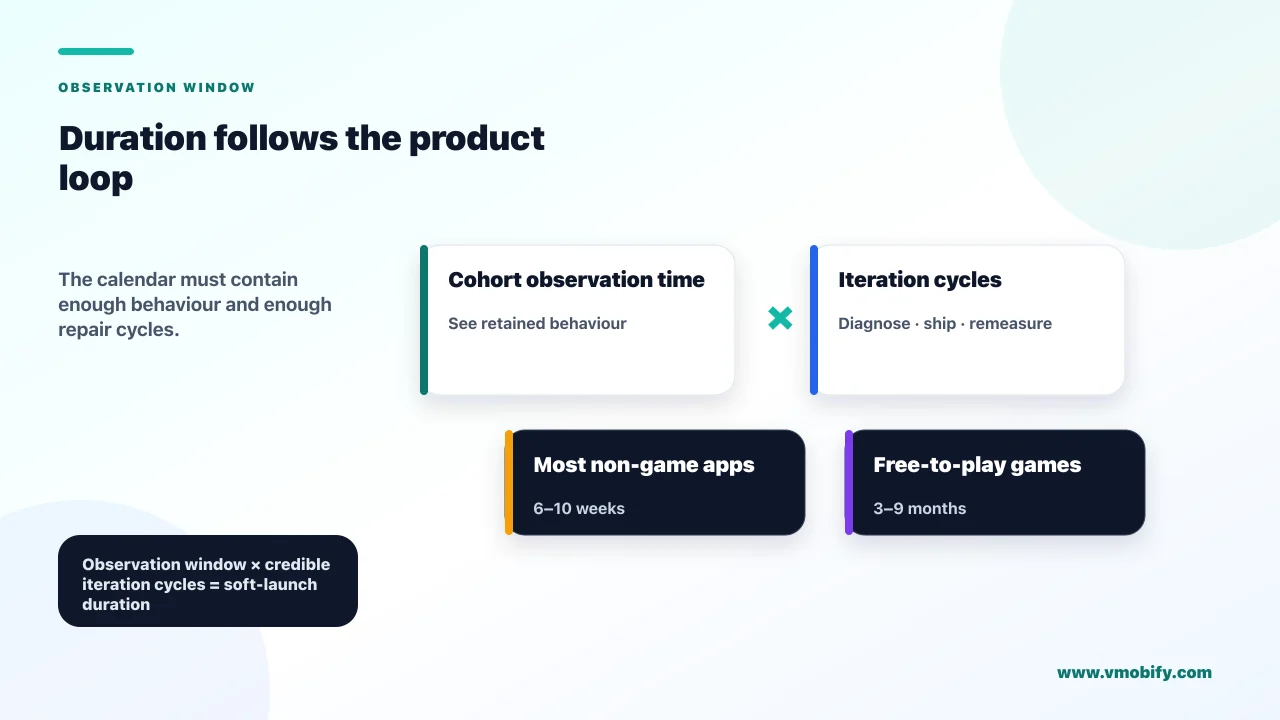
Duration is set by cohort time multiplied by iteration cycles, not by the calendar — for most non-game apps that lands at six to ten weeks, and for free-to-play games it is routinely three to nine months. Anyone quoting you a fixed number without asking what your deciding metric is does not know what they are estimating.
Start from the metric that decides the outcome and work outwards. If your gate is day-1 retention, a cohort matures in two days. Day-7 retention needs about nine days from the last install in the cohort. Day-30 needs about five weeks. If your monetisation event happens on day 14 — a trial converting, a second-week paywall, a habit forming — then you cannot make a decision in week two, no matter how much pressure the board is applying. Subscription apps have the longest fuse of the non-game categories, because a seven-day trial needs the trial period, the first renewal, and enough time after it for refunds and immediate cancellations to land before the number stops moving.
Then multiply. One read is not a soft launch, it is an observation. The point of running one is to change something and see whether the change worked, which means budgeting for at least two full iteration cycles after the first read — and each cycle costs you a fresh cohort, not a re-measurement of the old one. A team that budgets six weeks for a day-30 metric has budgeted for exactly one look at one build, and will end up either extending in a panic or shipping on a single data point.
Two platform mechanics quietly lengthen those cycles, and both are worth handling deliberately:
- Know exactly what Apple's phased release does before you plan around it. Apple's phased release for automatic updates rolls a version update out over seven days, reaching 1%, 2%, 5%, 10%, 20%, 50% and then 100% of users with automatic updates enabled, and it can be paused for up to 30 days in total. Two things follow from that, and both are routinely got wrong. It applies to version updates only, so on the initial soft-launch release there is nothing to switch off. And it never touches new downloads — a cohort you buy today always receives the current approved build, so a fresh cohort cannot be split across two versions by it. The group it does split is your existing in-market install base, and that is precisely the group whose iteration-over-iteration comparison you are relying on when you ship a change and ask whether retained users behaved differently. Switch it off for soft-launch updates so every retained user is on the same build on the same day, and save it for the global release, where protecting a large installed base matters more than a clean read.
- Understand what Play's staged rollout does and does not cover. Google's staged rollout documentation is explicit that staged rollouts apply to app updates rather than initial releases, that the percentage does not increase on its own, and that once a staged rollout has started you cannot remove countries from it. During a soft launch you generally want the whole test audience on the same build as fast as possible; save the staged approach for the global release, where risk control matters more than cohort purity.
Add store review latency to your plan rather than discovering it. Every iteration cycle contains at least one review turnaround on each platform, and first submissions take longer than updates. Two cycles on two platforms is four review windows you did not put in the schedule. And if you are publishing from a personal Play Console account opened after November 2023, the 12-tester, 14-day closed test and the production-access application described earlier sit in front of all of it — a fortnight at absolute best, and usually more once you account for recruiting testers who will genuinely stay opted in, so every duration in this section starts counting from the day production access is granted rather than the day you finish the build.
Finally, set the end date before you start. A soft launch without a timebox becomes a place where an inconclusive app lives indefinitely, consuming a little budget every month while nobody has to make a decision. In our portfolio the healthiest pattern is a written plan that names the deciding metric, the number of cycles, the total budget cap and the date on which the team either commits to a global launch or stops — agreed while everyone is still optimistic, because that is the only time it can be agreed honestly.
Which metrics should be your go or no-go gates?
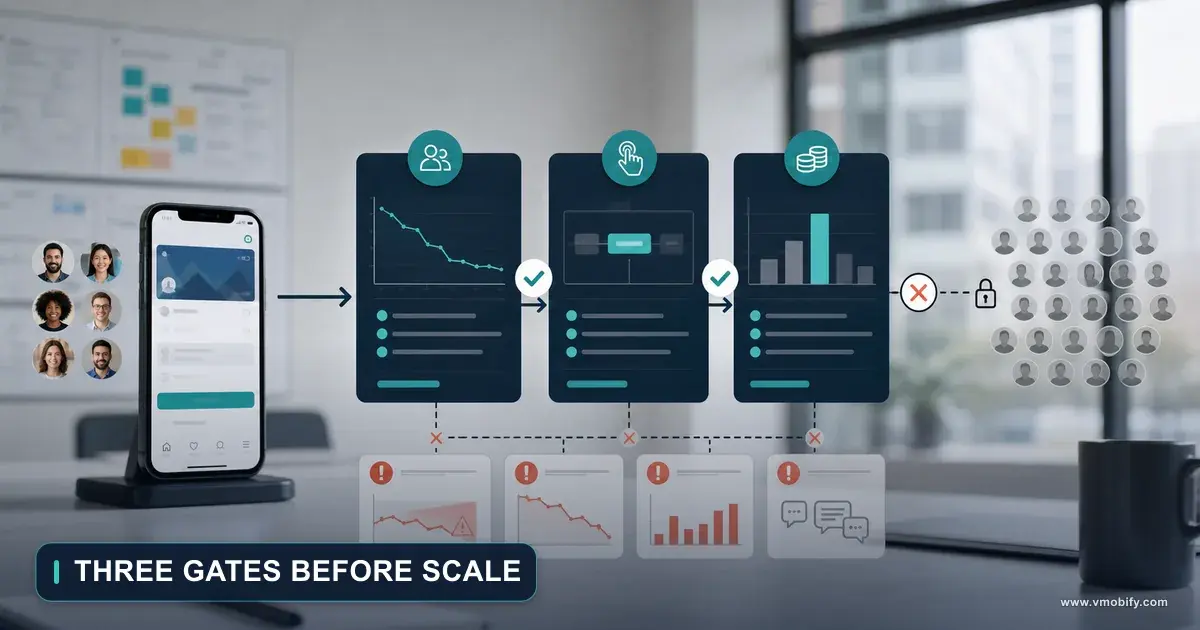
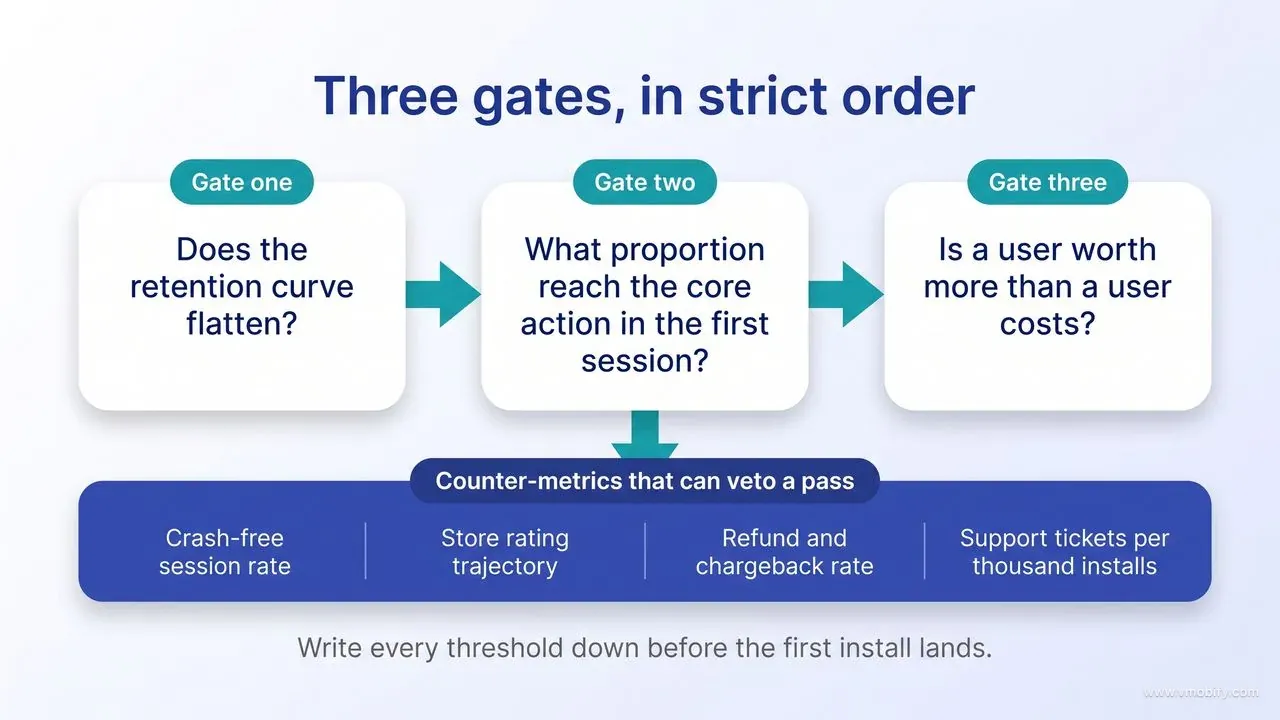
Three gates, in strict order — retention shape, then activation depth, then unit economics — and every numeric threshold written down before the first install lands. The ordering is not stylistic. A monetisation number measured on an app that does not retain is meaningless, and an install-cost number measured on an app that does not monetise is worse than meaningless because it looks encouraging.
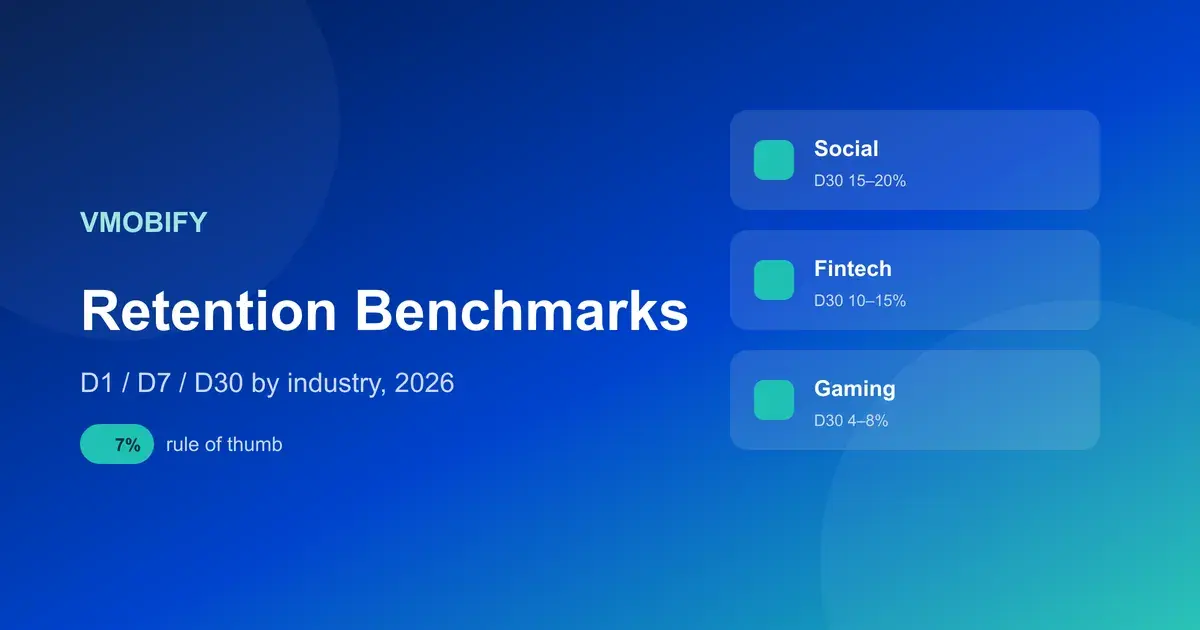
Gate one: does the retention curve flatten? The absolute day-1 number matters less than whether the curve stops falling. An app at 30% day-1 that decays to 2% by day 30 is dead; an app at 22% day-1 that settles at 11% and holds has a business. What you are looking for is the point at which the curve goes horizontal, because that horizontal line is the fraction of every cohort you buy that becomes a durable user. Compare against category norms rather than a universal figure — our app retention benchmarks guide breaks the ranges down by vertical, and the gap between a hyper-casual game and a banking app is wide enough that a single blanket threshold is useless.
Gate two: what proportion reach the core action in the first session? Retention tells you people came back; activation tells you why. Define one event that represents a user having actually experienced the product — the first transfer sent, the first workout logged, the first level completed, the first document created — and measure the share of installs that reach it in session one. This is the number that most often explains a failing gate one, and it is almost always the cheapest thing in the whole funnel to fix.
Gate three: is a user worth more than a user costs? Revenue per install at day 30 against install cost, with a payback horizon you have committed to in advance. For subscriptions, decompose it: trial start rate, trial-to-paid rate, and first-renewal rate are three separate failure modes wearing one number as a disguise. For ad-monetised apps, sessions per user and impressions per session drive the whole model, so read those rather than the revenue total.
Alongside the gates, keep a short list of counter-metrics that can veto a pass on their own: crash-free session rate, store rating trajectory, refund and chargeback rate, and support ticket volume per thousand installs. An app can clear all three gates and still be unshippable because it is generating one-star reviews faster than installs.
Then the part almost nobody does, which matters more than the metric selection: commit the thresholds to writing before you start, and treat them as binding. The characteristic soft launch failure is not a bad result — it is a team that quietly renegotiates the threshold after seeing the number. "35% day-1 or we stop" becomes "well, 29% is close and the cohort was unusual" becomes a global launch on an app that never passed anything. Pre-committing costs you nothing while you are optimistic and saves you a quarter of burn when you are not.
Give the numbers enough users to mean anything, too. A cohort of 200 users cannot distinguish 22% day-1 retention from 26% — the standard error on a proportion that size is around three percentage points, so the difference you are excited about is smaller than the noise. Separating those two specific rates — 22% against 26%, at 95% confidence and 80% power, two-sided — takes roughly 1,800 users per arm. Quote the assumptions whenever you quote the number, because 1,800 is not a constant: hold everything else and raise the power to 90% and it climbs to about 2,400, and the requirement also moves with the baseline retention rate you are testing against, so a hyper-casual game comparing 40% with 44% and a subscription app comparing 12% with 16% need different cohorts to answer the same-sized question. Run the calculation for your own baseline rather than inheriting anyone else's. That single piece of arithmetic should set your budget, and it is the subject of the next section.
A soft launch that passes on retention and monetisation can still fail at scale on technical quality, because Play evaluates that separately and acts on it. The published bad-behaviour thresholds are a user-perceived crash rate of 1.09% of daily users across all device models and a user-perceived ANR rate of 0.47% of daily active users, with 8% for any single device model. Exceeding them means Play may reduce your title's visibility and may show a warning on your store listing — in a global launch that is a tax on every rupee of acquisition you are about to spend. Check the per-device figure specifically: your test market's device mix is rarely your launch market's, so an app that looks clean in one geography can breach the single-model threshold on a handset that barely appears in the soft launch. We cover the numbers and the recovery window in the vitals thresholds that decide distribution.
How much should you spend to get a readable signal?
Spend whatever it costs to buy the cohort your decision requires — the budget is an output of the statistics, not a percentage of a number someone picked in a planning meeting. Work the arithmetic in that order and the figure stops being arbitrary.
The calculation has three steps. Decide the smallest difference that would change your decision. Convert that into a cohort size per arm. Multiply by install cost in the market you have chosen, and by the number of iteration cycles you have committed to. Carry the 1,800 installs per arm from the previous section straight through: at ₹40 per install in an Indian volume test that is ₹72,000 per arm per cycle, and at an illustrative $3.50 in Canada the same cohort is $6,300. Both of those install costs are planning placeholders, not benchmarks — substitute the rates your own media buyer is quoting for your category, because that number varies more by vertical than by country. Three cycles across two markets, and you can see why "we will spend a bit on a soft launch" is not a plan.
This is where India earns its place in the discussion, and where it needs its limits stated honestly. Indian tier-2 and tier-3 traffic is among the cheapest install inventory available anywhere, which makes it an outstanding volume test market — you can buy a cohort large enough for real statistical confidence for a fraction of what the same confidence costs in a Western market. For reading onboarding completion, crash behaviour on mid-range and low-end Android hardware, funnel drop-off, notification opt-in rates and the raw shape of an early retention curve, it is hard to beat. Our India install cost benchmarks set out what the ranges actually look like by category.
What it will not do is predict tier-1 monetisation. Revenue per user, willingness to pay, price sensitivity, subscription uptake and ad rates in Indian tier-2 and tier-3 bear no stable relationship to the same metrics in the United States, the United Kingdom or the Nordics — and there is no multiplier that converts one into the other, because the difference is in the shape of the distribution, not its scale. Use India to learn whether the product works. Use a value market to learn what it is worth. In our portfolio, teams that try to make one market do both jobs almost always over-read whichever number happens to look better.
A few spending rules that hold across categories:
- Two channels, not one and not five. One channel confounds your product read with that channel's audience quirks. Five splits your budget so thinly that no channel reaches a readable cohort. Two — typically one broad-reach network and one intent-driven source — is the pragmatic answer.
- Target broadly on purpose. In a soft launch you are measuring the product, not the media. Tight targeting produces flattering numbers from an audience you cannot buy at scale later.
- Keep spend flat within a cohort. Ramping spend mid-cohort changes the audience the algorithm is buying, and you will read a media shift as a product change.
- Check the market supports your channels before you commit. Apple Ads is available in a defined set of App Store countries and regions — Canada, Australia, New Zealand, the Philippines, all four Nordic markets and India all appear on the Apple Ads countries and regions list cited at the foot of this article — but the list is not universal, it changes, and discovering a channel gap after you have picked a market is an avoidable delay. Check it against your shortlist on the day you choose, not on the day you launch.
If you would rather not build the media operation twice — once disposably for the test and again for the launch — this is exactly the work our user acquisition team runs as a single continuous programme, so the measurement scaffolding built for the soft launch is the same scaffolding that scales.
What do you do when the numbers say no?
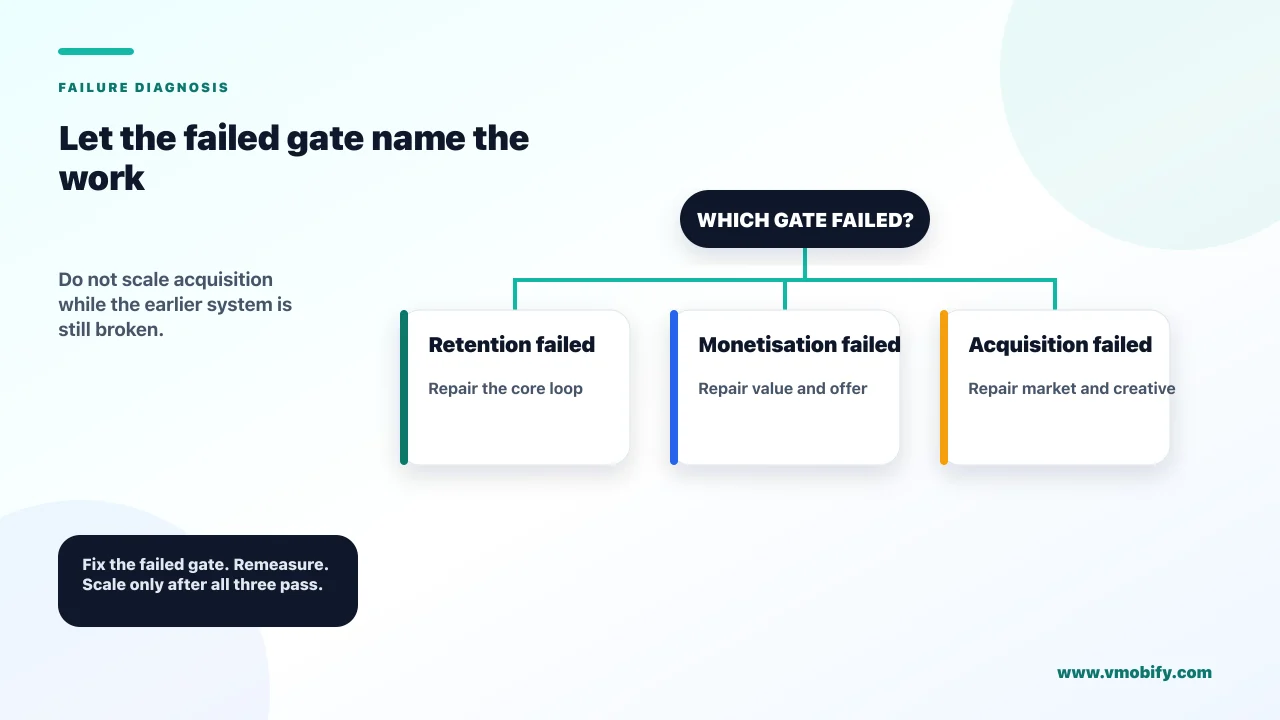
Classify which gate failed before you change anything — retention failures, monetisation failures and acquisition failures look similar on a dashboard and need completely different responses. The teams that waste a soft launch are the ones that respond to any bad number by buying more traffic.
The four diagnoses, and what each one actually calls for:
- Retention fails. This is a product problem and no amount of media fixes it. The fault is nearly always in the first session: users do not reach the core action, or they reach it and it does not deliver what the store listing promised. Work backwards from the activation event, session by session, and instrument the drop-off before you redesign anything. This is also the failure most likely to end in a kill decision, because it is the most expensive to fix and the least certain to respond.
- Monetisation fails but retention holds. Genuinely good news, and the cheapest of the four to address. You have users who want the product and a paywall, price, packaging or placement that is not converting them. These are configuration changes that ship in days, not architecture changes that ship in months, and a soft launch is precisely the environment to run them in.
- Both hold but install cost is too high. Before concluding the business does not work, check whether this is a market artefact. A small market saturates: once frequency climbs, install cost rises for reasons that have nothing to do with your app. This failure mode is more often a creative problem or a market-size problem than an economics problem, and it is the one most worth re-testing in a second market before acting on.
- Nothing is significant. The cohort was too small and every number is inside the noise band. There is no diagnosis to make — you under-bought the sample, and the only honest response is to buy the cohort properly or stop.
Whatever you change, change one system at a time and reset the cohort. Comparing users acquired after a fix against users acquired before it only works if both groups came from the same sources at the same spend levels; if you changed the onboarding and the channel mix in the same week, you have learned nothing and spent money to do it. Hold the media constant while you iterate on product, and hold the product constant while you iterate on media.
Know in advance what a kill looks like. A pre-committed stop rule — a total budget cap, a maximum number of cycles, and a floor below which you do not continue — is what separates a disciplined test from an open-ended subsidy. Killing an app after a soft launch is a good outcome: you spent a contained budget to avoid a global launch that would have cost many times more and produced the same answer.
There is also a legitimate middle path that gets overlooked. If retention holds for a narrow slice of your audience but not the whole, the answer may be to narrow the app rather than fix it — reposition around the segment that worked, rewrite the store listing to speak to them, and re-test. Some of the strongest launches in our portfolio started as a broad app that failed a soft launch and came back as a focused one that passed it, and the difference was scope, not code.
And if the read is genuinely ambiguous — which happens more often than the case-study literature admits — the correct move is a third cycle with a properly sized cohort, not a coin flip dressed up as conviction.
How do you carry soft-launch learnings into the global launch?
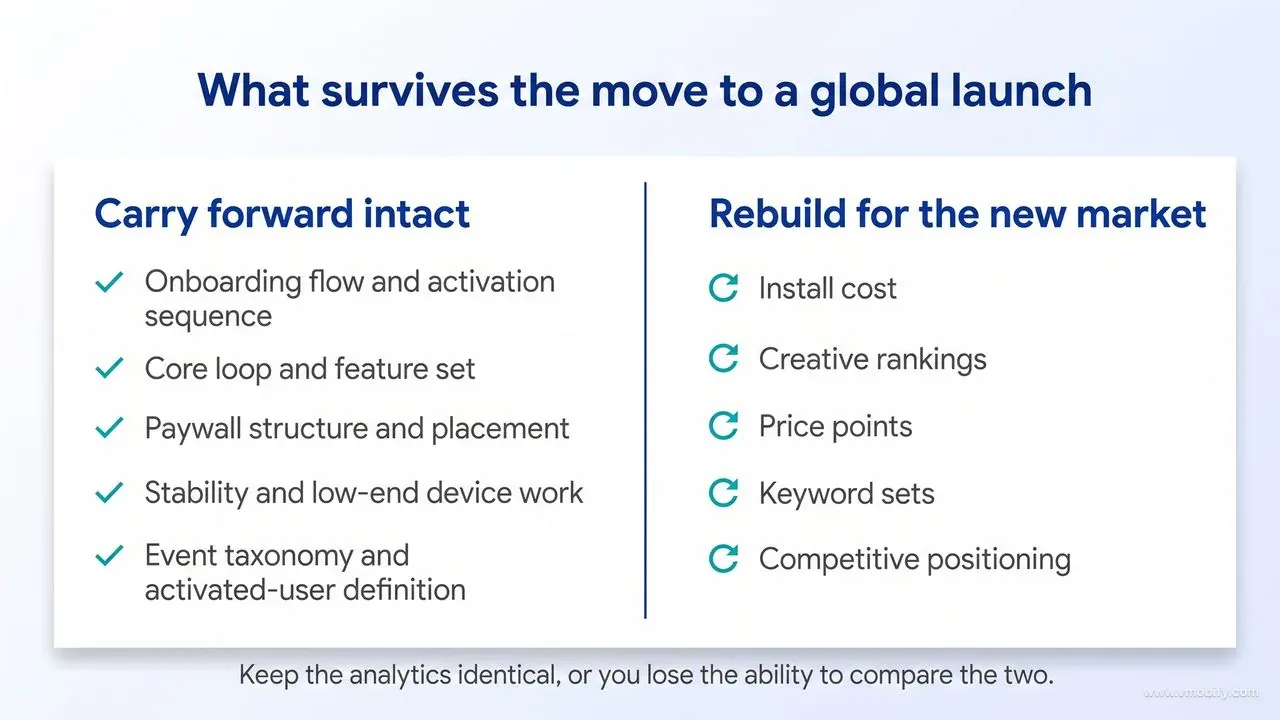
Carry the product decisions forward intact and treat every media decision as a hypothesis that has to be re-tested. Getting that split wrong is why so many teams run a careful soft launch and then launch globally as though they had never run one.
What transfers, with high confidence:
- The onboarding flow and the sequence of steps that produced your best activation rate.
- The core loop and the feature set — including whatever you cut, which is usually the more valuable half of the learning.
- Paywall structure and placement: where in the journey it appears, what it offers, how hard or soft it is.
- Stability work: crash fixes, low-end device handling, network-failure behaviour.
- Your event taxonomy and your definition of an activated user.
What does not transfer, and must be rebuilt: install cost, creative rankings, price points, keyword sets and competitive positioning. Each of those is a property of a market rather than a property of your app.
The store listing deserves particular attention, because it is the asset teams most often copy across unchanged. Rebuild it for the new market and then test it there. Google's store listing experiments let you run up to two variants per experiment, splitting traffic equally, and either one default-graphics experiment or up to five localised experiments at a time, covering up to five languages; experiments stop automatically after six months. Apple's product page testing allows up to three treatments against your original page, running for up to 90 days, with the traffic share under your control. Those are your first-week tools in a new market, not something to get to later.
Localisation is the same story, and it is cheaper than teams assume. Per Play Console Help on translating your app and its store listing, Play Console offers free machine translation into ten languages for store listings and in-app products, and paid professional human translation through third-party vendors from USD 0.07 per word, with translations completed within seven days. Note that the machine-translation language count is specific to that service and differs from the far longer list of languages your listing can be published in, so check the current page rather than assuming the two match. Either way it makes the cost of a properly localised listing small relative to the media budget it protects. A Nordic soft launch run on an English build tells you about your paywall; it does not tell you how your listing will convert once it is written in Swedish.
Pricing needs re-deriving rather than copying. Apple's App Store spans 175 storefronts and 45 currencies, with 900 price points available and a floor as low as $0.29, per Apple's pricing announcement. The price that converted in your test market is one of nine hundred options and was chosen for one economy. Treat it as a starting hypothesis for each new storefront, not a global default.
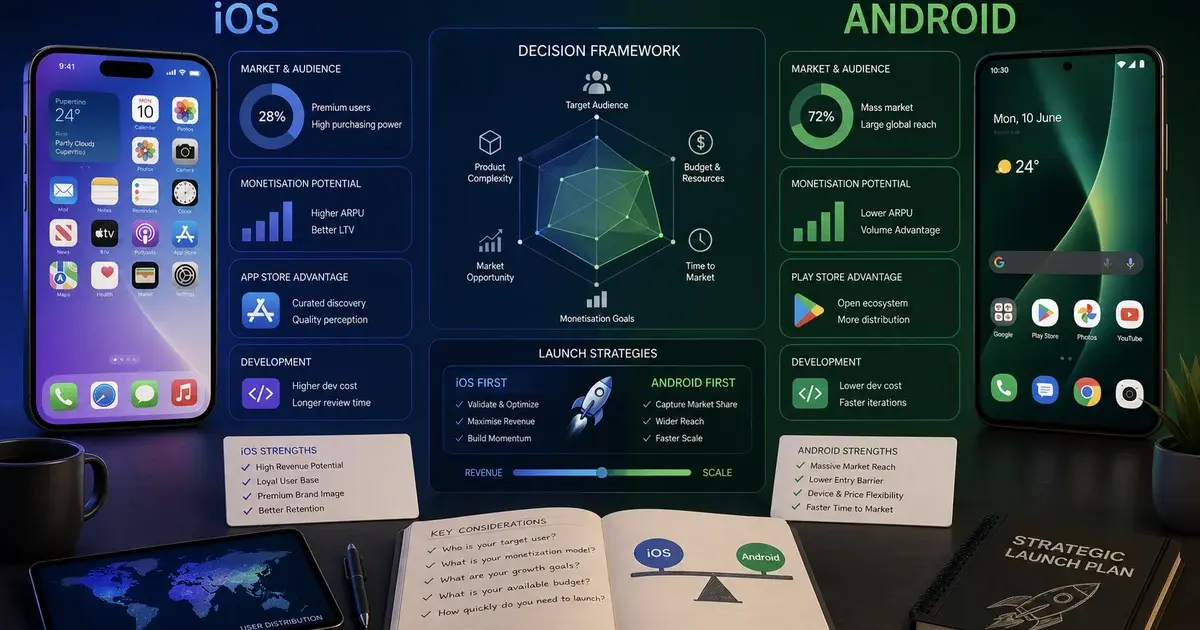
The single most valuable thing to carry forward is duller than any of that: keep the analytics identical. Same event names, same activation definition, same cohort windows, same attribution setup. If the taxonomy changes between soft launch and global launch, you lose the ability to compare the two, and comparability is the entire reason the soft launch existed. It is also worth deciding your platform sequencing at this point rather than defaulting to both at once — our comparison of iOS versus Android launch ordering covers when a staggered rollout beats a simultaneous one, and the answer depends heavily on which of the two you soft launched on.
Finally, do not let the gap between test and launch stretch. Everything you learned decays: creative fatigues, competitors ship, platform rules move. The pre-launch work for the global market — waitlist, press, creator relationships, keyword research — should be running in parallel with the soft launch, not started after it passes.
What breaks when you scale from a test market to a tier-1 market?
Four things break predictably — install cost, competitive density, operational load and measurement — and three of the four stay invisible until the day real spend goes live. Knowing which is which lets you plan for them instead of discovering them.
Install cost breaks first, and by more than teams expect. Your soft-launch cost per install was set in an auction with few well-funded bidders. A tier-1 auction contains incumbents who have been optimising the same placements for years, with more creative inventory, more historical data and a higher tolerance for paying up. Treat your soft-launch install cost as a floor you will never see again rather than a number to budget against, and model your launch on tier-1 benchmarks with your soft-launch conversion rates applied on top.
Store competition breaks second. Ranking for your category terms in a small market is a very different exercise from ranking for them in the US or the UK, where the top positions are held by apps with years of install velocity and review volume behind them. The keyword set that worked in New Zealand is not the keyword set that works in a contested market, and your review count — perfectly respectable after a soft launch — will look thin next to competitors carrying six figures of ratings.
Operations break third, and quietly. Support ticket volume scales with installs, and a queue that one person cleared in an hour a day becomes a real function. Payment methods differ by market. Tax, invoicing and consumer-protection obligations differ by market. Server load that was comfortable at a few thousand daily actives behaves differently at a hundred thousand, and the failures are rarely graceful. None of this is glamorous and all of it will consume your launch week if it is not handled beforehand.
Measurement breaks fourth. A larger, more heterogeneous audience across many countries produces noisier channel-level data, blended numbers hide market-level differences, and iOS attribution gives you less granularity than you had when a single market and a single channel made everything legible. Decide in advance which numbers you will govern by — blended cost per acquisition, market-level cohorts, or channel-level reads — because the temptation to keep watching the dashboard that worked at small scale is strong and it will mislead you.
Two release mechanics also change character at this point, and both are worth re-reading rather than assuming:
- Staged rollout on Play covers updates rather than initial releases, so your first global release lands all at once in every country you have made the app available in. If you want a phased global launch, you phase it by sequencing country availability, not by percentage. And once a staged rollout has begun you cannot remove countries from it.
- Apple's phased release governs automatic updates for existing users. It does not throttle new downloads, and anyone can download the update manually at any time during the phase. It is a safety mechanism for your installed base, not a traffic control for a launch.
The last thing that breaks is organisational, and nobody puts it in the plan. A team calibrated to a small market — reviewing a modest daily spend, watching one dashboard, shipping when it suits them — is not calibrated for ten times the budget, several markets, a live review queue and a competitor responding to you. Decide who owns the daily spend call, what the escalation threshold is, and how often the numbers get reviewed, before launch week rather than during it. If you want a second pair of hands on that transition, talk to our team — the handover from a passing soft launch to a funded global launch is the point where the most avoidable money gets lost.
Frequently Asked Questions
What is the difference between a soft launch and a beta test?+
A beta answers whether the software works; a soft launch answers whether the business works. A beta is free, uses TestFlight or Play testing tracks, and runs on people who already know you. A soft launch is a full production release in a limited set of countries with real store listings, real payments and real paid acquisition behind it.
Which country should I soft launch in?+
The smallest market that still behaves like your target market. Canada is the best proxy for the United States, Australia and the Nordics are strong value markets, and the Philippines or Indian tier-2 and tier-3 give you the cheapest volume. Most serious soft launches run one volume market and one value market at the same time, because no single market does both jobs.
How long should a soft launch last?+
Long enough for your deciding metric to mature, multiplied by at least two iteration cycles. Six to ten weeks is typical for non-game apps with a day-7 or day-30 gate; free-to-play games routinely run three to nine months because the value of a player takes that long to observe. Add store review turnarounds on both platforms, and if you publish from a personal Google Play account opened after November 2023, add the required 12-tester, 14-day closed test and production-access approval in front of everything else.
How much should I budget for a soft launch?+
Calculate it backwards from the cohort you need rather than picking a figure. Separating 22% day-1 retention from 26% at 95% confidence and 80% power takes roughly 1,800 users per arm, so multiply that cohort by your install cost in the chosen market and again by the number of iteration cycles you have committed to. Recompute it for your own baseline retention rate, because the required cohort moves with it.
Can I use India as a soft launch market?+
Yes, as a volume market. Indian tier-2 and tier-3 traffic buys you a statistically meaningful cohort for a fraction of Western costs, which makes it excellent for reading onboarding, funnel drop-off, low-end device behaviour and early retention shape. It is a poor predictor of tier-1 revenue per user, so pair it with a high-income value market before you make a monetisation decision.
What metrics decide whether a soft launch passed?+
Three gates in order: does the retention curve flatten, what share of installs reach the core action in the first session, and is a user worth more than a user costs within your committed payback window. Write the numeric threshold for each one before the first install lands, and treat crash-free rate, store rating and refund rate as counter-metrics that can veto a pass.
Do soft launch results transfer to a global launch?+
Product findings transfer — onboarding, core loop, paywall structure, stability work and your activation definition. Media findings do not: install cost, creative rankings, price points and keyword sets are properties of a market rather than of your app, and all four have to be re-tested when you enter a tier-1 auction with well-funded incumbents in it.
Sources
- Play Console Help — Distribute releases to specific countries — Country targeting is based on the user Play account country, and testing tracks inherit production country settings by default
- Play Console Help — Set up an open, closed, or internal test — Internal tests allow up to 100 testers per app and reach testers in any location; closed-testing email lists hold up to 2,000 testers each, with up to 200 lists per account and 50 per track
- Play Console Help — Production access requirements for personal accounts — Personal accounts created after 13 November 2023 must run a closed test with at least 12 testers opted in continuously for 14 days before applying for production access
- Play Console Help — Release app updates with staged rollouts — Staged rollouts apply to updates rather than initial releases, and countries cannot be removed once a rollout starts
- Play Console Help — Translate your app and store listing — Free machine translation into ten languages, and paid human translation from USD 0.07 per word completed within seven days
- Apple — Release a version update in phases — Version updates only; the seven-day 1/2/5/10/20/50/100 percent schedule applies to automatic updates, while anyone can download manually at any time
- Apple — Invite external testers to TestFlight — External tester limits, public link tester caps and the TestFlight App Review requirement
- Apple Ads — Countries and Regions — The published list of App Store countries and regions where Apple Ads campaigns can run
About the author
Amol Pomane — Founder, Vmobify
Amol leads Vmobify, a mobile app growth agency that has driven 30M+ downloads and ranked 54K+ keywords across 300+ apps since 2013. He writes about ASO, paid user acquisition, retention, and the operational reality of scaling mobile apps in India and global markets.