Cheap CPI Markets: When Cheap Installs Cost You More
Every list of the cheapest CPI countries traces back to another list, and none of them trace back to a source you can check. The more useful question is why a market is cheap in the first place, because the same conditions that suppress the install price usually suppress the revenue behind it. This is how to judge a market from data you actually own.

On this page
- Why is there no CPI table in this article?
- What does a cheap install actually buy you?
- Why do low-CPI markets have a lower revenue ceiling?
- Are you reaching the country you targeted?
- Can your measurement stack judge a new market at all?
- Does a cheap market raise your fraud exposure?
- How do you evaluate a market from your own data?
- What is the payback question that decides it?
- What should you do before the next geo expansion?
- Frequently Asked Questions
Why is there no CPI table in this article?
Because we could not find a single country-level CPI figure that traces back to a source we can open, read and stand behind — every candidate led to an aggregator article quoting another aggregator article. So we are not printing one, and the reason is worth more to you than the table would have been.
The pattern is easy to see once you look for it. A number appears in a listicle. A second listicle cites the first. A third cites the second and rounds it. Within a year the figure is everywhere and its origin is nowhere. Nobody publishes the auction it came from, the date range, the ad network, the platform split, the campaign objective, or whether the installs were counted by the store or by an attribution provider. Without those, a CPI number is not a benchmark; it is a rumour with a currency symbol on it.
We do not publish figures we cannot source to primary documentation or to data we own. When a number is not publishable, we say so and write the claim directionally instead. That is deliberate: an article that refuses external benchmarks has no business inventing internal ones either.
There is a deeper problem than sourcing. CPI is not a property of a country. It is the output of an auction you are competing in, against advertisers bidding for the same attention with different products, different budgets and different tolerance for loss. Your CPI in a given market is set by your creative, your category, your store listing conversion rate, your bid strategy, your seasonality and your competitors' balance sheets. Two apps running in the same country in the same week routinely pay prices that are not in the same range.
So the question "which countries have the cheapest CPI" has no stable answer, and a table pretending otherwise would mislead you in the most expensive way possible: it would make a budget decision feel researched. The answerable question is different. Given what a market pays back, what install price could you afford there — and can you actually measure whether you hit it? That is what the rest of this article is about, and it is also how we approach market selection in our user acquisition work.
What does a cheap install actually buy you?
An install is an event, not an outcome, and a cheap one buys you the same event at a lower price with no promise about anything downstream. The trap in low-CPI expansion is that the cost side of the equation improves immediately and visibly, while the value side degrades slowly and invisibly.
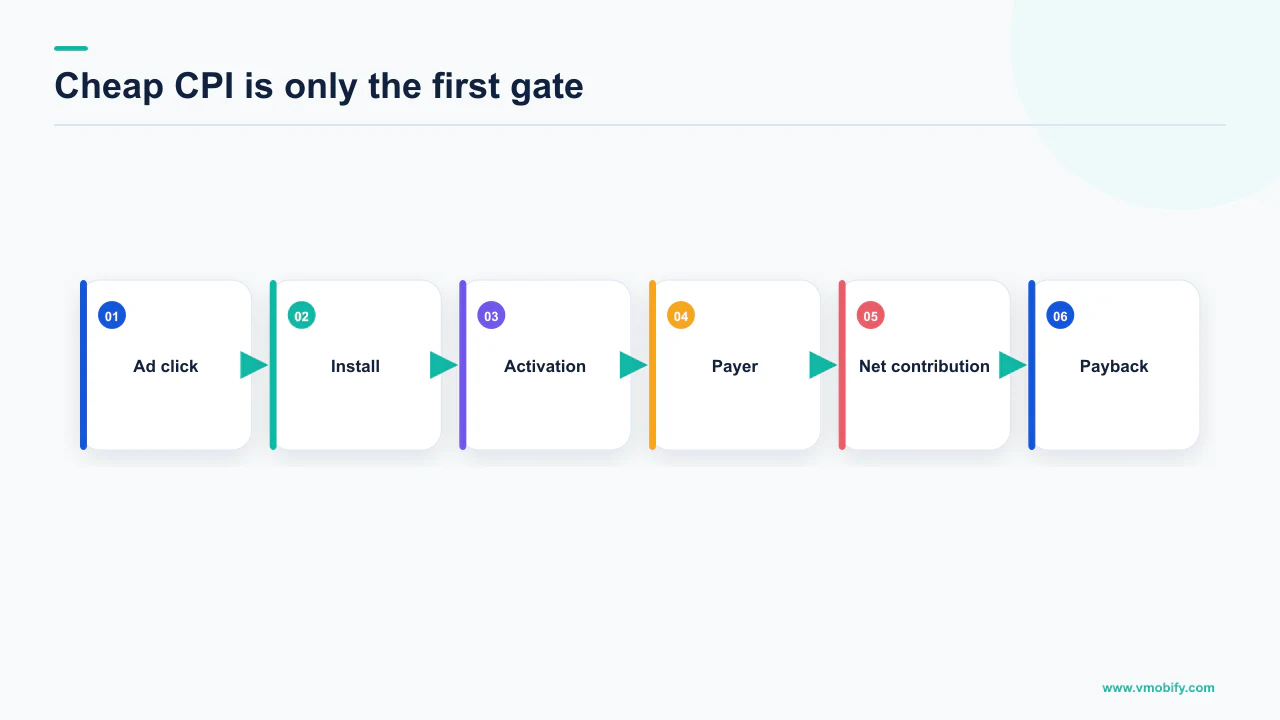
Think about what has to happen after the install for the spend to have been worth it. The user has to open the app. They have to complete onboarding in a language they read comfortably. They have to find the value proposition credible in their context. They have to return. Then, depending on your model, they have to see enough ad inventory at a price advertisers will pay in that market, or they have to reach a paywall priced in their currency and decide it is worth it.
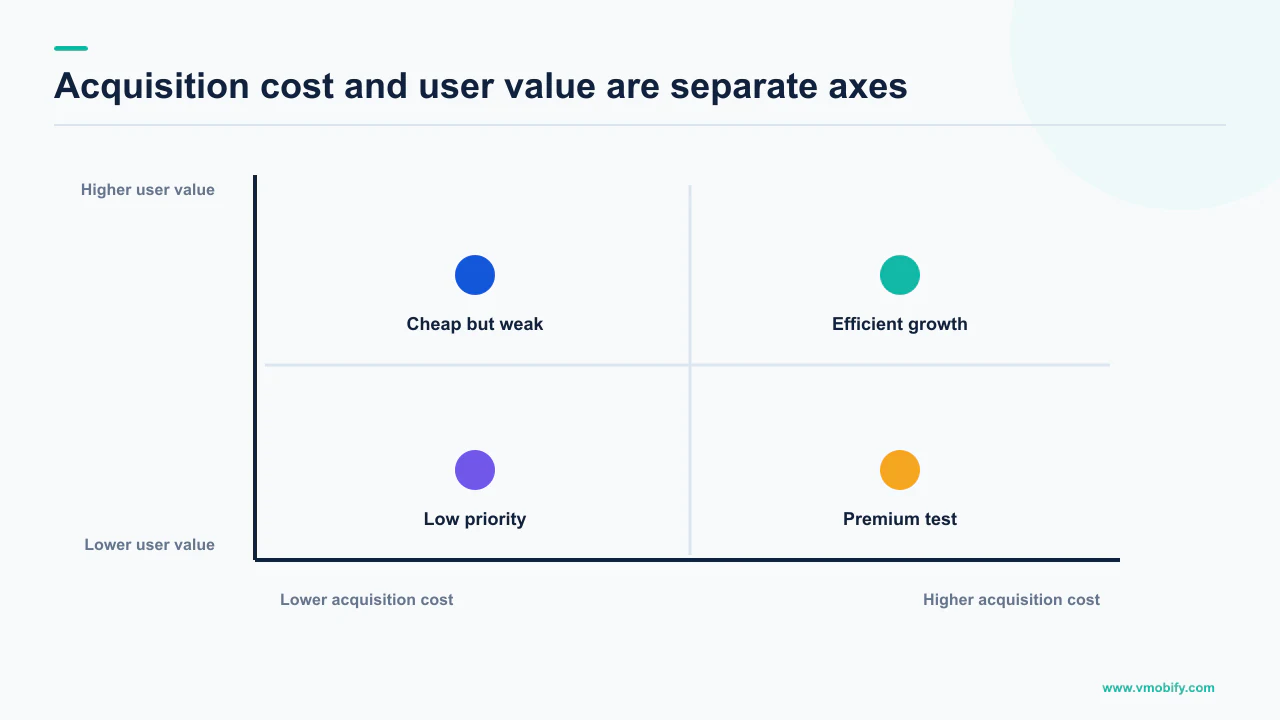
Each of those steps is a market-specific multiplier, and each one can be lower in exactly the places where installs are cheapest. That is not a coincidence — it is the same underlying condition expressed twice. Advertiser demand is low in a market because the expected value of a user there is low, which is why the auction clears cheaply. The cheap price is a signal about the value, not an escape from it.
Stop asking "where can I buy installs cheaply?" and start asking "where does my payback period fit inside my cash cycle?" The second question has an answer you can compute from your own data. The first does not.
Across the apps we have managed since 2013, the geo expansions that failed rarely failed on CPI. They failed on the assumption that a user acquired in a new market behaves like a user acquired in the home market. Retention curves, session depth, payment method availability and paywall conversion all shift, and they shift independently of each other. Our LTV and CAC calculator guide walks through the arithmetic that makes this concrete.
Why do low-CPI markets have a lower revenue ceiling?
Because the stores themselves adjust your price downward in those markets, so the same purchase produces less revenue there than it does at home — by design. This is documented, and it is the single most overlooked mechanic in geo expansion planning.
On the App Store, Apple's guidance on setting a price explains that you set a price in a country or region you are familiar with "as the basis for automatically generating prices across the other 174 storefronts and 43 currencies", and that automatically generated prices "account for foreign exchange rates and certain taxes, and follow the most common pricing convention for each country or region". Apple also states that it periodically updates prices in certain regions based on changes in taxes and foreign exchange rates, and that it "will never change the price in your base country or region" while notifying you in advance of changes on other storefronts.
Google Play works on the same principle. Play Console's pricing documentation states that Play converts your price to the local currency, adds tax in select countries, and applies locally relevant pricing patterns and valid exchange rates for the date on which you set the price. It also states that where a local currency is not supported, the price you enter is used and a price in USD or EUR is generated, and that the currency used in each country is set and cannot be changed.
Read that back with a UA budget in your hand. If you sell a subscription and let the stores generate local prices, your gross revenue per paying user in a lower-income market is lower before a single behavioural difference enters the picture. Then behaviour compounds it: conversion to paid, payment method success and renewal rates all vary by market.
The same argument holds for ad monetisation, in a different form. Your effective revenue per impression is set by what advertisers will bid for attention in that geography — and if install prices there are low because advertiser demand is low, your ad revenue per user is exposed to the same weakness. Cheap traffic and cheap monetisation are two readings of one instrument. If you are deliberately setting prices by market rather than accepting generated ones, our note on purchasing-power-based price localisation covers how to do it without destroying the base price.
Are you reaching the country you targeted?
Not necessarily, and the two platforms define "country" differently enough that your ads data and your store data can disagree without either being wrong. This is the first thing to check when a new market's numbers look strange.
Google Play is explicit. Its documentation on distributing app releases to specific countries states that "country targeting is based on the user's Play country (that is, where their account is registered), not their current location". A user physically in one country whose Play account is registered in another is, to Play, in the registration country. Availability and release targeting follow the account, not the handset.
Google Ads defines it differently again. Its guidance on targeting ads to geographic locations states that location targeting "is based on a variety of signals, including users' settings, devices, and behavior on our platform", describes the result as Google's best effort to serve ads to users who meet your location settings, and says plainly that "100% accuracy is not guaranteed in every situation". The broader setting reaches people who are in your targeted locations or have shown an interest in them; the presence setting is the one to consider when you only want users actually in those locations.
If a new market shows healthy installs in the ads platform and near-zero installs in Play Console for the same country, do not start by suspecting attribution. Start by suspecting that the two systems are answering different questions — one about where an ad was served, the other about where an account is registered.
The practical consequence is that a cheap market can be cheap partly because you are reaching an audience adjacent to the one you intended, on interest signals rather than presence. That audience is not fraudulent and the installs are real. They are simply not the cohort your business case was written about, which is why the retention curve does not match the plan.
Can your measurement stack judge a new market at all?
Often it cannot, because both the bidding systems and the modelling tools you would use to evaluate a market have documented volume thresholds that a small test in a new country does not clear. This is the step most teams skip, and it is the reason a lot of geo tests produce a confident conclusion from data that could not support one.
Take value-based bidding first. Google's documentation on Target ROAS bidding lists minimum requirements that differ by campaign type, and for App campaigns it states the requirement as at least 10 conversions every day, or 300 conversions in 30 days. If your new-market test cannot produce that conversion volume, you are not choosing between install-optimised and value-optimised bidding — you only have one option, and it is the one that optimises for the event you already know is a poor proxy for value.
Now take prediction. Google Analytics 4's predictive metrics — purchase probability, churn probability, predicted revenue and in-app purchase probability — require model training, and the predictive metrics documentation states the prerequisite as at least 1,000 returning users having triggered the relevant predictive condition and at least 1,000 returning users not having triggered it, over a seven-day period within the last 28 days, with model quality sustained over time. GA4 defines predicted revenue as the revenue expected from all purchase key events in the next 28 days from a user active in the last 28 days.
Those thresholds are not obstacles to work around. They are a statement about how much signal a market has to generate before any model can say something reliable about it. A two-week test in a low-volume country produces a number, and the number will be precise, and it will not be trustworthy. If you need an early read on a market before the volume exists, a structured soft launch is the honest instrument — our soft launch strategy guide covers how to design one that answers a question rather than decorating a decision.
Does a cheap market raise your fraud exposure?
It raises the pressure on your verification, because low payout markets are where the economics of manufacturing an install work best for a bad actor. The exposure is not evenly distributed across channels, and it is not identical to what the ads platform already filters for you.
Google's documentation on invalid traffic defines it as clicks and impressions on ads that are not the result of genuine user interest, including intentionally fraudulent traffic and accidental or duplicate clicks. It states that invalid traffic is detected by Google's monitoring systems, that advertisers are not charged for invalid clicks or impressions, and that the invalid clicks column shows traffic the automated systems have already detected and filtered in real time.
That protection is meaningful but bounded. It concerns ad interactions on Google's own inventory. It says nothing about the quality of installs sourced from an incentivised network, an offerwall, or a reseller two layers below the partner you signed with — which is precisely where the cheapest inventory in the cheapest markets tends to live.
The defence is behavioural, not forensic. Fraudulent installs are cheap to manufacture and expensive to make behave: they arrive, they are attributed, and then they do nothing. Segment every new market by source down to publisher level and compare day-1 and day-7 retention, session depth and any post-install event that is difficult to fake. A source whose installs never reach a second session is telling you what it is. Our guide to mobile ad fraud prevention goes through the signatures in detail.
How do you evaluate a market from your own data?
Start from your own organic users in that market, because they are the only unbiased sample of how your product performs there and they cost you nothing to observe. Almost every app that is considering a market already has some presence in it, and that presence is more informative than any external benchmark.
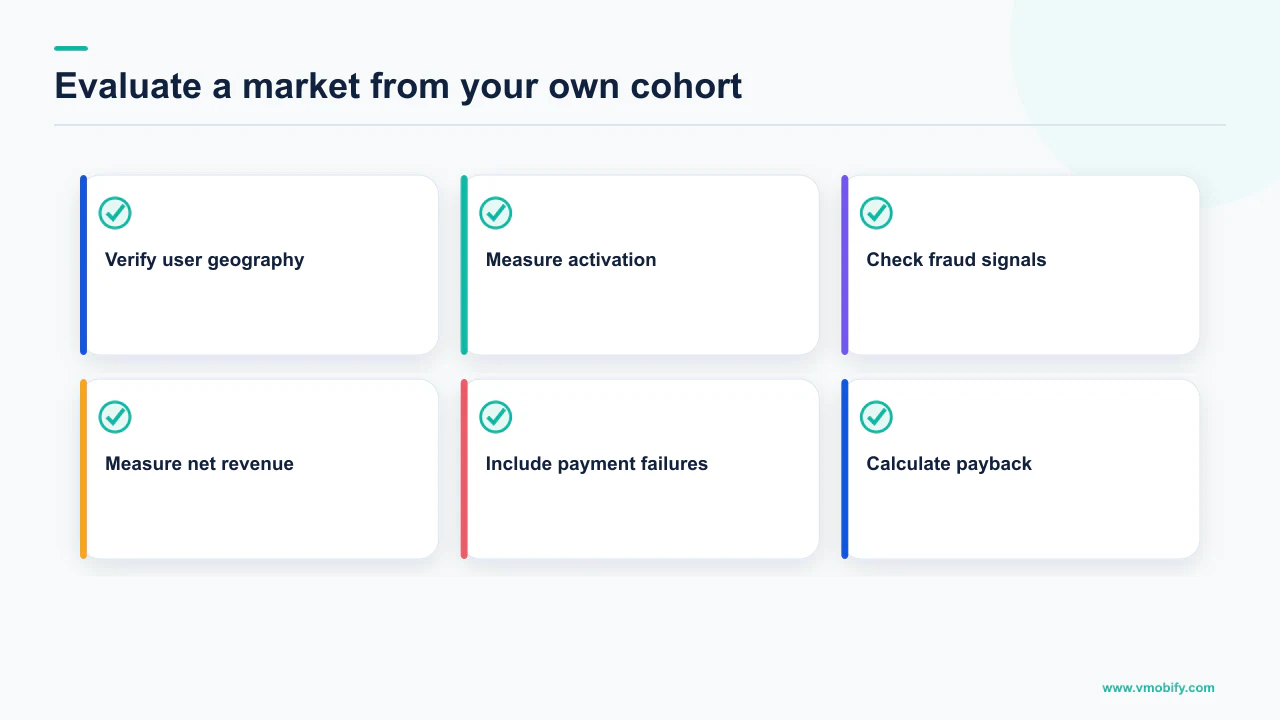
- Pull store-level performance by country first. Play Console's monthly report exports include a store performance breakdown with country alongside store listing acquisitions, store listing visitors and store listing conversion rate. If your listing converts poorly in a market before you spend anything, paid traffic will inherit that conversion rate and your effective cost per install will be higher than the auction price implies.
- Separate organic retention by market. Compare day-1, day-7 and day-30 retention for organic users in the candidate market against your home market. This is your ceiling estimate, because organic users are usually your best-intent cohort.
- Check monetisation reachability, not just monetisation rate. Can users in that market actually pay you? Which payment methods are available, what does the store generate as a local price, and does your paywall render correctly in the local currency and language?
- Model revenue per user at the generated local price, not at your home price converted. The stores are already adjusting the price for you; your model has to use their output, not your assumption.
- Then, and only then, put a small budget in and compare the paid cohort against the organic baseline you just built. Without the baseline, you cannot tell a bad market from a bad campaign.
The output of this process is not a CPI figure. It is a maximum affordable install price for that market, derived from your revenue per user and your payback tolerance. That number is defensible because every input is yours. It also changes the negotiation entirely: instead of asking a network what installs cost in a country, you tell them what you can pay and let them say whether they can deliver at that price.
Compare that with our teardown of what an app install actually costs in India, which works through the same logic in a single market rather than in the abstract.
What is the payback question that decides it?
Whether the market returns your money faster than you need to spend it again — because a market with a good lifetime return and a slow payback can still bankrupt the campaign that funds it. Cheap installs make this worse, not better, and that is the counterintuitive part.
A low-CPI market with a low revenue per user typically has a longer payback period than a high-CPI market with a high revenue per user, even when both eventually reach the same ratio of value to cost. Cheapness buys volume, and volume in a slow-paying market ties up more cash for longer. You can be profitable on a spreadsheet and out of working capital at the same time.
The comparison that matters is not between two countries. It is between one country's payback period and your own cash cycle.
Low CPI, slow payback
Volume arrives quickly and cash returns slowly. Attractive on a cost-per-install report, punishing on a cash flow forecast. Viable if you are funding growth from a balance sheet rather than from revenue, dangerous if you are not.
Higher CPI, fast payback
Fewer installs per unit of spend, but each cohort refunds itself sooner and the same capital gets reused more often. Usually the better engine for a self-funded app, even though every install looks more expensive.
This is why we treat market selection as a finance question wearing a marketing costume. The full mechanics, including how to work out how long you can carry a cohort, are in our piece on UA budgets and cash payback.
What should you do before the next geo expansion?
Write down the affordable install price for the market before you look at any quoted price, so the quote cannot anchor your judgement. Everything else in this article exists to make that one number defensible.
- Compute revenue per user in the target market using the price the store will actually generate there, and your own organic retention in that market as the behavioural input.
- Set the payback period you can fund from your cash position, not from an industry convention you read somewhere.
- Derive the maximum install price those two constraints allow. That is your bid ceiling and your negotiating position.
- Confirm you can measure the test. If the market cannot produce the conversion volume that value-based bidding requires, plan a longer, larger test or accept that you are running a directional experiment and label it as one.
- Reconcile country definitions before you read results. Play counts the user's registered Play country; Google Ads serves on a mix of signals with accuracy that is not guaranteed. Know which one each report is using.
- Segment by publisher from day one so a fraud problem cannot hide inside a market-level average.
If the affordable price you derive is below what any legitimate source will deliver for, the market is not cheap. It is unaffordable at your current unit economics, which is a product and pricing problem rather than a media buying one. That is a far more useful conclusion than a table would have given you, and it points at work you can actually do.
If you want a second opinion on a market before you commit budget to it, send us the organic numbers you already have and we will tell you what they imply about the affordable install price. It is usually a short conversation, and it is a great deal cheaper than finding out in the auction.
Frequently Asked Questions
Why will you not tell me which country has the cheapest CPI?+
Because we could not verify a single country-level CPI figure against a primary source. Every candidate traced to an aggregator article citing another aggregator article, with no auction, date range, network, platform split or campaign objective attached. CPI is also an auction outcome specific to your app, so a country-level average would not predict your price even if it were sourced.
Is a low CPI ever a good reason to enter a market?+
Only as a secondary input. The primary input is what a user in that market is worth to you at the price the store will generate there, and how quickly that value comes back. If the affordable install price you derive from your own data is above the prevailing price, the market is worth testing. If it is below, the cheapness is irrelevant.
Does the store really lower my price in poorer markets?+
It generates a local price rather than lowering yours directly. Apple states that a base price is used to automatically generate prices across the other 174 storefronts and 43 currencies, accounting for foreign exchange rates and certain taxes and following the most common pricing convention for each country or region. Play states it converts your price to the local currency, adds tax in select countries and applies locally relevant pricing patterns.
Why do my ads platform and Play Console disagree about a country?+
Because they define country differently. Play Console states that country targeting is based on the user’s Play country, that is where their account is registered, not their current location. Google Ads states its location targeting is based on a variety of signals including users’ settings, devices and behaviour on the platform, and that 100% accuracy is not guaranteed in every situation.
Can I run value-based bidding in a small new market?+
Not until it produces enough conversions. Google states that Target ROAS minimum requirements differ by campaign type, and for App campaigns the requirement is at least 10 conversions every day, or 300 conversions in 30 days. Below that you are limited to optimising for the install itself, which is the event you already know is a weak proxy for value.
How much data do I need before predicted revenue means anything?+
For GA4 predictive metrics, Google states that at least 1,000 returning users must have triggered the relevant predictive condition and at least 1,000 returning users must not have, during a seven-day period over the last 28 days, and that model quality must be sustained over time. A short test in a low-volume market will not meet that, so treat its output as directional.
What should I measure first when a new market underperforms?+
Store listing conversion rate by country, then retention by source down to publisher level. Play Console monthly report exports include a store performance breakdown with country alongside store listing acquisitions, visitors and conversion rate. A weak listing raises your effective cost per install regardless of the auction price, and a source whose installs never return is a quality problem rather than a market problem.
Sources
- Distribute app releases to specific countries — States that country targeting is based on the user’s Play country, where their account is registered, not their current location.
- Set up your app’s prices — Play converts your price to local currency, adds tax in select countries, applies locally relevant pricing patterns; currency per country cannot be changed.
- Download and export monthly reports — Store performance export includes country with store listing acquisitions, visitors and store listing conversion rate.
- Set a price — Base price generates prices across the other 174 storefronts and 43 currencies, accounting for exchange rates and certain taxes.
- Target ads to geographic locations — Location targeting uses users’ settings, devices and behaviour; 100% accuracy is not guaranteed in every situation.
- About Target ROAS bidding — Minimum requirements by campaign type; App campaigns require at least 10 conversions every day, or 300 conversions in 30 days.
- [GA4] Predictive metrics — Defines purchase probability, churn probability and predicted revenue, and the 1,000 plus 1,000 returning-user training prerequisite.
- About invalid traffic — Defines invalid traffic, states advertisers are not charged for it, and that the invalid clicks column shows already-filtered traffic.
About the author
Amol Pomane — Founder, Vmobify
Amol leads Vmobify, a mobile app growth agency that has driven 30M+ downloads and ranked 54K+ keywords across 300+ apps since 2013. He writes about ASO, paid user acquisition, retention, and the operational reality of scaling mobile apps in India and global markets.
Model an install budget
Turn CPI and activation assumptions into acquisition scenarios.
Open free tool