App Price Localisation: Setting Prices by Country with PPP
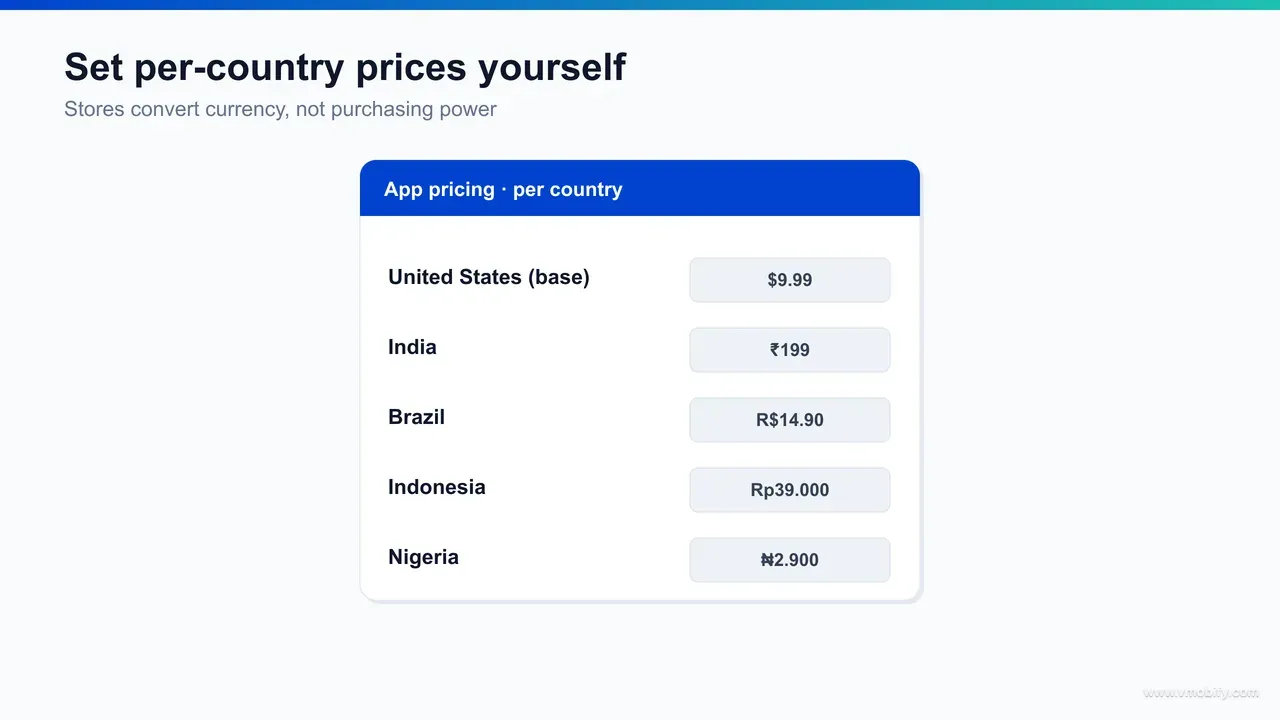
The App Store and Google Play convert your currency — they do not localise purchasing power. A $9.99 plan FX-converted to ₹830 prices most of India out. Here is how to set app prices country by country with purchasing-power parity, the exact store mechanics, and the India-first methodology.

Do the App Store and Google Play localise prices for purchasing power?
No — both stores convert your currency, they do not localise your purchasing power, and conflating the two is the single most expensive pricing mistake we see India-focused teams make. When you set a price in your home currency, the store applies an exchange rate plus any local tax and rounding to produce a foreign-market price. That is currency conversion, not pricing strategy.
Apple is explicit about this. Its auto-conversion turns one anchor price into prices across 175 storefronts and 44 currencies, derived from foreign-exchange rates and tax, with roughly 900 price points starting from $0.29, per Apple's pricing update. The system optimises for clean, tax-inclusive numbers in each currency — it has no notion of what a user in Mumbai versus Manhattan can comfortably pay.
Google Play works the same way. When you set a default price, Play can convert it into local currencies applying exchange rates, tax and rounding rules, as documented in Play Console Help. Again, the maths is currency, not purchasing power.
The gap this leaves is large. A $9.99 subscription FX-converted to roughly ₹830 a month is not a localised price for India — it is a US price wearing a rupee costume, and it prices out most of the market it is shown to. The distinction matters because it changes who is responsible for the strategy: the store handles the mechanics of charging a rupee amount and remitting the right tax, but the judgement of what that amount should be is entirely yours. Many teams never make that judgement at all — they accept the proposed grid because it looks finished, when in fact it is only the currency-conversion half of the job.
Across our 300+ apps managed since 2013, the teams that quietly accept the auto-converted price are the ones leaving the most money on the table in exactly the markets they most want to grow. The fix is not technical — every override you need already exists in both consoles — it is a decision to price each priority market deliberately instead of inheriting a number that was optimised for clean tax maths rather than for conversion.
How much revenue does PPP-aligned pricing actually add?
PPP-aligned pricing reliably lifts revenue in lower-income markets because it converts a wall of unaffordable prices into a stream of affordable ones — the cleanest public example saw overall revenue rise 15% and developing-market revenue rise 800%. The mechanism is simple: in a price-sensitive market, demand is far more elastic than in a wealthy one, so a discount that aligns with local purchasing power unlocks buyers who would otherwise never convert.
The most cited public case is lightGallery, whose maintainer reported a 15% increase in overall revenue and an 800% increase in revenue from developing countries after switching on purchasing-power-parity pricing, documented in this ParityDeals case study. One honest caveat: lightGallery is a web software library sold direct, not a store-distributed app, so treat it as the cleanest public profit-and-loss demonstration of the PPP effect rather than a like-for-like app benchmark — the store-billing and tax layer changes the exact numbers, not the direction.
The direction is corroborated by where the experiment ranks. In 2026 paywall data from Adapty, localisation is the highest-winning paywall test, succeeding 62.3% of the time — ahead of trial-structure and plan-duration tests, and far ahead of visual or copy changes. When the highest-win-rate experiment in the entire monetisation toolkit is "show the right price in the right market", per-country pricing stops being optional.
In our portfolio, the apps that map prices to local purchasing power before scaling user acquisition see materially better trial-start and paid-conversion rates in Tier-2/3 India than apps running a single FX-converted price — because the price is no longer the silent reason the install never converts.
Why is Spotify ₹119 in India but around $12 in the US?
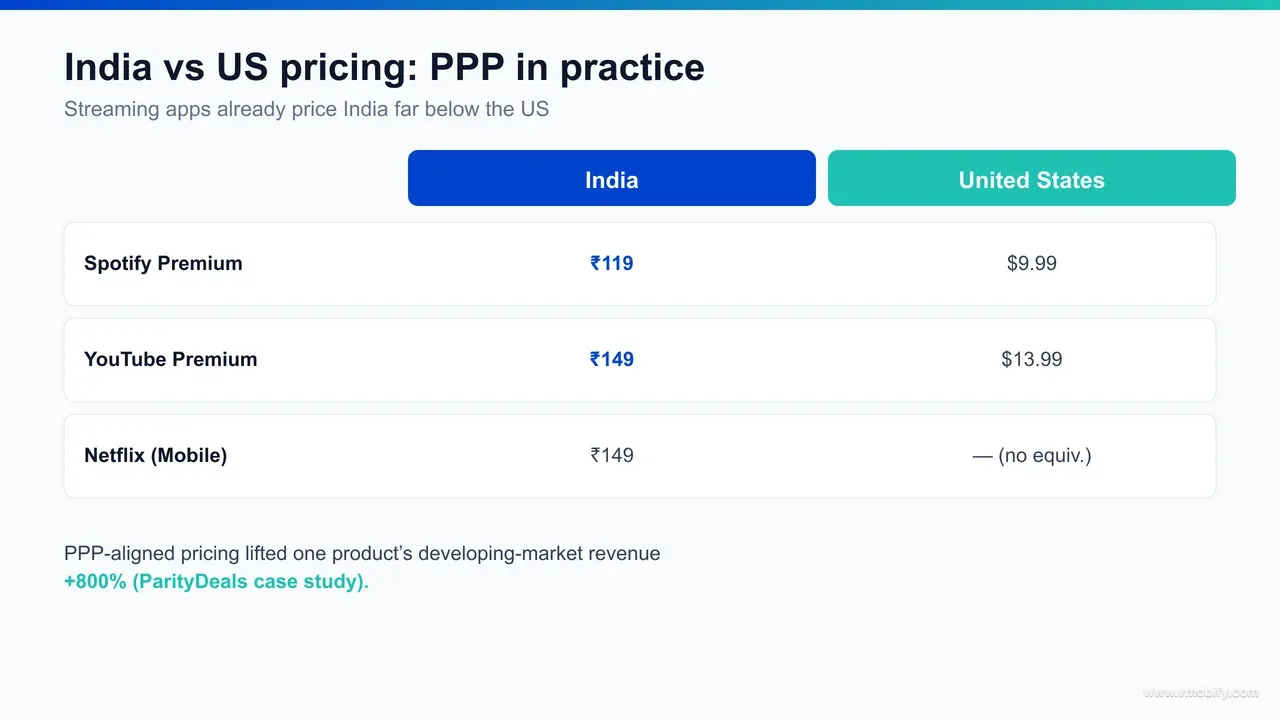
Spotify is cheaper in India because it prices to Indian purchasing power, not to a converted US dollar figure — and the largest subscription apps all do the same, which is the clearest signal that PPP pricing is the norm at scale, not a discount gimmick. A flat global price optimised for the US would price India out of the subscription entirely; a locally anchored price captures a paying base that simply would not exist otherwise.
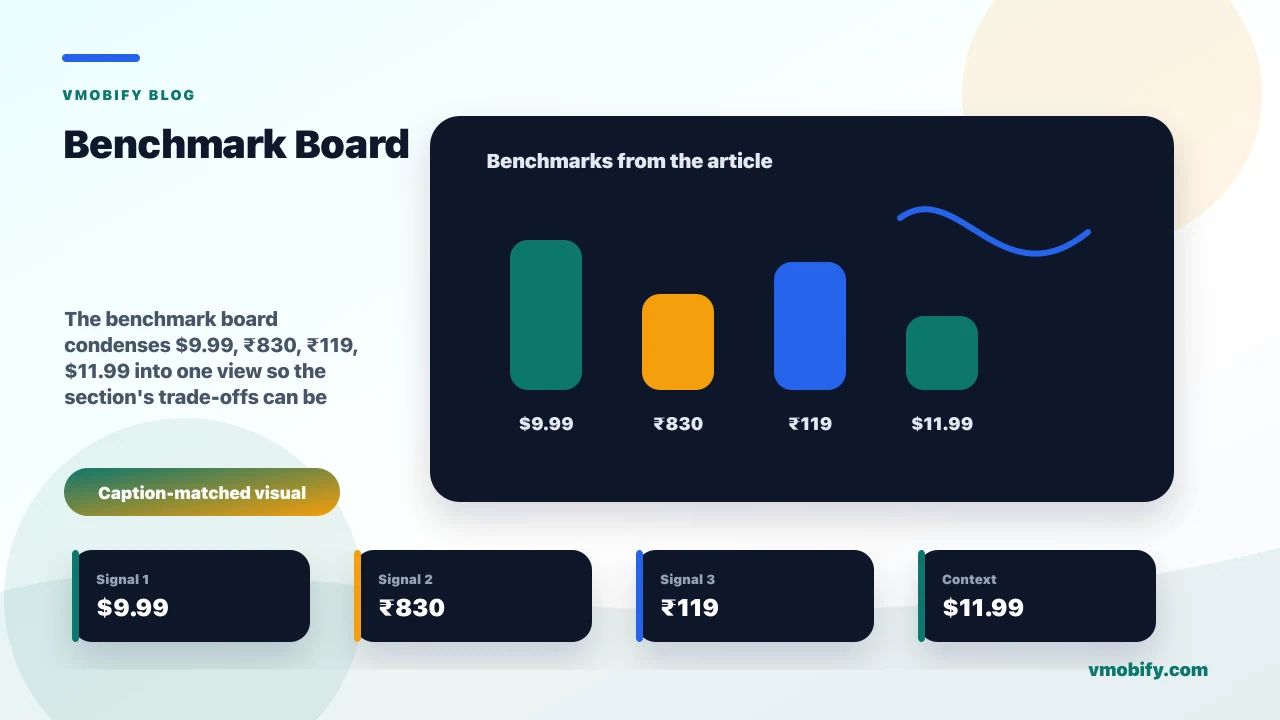
The numbers make the strategy plain. Spotify Premium is ₹119 a month in India versus $11.99 in the US, a gap reported in Billboard's coverage of Spotify's India strategy. At spot exchange rates ₹119 is well under two US dollars — so India is not paying a converted US price minus a token discount, it is paying a price built for the Indian market from the ground up.
Netflix tells the same story. Its India plans run roughly ₹149 to ₹649 a month across mobile, basic, standard and premium tiers, per Netflix's India pricing page, with an entry mobile tier that has no real US equivalent. The pattern across Spotify, Netflix and YouTube Premium is consistent: deep India discounts versus the US, plus India-specific entry tiers designed for a price-sensitive, mobile-first base.
The lesson for any app monetising in India is not "copy Spotify's exact rupee figure" — it is "follow the pattern". The companies with the most pricing data in the world have concluded that India needs a price built for India. An indie or mid-market app running a single FX-converted tariff is implicitly betting it knows better than they do. It almost never does. This is also why we treat pricing as inseparable from the wider app subscription monetisation strategy rather than a number you set once and forget.
How do you calculate a PPP-adjusted price for a country?
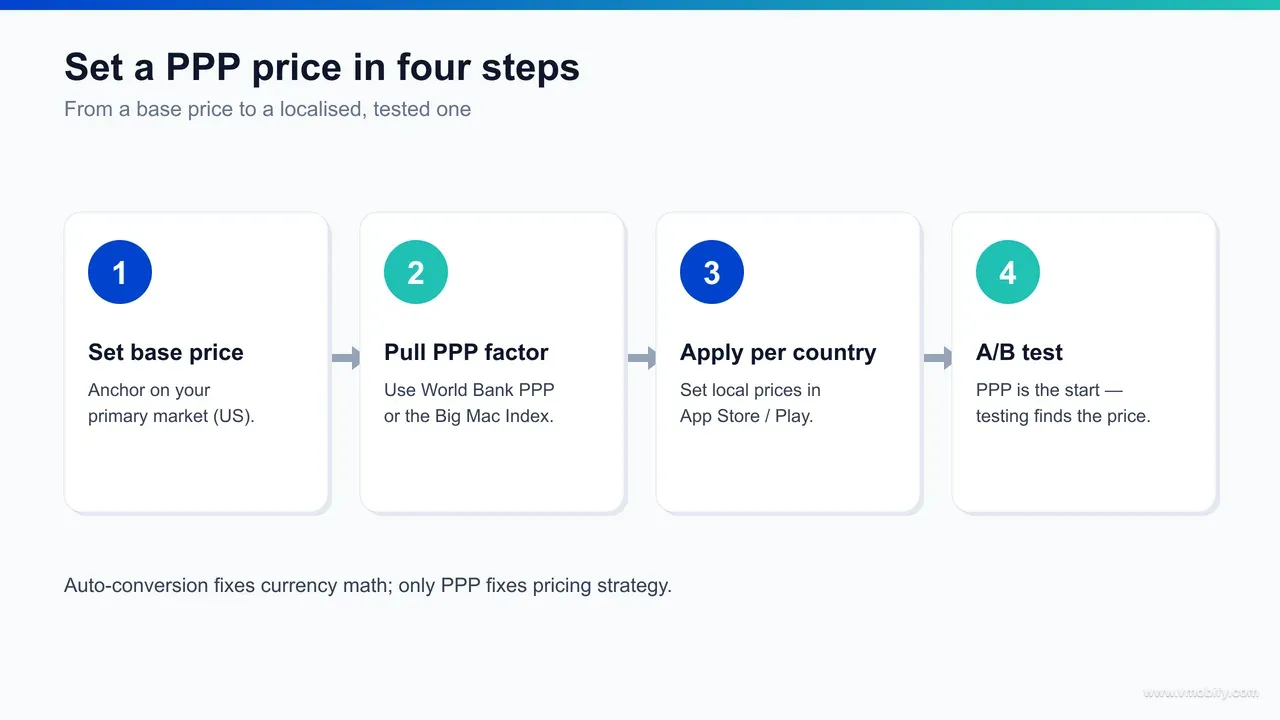
You calculate a PPP-adjusted price by taking your anchor-market price, multiplying it by the target country's purchasing-power ratio to get a starting figure, then rounding to a locally natural price point and A/B testing — the index gives you the starting line, not the finish line. Two public datasets give you that ratio for almost every market on earth.
- World Bank PPP conversion factors: the World Bank publishes a PPP conversion factor for nearly every country, which expresses how many local-currency units buy the same basket of goods as one unit in the reference economy. Its PPP methodology documentation is the authoritative starting reference for a 190-country price map.
- The Big Mac Index: The Economist's index is a lighter, faster proxy for the same idea — it shows how over- or under-valued a currency is against the dollar on a purchasing-power basis, which you can read directly as a rough discount per country.
A worked example: if your US anchor is $9.99 and a country's purchasing power sits at roughly 30% of the US level, your PPP starting price is about $3.00-equivalent in that market, not the $9.99 the store would FX-convert. You then round to the cleanest local price point — in India, a number ending in 9 such as ₹149 or ₹199 reads far more naturally than a literal converted ₹249.30. The rounding step is not cosmetic: a tidy, culturally familiar price point removes a small friction at the exact moment a user is deciding whether to pay, and on a price-sensitive audience those small frictions compound.
Crucially, the index figure is a hypothesis, not an answer. Purchasing power varies within a country, willingness-to-pay varies by category, and competitive prices anchor expectations. We have seen the World Bank ratio land a starting price within striking distance of optimal, but the final 10-20% almost always comes from testing two or three price points against real conversion and retained revenue — which is why pricing decisions should feed straight into your LTV and CAC calculations, not just a conversion-rate dashboard.
How do you set per-country prices on the App Store and Google Play?
Both stores let you override the auto-converted price market by market — on the App Store you edit per-storefront pricing in App Store Connect, and on Google Play you set per-country local prices in the Play Console — so you are never forced to accept the FX-converted default. The default exists for convenience; the override exists precisely so you can apply purchasing-power pricing.
On the App Store, when you choose your subscription or in-app purchase price you pick an anchor and Apple proposes prices across all storefronts. You can then manually adjust the price in any individual storefront — including India — to your PPP-derived figure, drawing from Apple's roughly 900 price points starting at $0.29. The key habit is to never ship the proposed grid unreviewed: open the per-country prices, find your priority markets, and replace the converted numbers with your localised ones.
On Google Play, you set a default price and Play can convert it, but you can override the local price for each country in the pricing section of the Play Console, as covered in Play Console Help. For subscriptions you manage these prices on the subscription's base plans, country by country.
The practical workflow we run across our portfolio is the same on both stores: build your country-to-price map in a spreadsheet first using your PPP method, then enter the overrides for your priority markets, then leave the auto-conversion to handle the long tail of low-volume countries. That gives you deliberate pricing where it matters and a sensible default everywhere else. If you also monetise via in-app purchases in India, pair this with a payment flow built for the market — our guide to UPI Autopay for app subscriptions covers why a localised price still needs a localised billing rail to actually convert.
What changed for Google Play pricing in late 2025?
Google removed Pricing Templates on 27 October 2025, which means the old way of applying one bulk price set across many countries in a few clicks is gone — per-country pricing is now more manual, so your spreadsheet-first workflow matters more than ever. If you previously leaned on templates to push prices to dozens of markets at once, that lever no longer exists.
The change is documented in Play Console Help. Pricing Templates let developers define a reusable price across a group of countries and apply it in bulk; with them retired, you set and update local prices directly per country or per base plan instead. The capability to price every country independently is unchanged — what is gone is the bulk shortcut.
The practical consequences are worth planning for:
- No bulk shortcut: applying a PPP map across many markets is now a more deliberate, country-by-country task rather than one template push.
- Your source of truth moves to a spreadsheet: with no template to hold the canonical prices, your country-to-price map needs to live in a maintained sheet you update before each console change.
- Audit before each price change: without a template enforcing consistency, it is easier to leave a stale price in a market you adjusted months ago — so review your priority-market prices on a schedule.
None of this changes the strategy; it changes the operations. PPP pricing on Play is still entirely possible — it just rewards teams that treat the country price map as a managed asset rather than something assembled ad hoc in the console.
How should India and other Tier-3 markets be priced?
India and comparable Tier-3 markets should be priced at a deep discount to your US tariff — typically a fraction of it — anchored to local purchasing power, ending on natural price points, and ideally with an India-specific entry tier rather than a converted version of your global plan. The mistake is treating India as "US minus a bit"; the reality is India needs its own price built from the ground up.
Start from the purchasing-power gap. India's purchasing power per the World Bank PPP data sits well below the US level, which is exactly why Spotify lands at ₹119 against $11.99 and Netflix offers a ₹149 mobile tier with no direct US equivalent. Your India price should sit in that neighbourhood of discount, not at the ₹830-ish figure a $9.99 anchor FX-converts to.
Three principles we apply for India and similar markets:
- Discount to purchasing power, then test: use the World Bank ratio or Big Mac Index for a starting India price, then A/B test two or three points — the optimal price is frequently lower than teams expect.
- Round to natural price points: ₹99, ₹149, ₹199, ₹299 read as deliberate Indian prices; a converted ₹249.30 reads as an afterthought and quietly suppresses conversion.
- Offer an entry tier: a cheaper mobile-only or limited plan, exactly as Netflix does, captures price-sensitive first-time payers who would never start at your global tier.
The same logic extends across price-sensitive markets — Brazil, Indonesia, Nigeria, the Philippines, Egypt, Turkey and Mexico all warrant their own PPP-anchored prices rather than a single converted number. Each of those economies sits well below US purchasing power on the World Bank data, so each leaves the same untapped demand when an app ships one FX-converted price to all of them. India is simply the market where the gap is widest and the upside largest, which is why we treat it as the lead market in every monetisation engagement we run. Get India right first, then apply the same method down your priority list of emerging markets.
How do you avoid the common PPP pricing mistakes?
The common PPP pricing mistakes are treating the index figure as final, leaving stale prices after the FX or store rules change, ignoring tax and rounding in the displayed price, and forgetting that a localised price still needs a localised payment rail — each one quietly leaks the revenue PPP was meant to capture. Avoiding them is mostly discipline, not difficulty.
- Treating the index as the answer: the World Bank ratio or Big Mac figure is a starting hypothesis. Shipping it untested leaves the final 10-20% of optimisation on the table — always validate with an A/B test on a real metric.
- Letting prices go stale: exchange rates drift, store rules change, and with Google's Pricing Templates gone since October 2025 there is no longer a template enforcing consistency. Review priority-market prices on a schedule, not once.
- Ignoring tax and rounding: both stores apply local tax and rounding on top of your price, so the number a user sees is not always the clean figure you set — check the final displayed price in each storefront, not just the anchor.
- Optimising price but not payment: in India especially, the right price still fails if the only checkout option is a card most users do not have. A localised price needs a localised rail.
One specific caution on evidence: be wary of dramatic third-party figures floating around this topic. We deliberately do not cite any "Spotify lost X India subscribers" number — there is no verified figure behind it — and where secondary pricing-tool benchmarks exist, we treat them as directional rather than precise. Use the World Bank and store-primary sources for the load-bearing claims, and your own test data for the final price.
Get those four disciplines right and PPP pricing does exactly what the data promises: it turns the highest-win-rate experiment in monetisation into durable revenue in the markets you most want to grow. If you want this set up properly — a tested country price map, the store overrides in place, and the India billing rail to match — that is the work our monetisation team runs, and you can talk to us directly about your app's pricing.
Frequently Asked Questions
Does the App Store adjust prices for purchasing power?+
No. The App Store converts your anchor price using exchange rates plus local tax and rounding across 175 storefronts and 44 currencies. That is currency conversion, not purchasing-power adjustment — you have to set per-country prices yourself in App Store Connect to localise for purchasing power.
How many App Store price points are there?+
Apple offers roughly 900 price points starting from $0.29, which gives you fine-grained control to set a PPP-aligned price in each storefront rather than accepting the auto-converted default.
How do you set in-app purchase prices per country on Google Play?+
You set a default price and then override the local price for each country in the pricing section of the Play Console, managing subscription prices on the base plans country by country. Note that Pricing Templates were removed on 27 October 2025, so bulk pricing is now more manual.
Why is Spotify cheaper in India?+
Spotify prices to Indian purchasing power rather than to a converted US figure. Spotify Premium is ₹119 a month in India versus $11.99 in the US — a price built for the Indian market, which is the pattern most large subscription apps follow.
What PPP discount should you apply for India?+
Start from the World Bank PPP ratio or the Big Mac Index, which place India well below the US on purchasing power, so a deep discount — often to a fraction of your US price — is the starting point. Then round to a natural rupee price point and A/B test before fixing it.
Did Google remove pricing templates?+
Yes. Google removed Pricing Templates on 27 October 2025, so applying one price across many countries in bulk is no longer available. Per-country pricing is still fully supported but is now more manual, which is why a spreadsheet-based country price map is the recommended workflow.
How much does localised pricing add to revenue?+
It varies by market and category, but the effect is largest in price-sensitive countries. The cleanest public example lifted overall revenue 15% and developing-market revenue 800% after switching on PPP pricing, and localisation is the highest-win-rate paywall test in 2026 data at 62.3%.
Sources
- Apple Developer — App Store pricing update — Auto-conversion via FX and tax across 175 storefronts and 44 currencies; ~900 price points from $0.29
- Google Play Console Help — Set prices for your apps — Currency conversion, per-country price overrides, and Pricing Templates removal (27 Oct 2025)
- ParityDeals — PPP pricing case study (lightGallery) — +15% overall revenue, +800% from developing countries after enabling PPP pricing
- Billboard — Spotify India strategy and revenue — Spotify Premium ₹119 in India versus $11.99 in the US
- Netflix Help — India plans and pricing — India tiers from roughly ₹149 to ₹649, including a mobile-only entry tier
- World Bank — PPP conversion factor methodology — Authoritative per-country purchasing-power ratios for a 190-country price map
- Adapty — High-performing paywalls 2026 — Localisation is the highest-win-rate paywall test at 62.3%
About the author
Amol Pomane — Founder, Vmobify
Amol leads Vmobify, a mobile app growth agency that has driven 30M+ downloads and ranked 54K+ keywords across 300+ apps since 2013. He writes about ASO, paid user acquisition, retention, and the operational reality of scaling mobile apps in India and global markets.
Free Growth Audit
See exactly how to scale your app with 13+ years of expertise behind you.
Get My Strategy

