App Subscription Monetisation: Pricing, Paywalls & LTV in 2026
A practical subscription operating system for founders: choose the value boundary, test paywalls and trials, localise pricing, model store fees, recover billing failures, and read cohorts without inventing universal benchmarks.
On this page
- When is a subscription the right monetisation model?
- Where should you place your paywall for maximum freemium-to-premium conversion?
- How should you compare monthly and annual plans?
- How long should your free trial be to maximise subscription conversion?
- How do you set pricing for India and other price-sensitive markets?
- How do you reduce subscription churn with win-back flows?
- What in-app purchase model works alongside subscriptions?
- How do you measure subscription health beyond MRR?
- Frequently Asked Questions
When Is a Subscription the Right Monetisation Model?
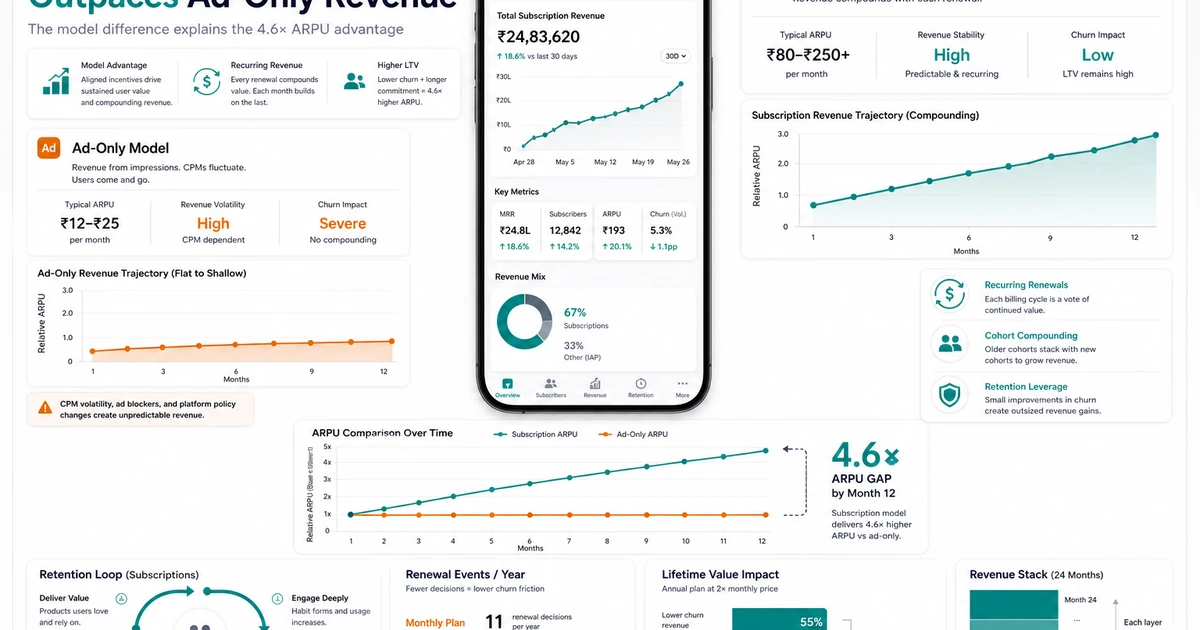
A subscription is appropriate when the app delivers continuing value that users can recognise between renewals and the gross margin can support service, platform fees, refunds, taxes, support and acquisition.
Recurring billing does not create recurring value. A scanner used twice a year, a one-off exam guide, or a finite editing tool may fit a paid download, consumable pack or usage model better. By contrast, products with fresh content, cloud costs, coaching, monitoring, collaboration or an accumulating personal record can justify an ongoing relationship. Start with the user job and cost-to-serve, then choose the revenue mechanism.
Model three cases before implementation: a conservative cohort, the base case, and an upside case. For each, connect paywall exposure to purchase, store proceeds, renewal, refund and variable service cost. Keep monthly and annual cohorts separate. Revenue recognised today is not the same as lifetime value, and an annual cash receipt does not prove the customer will renew next year.
- Recurring user outcome: Write what becomes better next month because the subscription continues.
- Entitlement boundary: Define what remains useful for free and what paid access adds without making the free product deceptive.
- Contribution margin: Include platform fees, infrastructure, support, content, payment recovery, refunds and paid acquisition.
- Exit quality: Cancellation, account deletion, entitlement expiry and data export must behave predictably.
If the pitch depends on making cancellation difficult, hiding the renewal price or charging before value can reasonably be evaluated, the business has a value problem—not a paywall problem. Review the complete funnel with our mobile app funnel analytics guide before increasing acquisition spend.
Where Should You Place Your Paywall for Maximum Freemium-to-Premium Conversion?
Place the paywall at a value boundary the user can understand, then test whether earlier or later exposure produces better retained contribution without harming trust.
The most common mistake in freemium architecture is placing the paywall at the point of maximum user friction — typically right after the onboarding flow, before the user has done anything meaningful in the app. This produces low conversion and high uninstall rates. Users who have not experienced value yet have no reason to pay for it.
Mapping the value moment requires data, not intuition. For a fitness app it might be completing a first workout; for a productivity tool, finishing a project setup and receiving a useful result. Instrument the steps before the paywall, the exposure itself, purchase completion and subsequent retention. A high conversion rate paired with rapid cancellation, refunds or support complaints is not a successful placement.
Use these implementation principles:
- Hard paywall vs soft paywall: Hard paywalls (complete feature lock) convert at higher rates but drive higher uninstall rates among non-converting users. Soft paywalls (access to core features, premium features gated) build larger freemium bases that convert more slowly but with higher LTV. For new apps in competitive categories, soft paywalls typically win. For apps with strong brand or utility differentiation, hard paywalls are viable.
- Contextual triggers: The paywall should feel like a natural next step, not an interruption. "Unlock unlimited workouts — you've just finished your 3rd" is a conversion-friendly trigger. A paywall that appears mid-action or blocks progress towards a goal the user just discovered is an interruption.
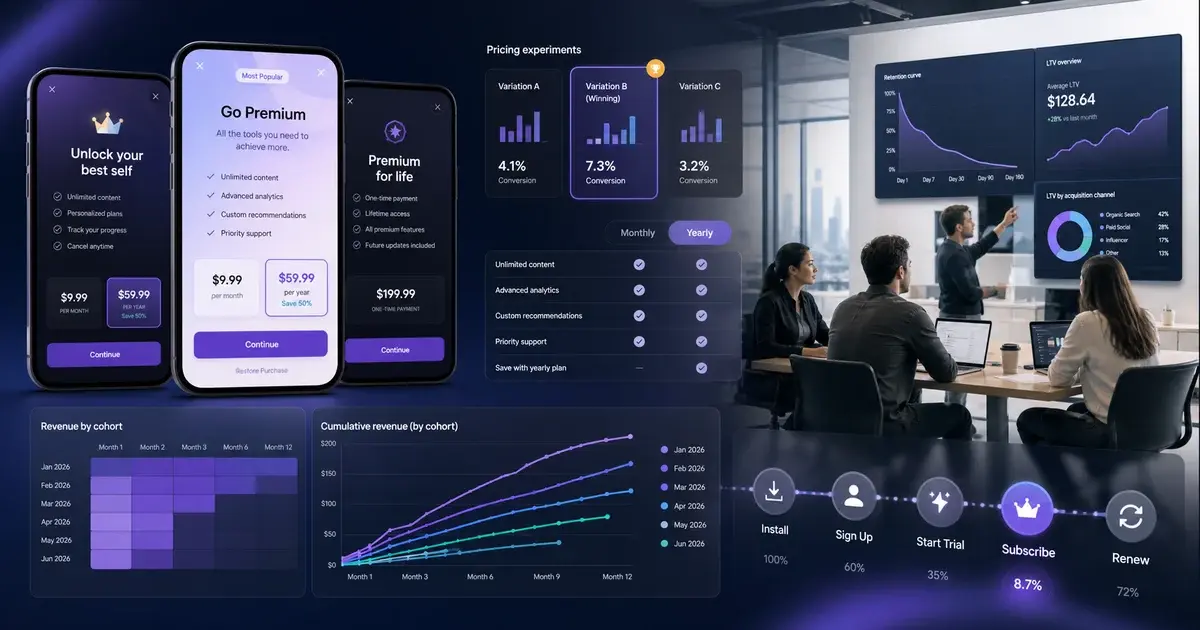
- A/B test the paywall screen itself: Test one meaningful hypothesis at a time: value framing, default plan, proof, trial, or timing. Predeclare the eligible population and primary plus guardrail metrics.
- One CTA per paywall: Multiple pricing options on a single screen create decision paralysis. Present one primary offer with one secondary offer (typically monthly vs annual). More than two choices typically reduces conversion.
Randomise eligible users before exposure, keep offer eligibility stable, and read paid retention after the first renewal where possible. Document assignment, sample size, run dates, store, country and app version so a later team can reproduce the result.
How Should You Compare Monthly and Annual Plans?
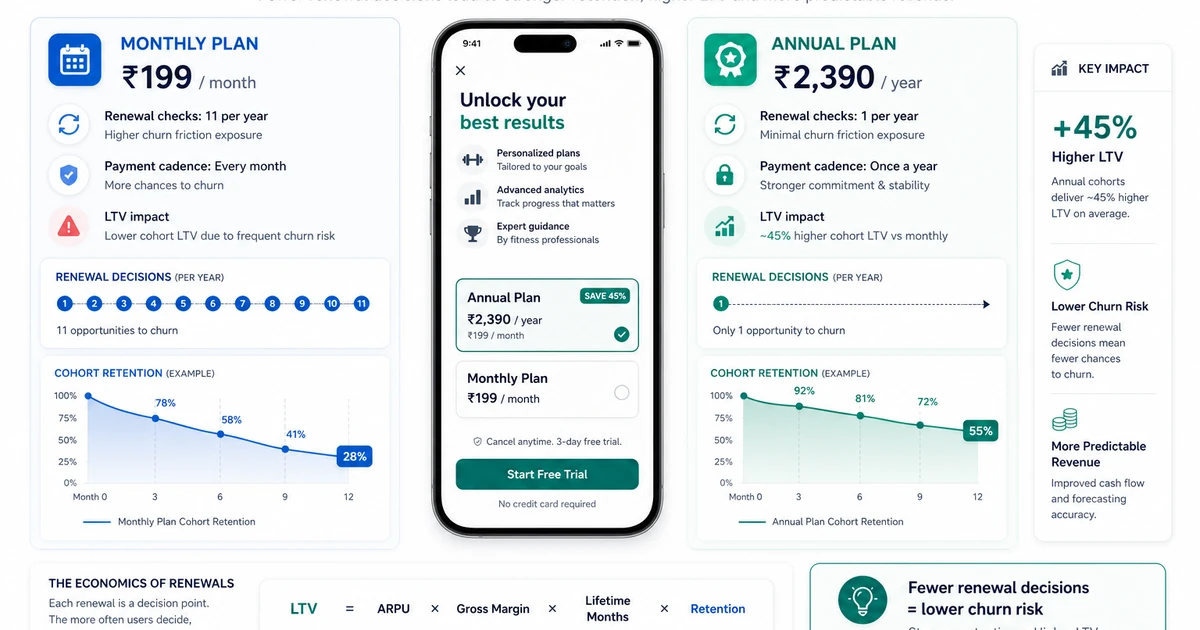
Compare monthly and annual plans through observed cohort economics: net proceeds, cash timing, refund exposure, retention, service cost and renewal—not a universal annual-price multiplier.
Annual plans reduce the number of renewal decisions and bring cash forward, but they also commit the team to longer service delivery and can hide dissatisfaction until renewal. Monthly plans lower the initial commitment and generate faster retention feedback. Neither plan is inherently superior; the right mix depends on the product's value cadence and the user's confidence at purchase.
Use this pricing structure for the annual offer:
- Discount from economics: Start from twelve monthly payments, then test a clearly disclosed annual discount that still funds a full year of delivery. Avoid extreme discounts that buy cash today while destroying future margin.
- Present annual first: On your paywall screen, lead with the annual plan as the primary option. Users anchored to an annual price perceive the monthly price as high. Users anchored to a monthly price perceive the annual as steep. Which anchor you set determines which tier converts.
- Show comparable units: Display total annual charge and the equivalent monthly amount together. Do not make the larger upfront charge visually ambiguous.
- Lifetime plans for niche tools: A one-time purchase can work for utilities with stable scope and low continuing cost. Model the service obligation carefully; “lifetime” revenue collected once cannot sustainably fund indefinite cloud or support expense.
Do not hard-code one commission rule into the model. Apple's subscription guidance distinguishes standard proceeds from its Small Business Program. Google Play's service-fee guidance states a 15% fee for auto-renewing subscriptions, with market and programme exceptions. Verify the current agreement, storefront and programme before forecasting.
For full LTV modelling and cohort analysis methodology, see our LTV:CAC calculator guide — the framework applies directly to annual vs monthly cohort comparisons.
How Long Should Your Free Trial Be to Maximise Subscription Conversion?
No trial length wins across every app. Choose the shortest window in which an eligible user can reasonably experience repeatable value, then test it against at least one credible alternative.
Trial performance is shaped by acquisition intent, onboarding, billing period, reminder design and the time needed to complete the core job. RevenueCat's 2026 benchmark material reports that short trials are common but also notes that longer trials can convert better. Treat category benchmarks as context for an experiment, not a mandate.
Why a shorter trial may outperform:
- Urgency compression: A 7-day trial creates a clear countdown. Users who start a 14-day trial often return to the app on days 1–3, then check out until day 12 when they notice a reminder email. The middle period is dead time. A 7-day trial compresses the whole arc into a single week.
- Fast value cadence: If the product's core job can be completed several times in a week, a longer window may add little learning.
- Intent signal quality: Users who convert on a 7-day trial are demonstrably higher-intent than users who convert on a 14-day trial. The shorter path self-selects for users who found value quickly — exactly the users who will retain longer and churn less.
Category nuances matter significantly:
Fitness/health
- Trial length: 7 days
- Why: The "I want to change my body" motivation is highest in the first week. Capitalise on it.
Productivity/utility
- Trial length: 14 days
- Why: Users need time to integrate the tool into their workflow. A week is not enough to create genuine dependency.
Education/learning
- Trial length: 7 days with structured milestone nudges
- Why: Push users to complete a lesson series within the trial window rather than exploring freely.
Entertainment/games
- Trial length: No trial needed
- Why: Consumption products should be freemium with consumption limits (e.g. "5 free episodes") rather than time-limited trials.
Read trial start rate, activation, conversion, cancellation before renewal, refund, and retention after the first paid period together. Segment by storefront, country, acquisition source and offer because a blended conversion rate can hide a weak cohort. See our app retention strategy guide for the onboarding system around the trial.
How Do You Set Pricing for India and Other Price-Sensitive Markets?
Localise subscription prices by storefront using willingness-to-pay, competitive context, tax and margin evidence; purchasing-power parity is a useful starting hypothesis, not a guaranteed uplift.
India combines enormous download volume with different incomes, payment habits, category expectations and local alternatives from Western markets. Translating a US price at the spot exchange rate therefore answers an accounting question, not a willingness-to-pay question. Evaluate Indian cohorts directly and avoid treating a diverse market as one price-sensitive segment.
Practical PPP pricing implementation checklist:
- Apple App Store Pricing: Apple's pricing tiers now include local currency options for India. Use the "Manage Pricing" section in App Store Connect to set independent INR pricing. Do not convert your USD price to INR at spot rates — set INR pricing using local market research, typically ₹79–₹149/month for most categories.
- Google Play Pricing: Play Console supports per-country pricing overrides. Set INR pricing independently. The Play Store's "Pricing Templates" feature allows consistent local pricing across multiple apps if you manage a portfolio.
- Candidate price points: Build a small ladder from local alternatives, the economic value of the outcome and your contribution margin. Test it rather than publishing an invented category benchmark.
- Annual plans: Show the total local-currency charge, equivalent monthly amount, saving versus twelve monthly payments and renewal terms clearly.
The broader principle is price localisation, not blanket discounting. Compare eligible-user conversion, net proceeds per eligible user, paid retention, refunds and support contacts. Hold product and offer presentation stable where possible, and retain the store experiment export. Google Play's price experiments provide a native control-based route for eligible products.
Roll out a local price when the test improves durable net contribution without breaching refund, complaint or retention guardrails. A higher conversion rate alone is insufficient if the price reduction lowers contribution or attracts users who cancel immediately.
Launch price is harder to change than teams expect, so decide it deliberately rather than defaulting. Two asymmetries shape the call. Raising a price later is straightforward for new subscribers but awkward for existing ones, who must be handled through the platform's price-change mechanics. Lowering a price is easy mechanically and expensive in signal — it tells the market your first number was wrong and rewards the users who waited. Given that, launching slightly high with a well-designed introductory offer is usually the safer error: the offer gives you a discount lever that does not touch the headline price, and it is reversible. What you should not do is set the launch price from a competitor's page, because their price encodes their retention, their mix and their funding position, none of which you can see. If you have no data, price against the value of the outcome you deliver and plan to test within the first quarter — Play's native price experiments make that testable per market with real controls.
How Do You Reduce Subscription Churn With Win-Back Flows?
Reduce churn by separating voluntary cancellation, billing failure and engagement decay, then use the platform recovery controls and messages appropriate to each state.
Most subscription churn in consumer apps is passive, not active. Users do not cancel because they hate the product — they cancel because they stopped opening it, forgot they were paying for it, or hit a billing failure they did not bother to resolve. Each of these churn types has a different recovery mechanism, and treating them as the same problem is a significant error.
Churn type breakdown with recovery tactics:
- Payment failure churn (involuntary): Configure billing retry and grace periods in each store, then mirror entitlement state correctly in the backend. Apple documents eligible grace-period durations based on subscription length; Google lets developers configure eligible recovery behaviour. Verify current documentation rather than assuming a universal three-day window.
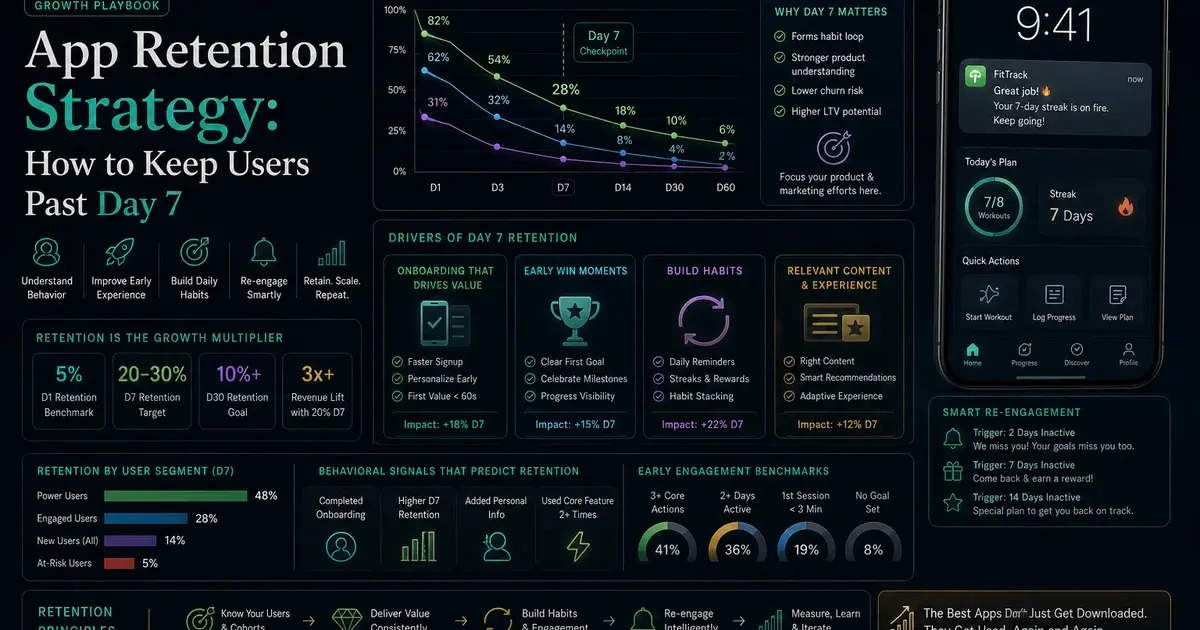
- Engagement decay churn (passive): Users who stop opening the app before cancelling are detectable before they churn. Key predictive signals: fewer than 3 sessions in the first 7 days post-install, or no in-app action within 48 hours of install. Users who hit these thresholds before their first renewal are at extreme churn risk. Intervene with a targeted re-engagement push before the renewal, not after cancellation.
- Value-not-felt churn (active): Users who cancel explicitly because they did not find value need a win-back offer, not a generic "come back" push. A 30–50% discount on the first month of reactivation, presented with a specific feature highlight they did not use during their original subscription, converts win-back at roughly double the rate of generic discount offers.
Win-back flow structure that works in our portfolio:
- Day 0 (cancellation/lapse): Acknowledge the cancellation without friction. If the platform and product support it, offer a clearly explained pause—but never obstruct cancellation or turn a pause into a disguised renewal.
- Day 3 post-cancellation: Push notification or email with a specific feature re-engagement hook, not a generic discount. "You had 3 workouts tracked — pick up where you left off."
- Day 7 post-cancellation: Win-back offer with discount or trial extension. This is when the offer lands.
- Day 21 post-cancellation: Final push with a "we've added X since you left" feature highlight. Users respond to the idea that the product has improved since they left.
Measure recovery on net revenue that remains paid after a suitable observation window. Message delivery, opens and reactivation clicks are diagnostic metrics, not the business outcome. See our app retention strategy guide for the full onboarding-to-win-back retention arc.
What In-App Purchase Model Works Alongside Subscriptions?
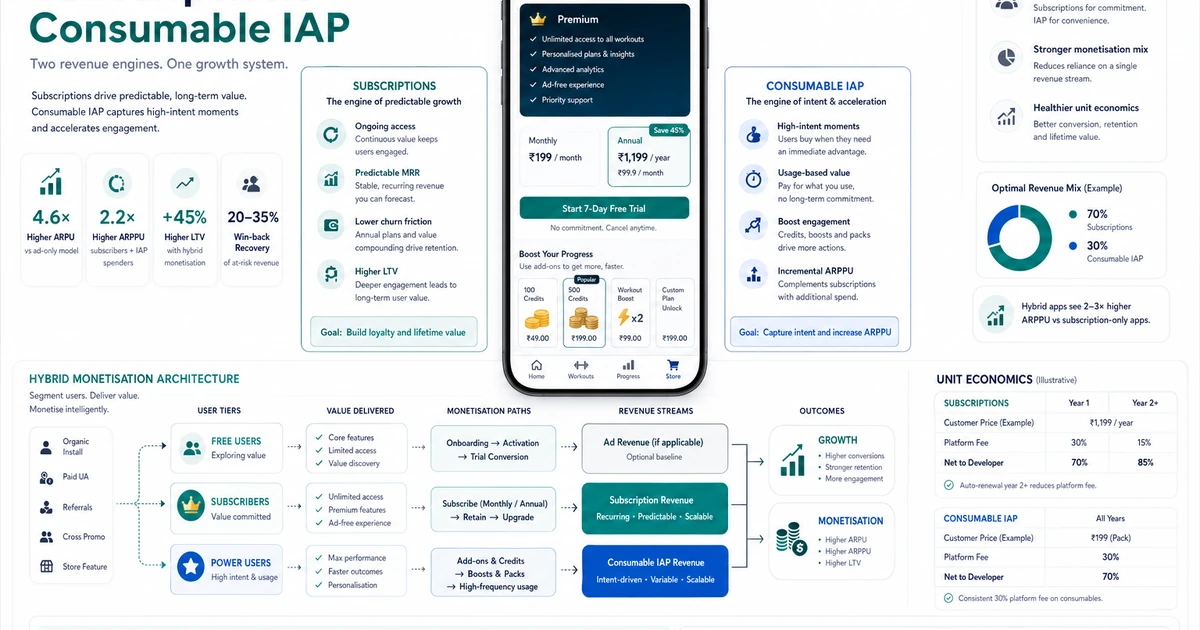
Consumable IAPs — one-time purchases that unlock specific content, boosts, or credits — work exceptionally well alongside subscriptions because they serve a fundamentally different purchase motivation: the desire for immediate, specific gratification rather than ongoing access.
The mistake teams make is treating subscriptions and IAPs as competing models. They are not. They serve different user segments and different purchase moments within the same user's journey. A well-structured app can generate revenue from all three tiers simultaneously: free users (ad revenue or viral growth), monthly subscribers (recurring access revenue), and high-intent power users (consumable IAP on top of subscription).
IAP models that complement subscriptions:
- Consumable content unlocks: In a fitness app, the subscription provides access to the workout library. A premium "advanced strength programme" at ₹299 one-time provides something specific and finite. Users who value the core subscription will pay extra for specific premium content — especially if it is clearly bounded and not just "more of the same."
- Boost mechanics: In learning apps, consumables can accelerate progress — extra practice sessions, streak insurance, extended daily goals. These serve high-engagement users who want more than the subscription provides, without requiring an entirely separate tier.
- Credits or tokens: For apps with AI features or API-backed functionality, a credit system lets users pay for usage above the subscription baseline. This is especially relevant in 2026 as AI inference costs make unlimited-use subscriptions economically unsustainable at scale.
- One-time add-ons: Premium themes, export formats, integrations, or customisation packs. These work best when the core subscription provides genuine standalone value — the add-ons are upgrades, not repairs to a weak product.
What does not work: using IAPs to make the subscription feel incomplete. If a reasonable user believes the plan includes a capability and encounters another compulsory purchase, the architecture creates distrust and billing complaints. Test hybrid offers with entitlement clarity, refund and support guardrails—not ARPPU alone.
Use the fee schedule that actually applies to the developer, product type, programme, storefront and transaction. Apple and Google operate multiple programmes and some regional alternatives; a single 30% assumption is no longer a reliable model. Keep fee rules configurable and date-stamped. Visit our monetisation services page if you need a full IAP architecture review.
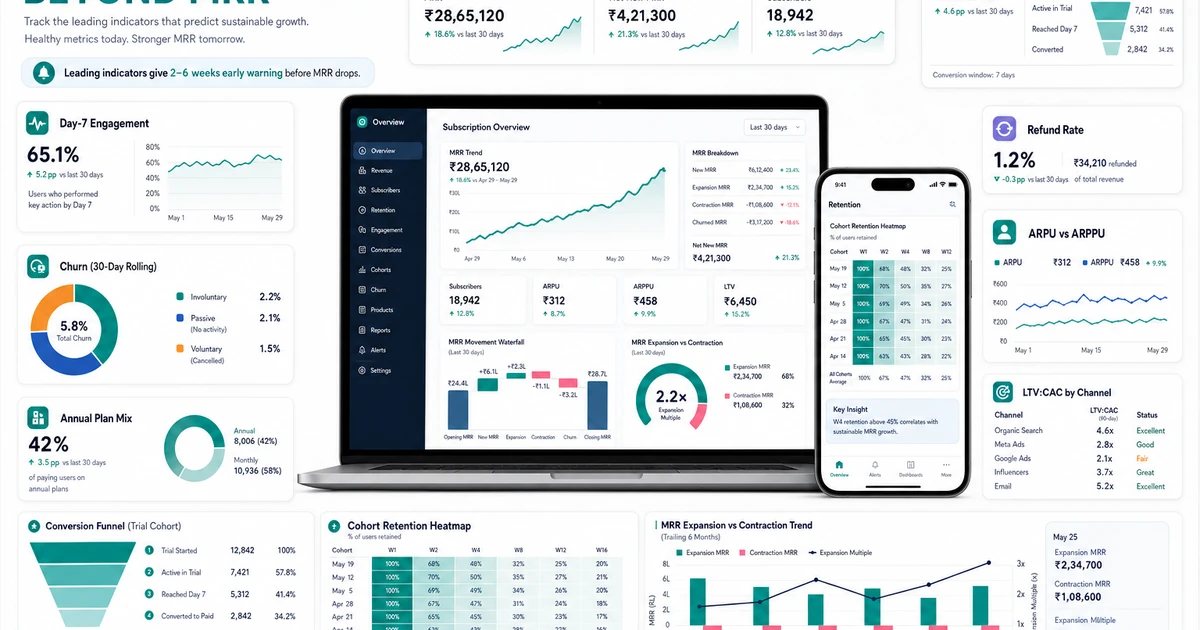
How Do You Measure Subscription Health Beyond MRR?
MRR is a lagging indicator — by the time it declines, the underlying problem has been present for weeks or months. The subscription health metrics that give you lead-time to intervene are trial conversion rate, day-7 engagement rate among trial users, voluntary churn rate, and LTV:CAC ratio by acquisition channel.
Building a complete subscription health dashboard requires tracking across four dimensions simultaneously: acquisition, conversion, retention, and monetisation efficiency. Teams that only monitor one or two of these miss critical signals until they become crises.
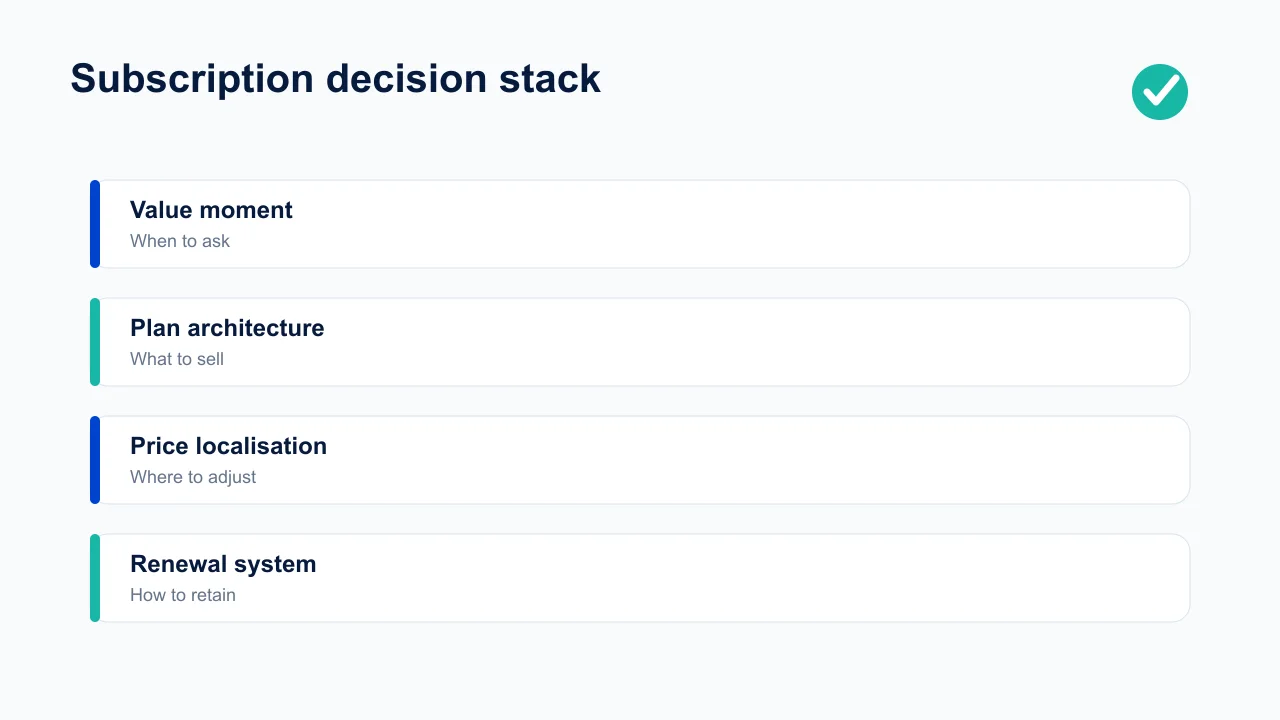
The eight metrics that make up a complete subscription health view:
- Trial-to-paid conversion rate: Use current category, price-point, region and acquisition benchmarks as context, then compare against the app's own stable cohorts. Diagnose changes through trial eligibility, activation and offer mix before attributing them to paywall copy.
- Early trial engagement: Measure whether trial users reach and repeat the core value event before billing. Choose the observation window from the product's value cadence and trial length rather than assuming day seven fits every app.
- Voluntary and involuntary churn: Separate explicit cancellation from billing failure and measure both by plan and tenure. The interventions differ: payment recovery helps involuntary churn; product value, expectation and pricing work address voluntary churn.
- MRR contraction vs expansion: MRR changes from existing subscribers (upgrades, downgrades, pauses) tell you more about product satisfaction than new MRR from new subscribers. Expansion MRR (existing users upgrading or buying IAPs) is the healthiest revenue signal in a mature subscription app.
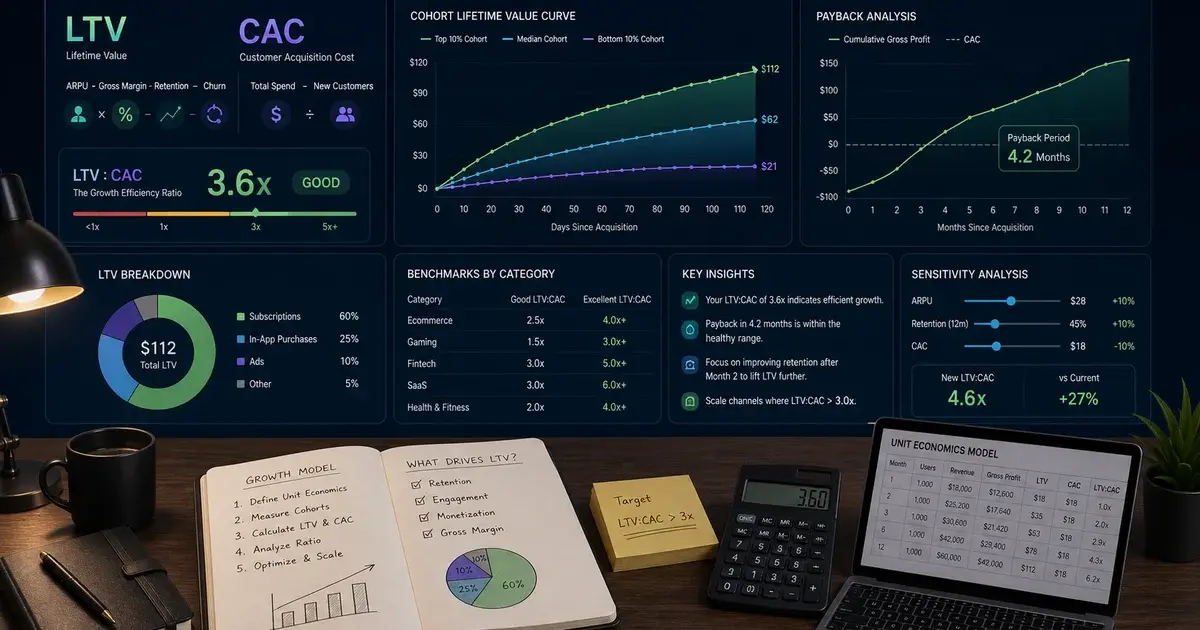
- LTV:CAC by channel: Set the acceptable ratio from gross margin, payback tolerance, overhead and capital constraints. A blended ratio can hide loss-making paid cohorts behind organic acquisition. See our LTV:CAC calculator for channel-level analysis methodology.
- Annual plan mix: Track plan mix as context for cash timing and renewal exposure, not as a target by itself. Forcing annual selection can improve short-term cash while worsening refunds, trust or later renewal.
- Refund and complaint rate: Trend refunds and billing-related support contacts by offer and storefront. Set an internal investigation threshold from baseline and risk appetite instead of claiming one universal platform limit.
- ARPU vs ARPPU: Average revenue per user (across your entire user base) vs average revenue per paying user. A large gap between these numbers indicates either a very successful freemium model or a very leaky paywall — context determines which. Tracking both separately clarifies the freemium architecture question.
Review the scorecard on a cadence that matches decision speed, and preserve metric definitions when the analytics stack changes. Measurement discipline matters because it exposes whether growth came from more eligible users, better conversion, stronger retention or merely a more aggressive offer. For a worked example, see our fitness app marketing case study or talk to our team about a subscription health audit.
Frequently Asked Questions
What is a good freemium-to-premium conversion rate for a subscription app?+
There is no trustworthy universal rate. Compare like-for-like cohorts by category, region, price, acquisition source and eligibility, then read conversion beside paid retention, refunds and contribution. A benchmark can flag a question; it cannot diagnose the cause.
Should I charge the same price in India as in the UK or US?+
Do not simply convert a US or UK price at the spot exchange rate. Use storefront-level pricing, local alternatives, taxes, margins and willingness-to-pay evidence. Test candidate prices and decide on durable net contribution, retention, refunds and support impact—not conversion alone.
How much do Apple and Google take from subscription revenue?+
The applicable fee depends on platform, programme, product, market and transaction route. Apple documents standard subscription proceeds and its Small Business Program separately; Google Play documents a 15% fee for auto-renewing subscriptions with exceptions and regional alternatives. Verify current terms before modelling.
Is a 7-day or 14-day free trial better for conversion?+
Neither wins universally. Choose windows long enough for the core value cycle, then test eligible cohorts. Evaluate activation, trial conversion, cancellation, refunds and retention after the first paid period together.
What is the best way to reduce involuntary churn from billing failures?+
Enable and correctly mirror each store’s billing-retry and grace-period states, then send clear payment-update guidance through permitted channels. Grace duration and eligibility vary by platform and configuration, so verify current documentation. Measure durable recovered proceeds rather than notification opens.
Can I run both subscriptions and one-time IAPs in the same app?+
Yes. Consumable credits or bounded add-ons can complement recurring access when each purchase has a clear job and the subscription remains coherent on its own. Model store fees and fulfilment cost, prevent duplicate delivery, and avoid making paid subscribers repurchase capabilities implied by their plan.
Sources
- Apple Developer — Auto-Renewable Subscriptions — Subscription proceeds, offer types, retention tools, and platform implementation guidance
- Apple Developer — App Store Small Business Program — Eligibility and commission terms for qualifying developers
- App Store Connect Help — Enable Billing Grace Period — Current grace-period eligibility, duration, and entitlement behaviour
- Google Play Console Help — Service Fees — Current service-fee schedule and programme distinctions
- Google Play Console Help — Subscriptions — Official subscription setup, pricing, lifecycle, and recovery guidance
- RevenueCat — State of Subscription Apps 2026: Utilities — Large-sample subscription pricing, trial, conversion, and retention context
- Google Play Console Help — Price Experiments — Native testing of in-app product prices by market
About the author
Amol Pomane — Founder, Vmobify
Amol leads Vmobify, a mobile app growth agency that has driven 30M+ downloads and ranked 54K+ keywords across 300+ apps since 2013. He writes about ASO, paid user acquisition, retention, and the operational reality of scaling mobile apps in India and global markets.