How Much UA Can You Actually Afford This Month?
Your payback period is six months and your LTV:CAC looks healthy, so the model says spend more. The model is not wrong — it is answering a different question. Ad spend leaves your account in days, store revenue arrives up to 45 days after the month it was earned, and the platform keeps its share first. That gap, not your payback period, sets your ceiling this month.
On this page
- Why is a healthy payback period not permission to spend?
- How long does the money take to reach your bank?
- What does the store keep before you see anything?
- How much can Google actually charge you this month?
- How do you size your cash gap?
- What happens to the gap when you grow?
- Which levers close the gap fastest?
- So how much can you afford this month?
- When should you stop scaling even though the maths works?
- Frequently Asked Questions
Why is a healthy payback period not permission to spend?
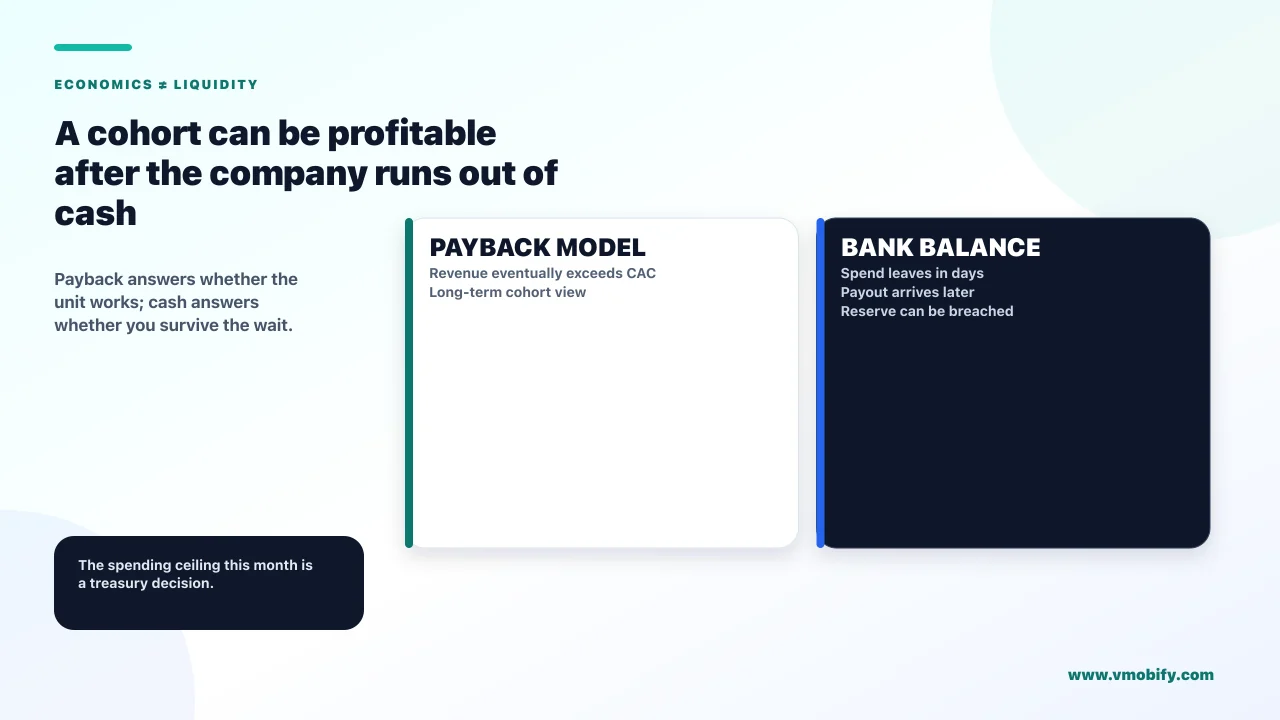
Because payback period answers whether the business works and cash answers whether you survive until it does — and a company can be right about the first while going broke on the second. These are two different questions and founders routinely answer one while asking the other.
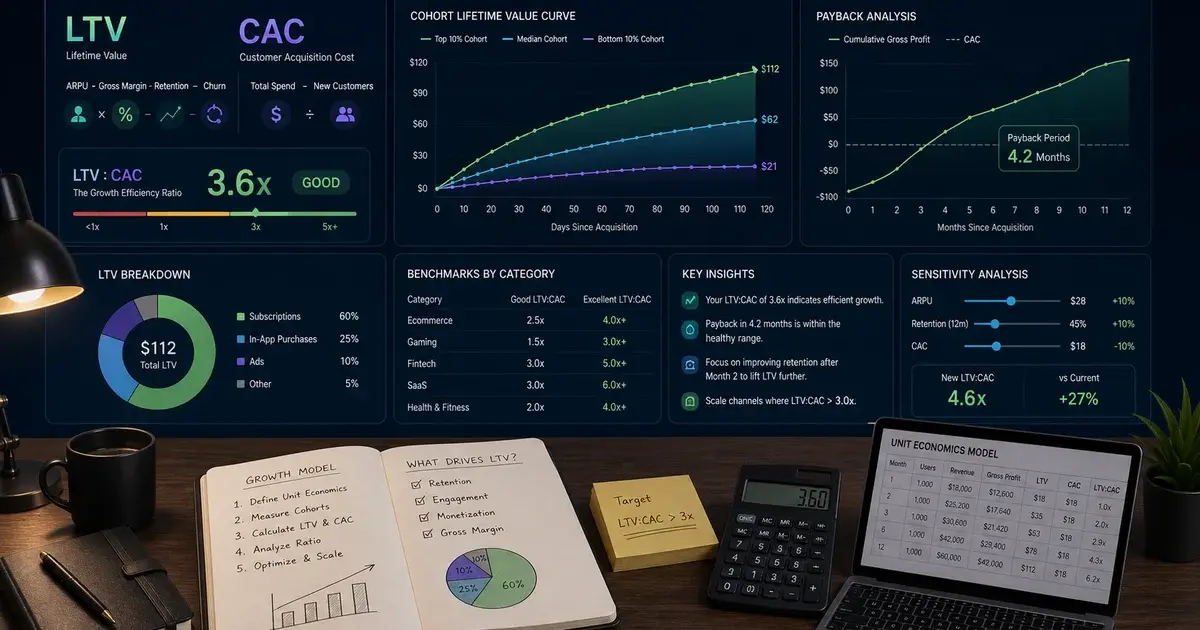
The unit economics question is well covered and worth getting right: what a user is worth, what they cost, and how long the recovery takes. AppsFlyer's guidance puts a good LTV to CAC ratio at at least 3:1, meaning lifetime value at least three times acquisition cost, and our own ROAS and CAC guide works through payback period properly.
The cash question is different and almost never written about. It is: of the money you spend on acquisition in September, how much comes back in September, and what funds the gap?
The unit economics question
- Is a user worth more than they cost?
- Answered by LTV, CAC and payback period
- Decides whether to be in this business at all
- Timescale: months to years
The cash question
- Can you pay the ad platform next week?
- Answered by payout timing, fees and billing terms
- Decides what you can spend this month
- Timescale: 30 to 75 days
Across the 300+ apps we have managed since 2013, the most common scaling failure is not a bad LTV model. It is a correct LTV model funded from an account that ran dry, forcing an abrupt spend cut at exactly the moment campaigns had stabilised — which then destroys the learning, raises the CPI, and makes the unit economics look worse than they were.
How long does the money take to reach your bank?
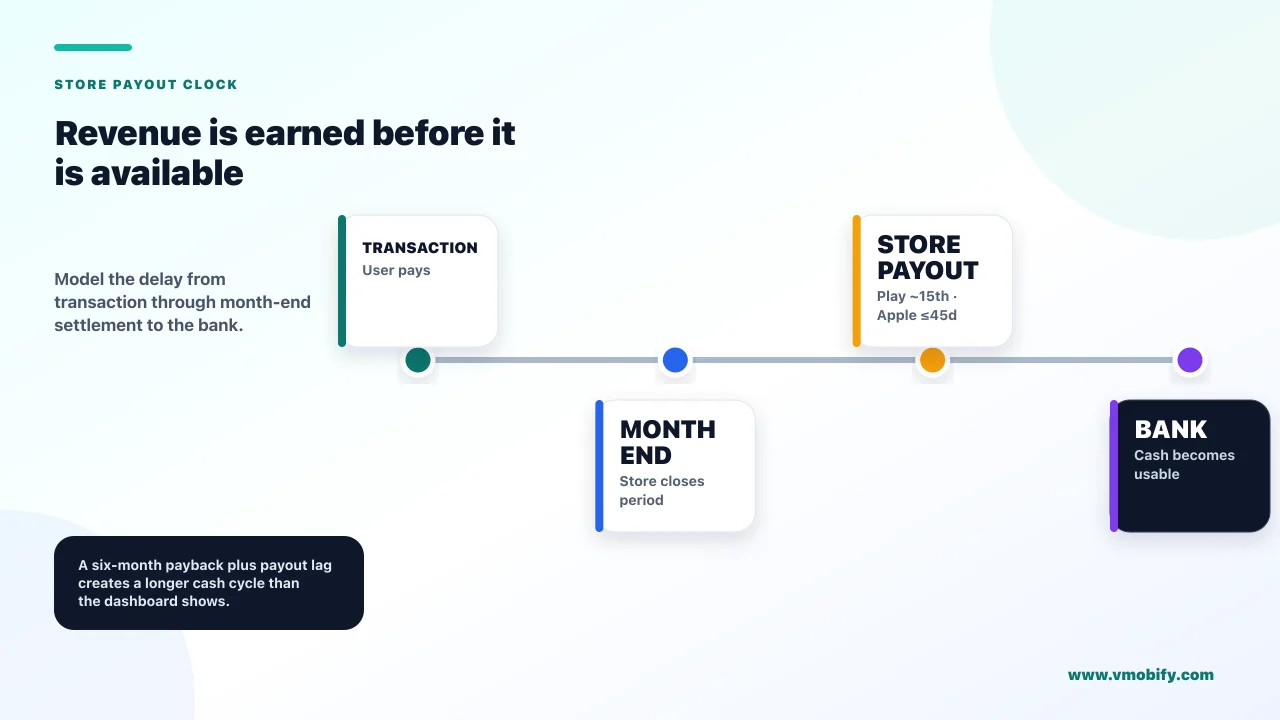
Both stores pay on a monthly cycle in arrears, and Apple's documented window runs to 45 days after the end of the fiscal month in which the transaction completed. Nothing about this is unreasonable, and almost nobody models it.
Apple's guidance on receiving payments states that payments are made within 45 days of the last day of the fiscal month in which the transaction was completed, based on the Apple fiscal calendar, with financial reports for the previous fiscal month available by the first Friday of the current one. Payments are consolidated by currency into a single payment per currency per fiscal month, and you must exceed a minimum monthly payment threshold for each country or region in which you sell.
Google's order processing and payouts documentation is more compressed: any orders processed, refunded or charged back from the 1st of a given month to the end of that month get paid out around the 15th of the following month. Minimum payout thresholds are US$1 for local currency and US$100 for USD wire transfer, and it may take several days after Google initiates the deposit for your bank to credit the account.
Work an example through. A sale on 2 September sits inside the September cycle, which pays out around 15 October on Play — roughly six weeks later. The same sale on the App Store falls in a fiscal month whose payment window extends up to 45 days past its close. In both cases the ad spend that produced that sale was billed in September.
Google's payout description covers orders processed, refunded or charged back in the same cycle. Refunds reduce the payout rather than arriving as a separate bill, so a month with unusual refund activity produces a smaller deposit with no warning attached. If you forecast from gross revenue rather than from expected payout, you will be over-optimistic by exactly the amount you can least predict.
What does the store keep before you see anything?
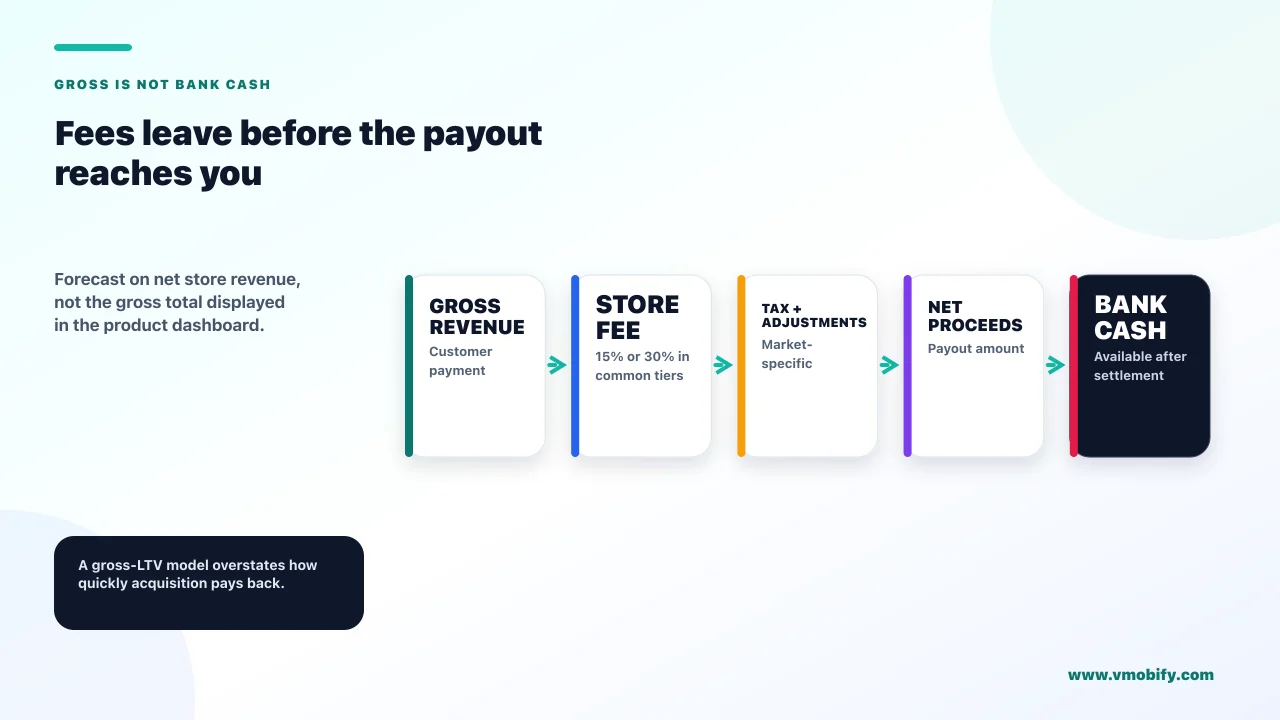
A service fee that is 15% or 30% depending on your revenue and product type in most markets — so the revenue in your dashboard is not the revenue in your forecast. Modelling payback on gross store revenue overstates your position by a fifth to a third before anything else happens.
Google's service fees documentation sets out the structure. Outside the EEA, UK and US, developers enrolled in the 15% tier pay 15% on the first $1M USD annually and 30% above that, while subscriptions are 15% regardless of revenue, and qualifying programmes can be 15% or lower. In the EEA, UK and US a restructured schedule applies with separate billing-fee components. In South Korea and India, using an alternative billing system reduces the service fee by 4% compared with Google Play's billing system.
Three consequences for how you budget:
- Subscriptions are structurally better for cash at 15% than one-time purchases that cross the $1M threshold into 30%. That is a monetisation model decision with a direct cash consequence, not only a retention one.
- The fee tier changes as you grow. Crossing $1M in annual revenue does not double your costs, but it does change your marginal economics — and a payback model built at 15% quietly becomes wrong at the margin.
- The India alternative-billing reduction is real but small. Four percentage points is worth having; it is not a strategy, and the engineering and support burden of running an alternative billing system should be weighed against it honestly.
The practical rule is to build every model on net revenue after the fee, and to state the fee assumption explicitly in the model so it can be corrected when your tier changes. Our LTV and CAC calculator guide covers where this belongs in the wider calculation.
How much can Google actually charge you this month?
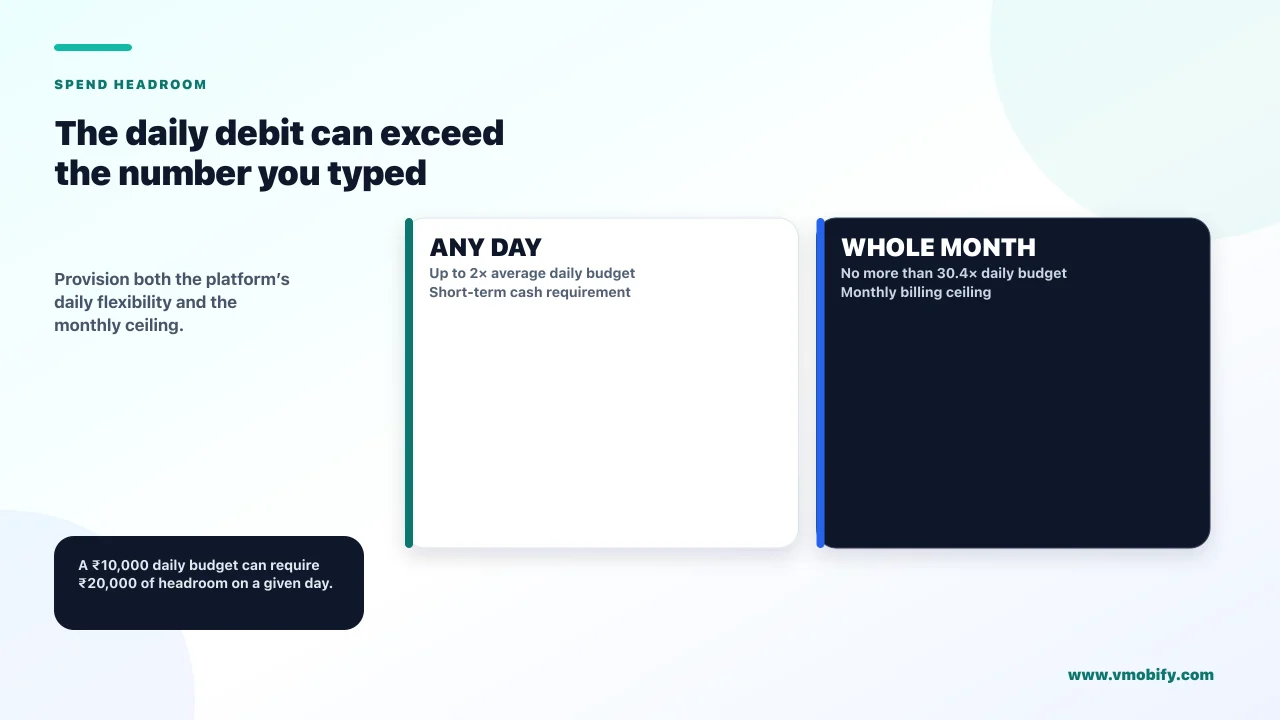
Up to twice your average daily budget on any given day, though no more than 30.4 times it across the month — which means your daily cash requirement is not the number you typed into the campaign. This catches people out precisely when they are trying to be careful with cash.
Google's documentation on average daily budgets is explicit on both halves. On a given day, your campaign might spend up to twice your average daily budget to take advantage of fluctuations in traffic. And at the end of the month, you will have spent no more than 30.4 times your average daily budget.
So the monthly total is capped and predictable. The daily draw is not. A ₹10,000 daily budget can produce a ₹20,000 day, and if that happens across several campaigns simultaneously during a high-traffic period, your worst day is materially larger than your plan.
Why this matters more than it sounds: ad platforms bill against a payment method with its own limits and terms, and a declined charge does not pause gracefully. It stops delivery, which resets exactly the learning stability you were paying to build. We cover what that costs in why your Google App campaign stopped spending.
Size your available funds against roughly twice your average daily budget across your active campaigns, not against the average itself. The monthly figure will still land at or under 30.4 times the average — you are provisioning for the timing, not for a larger total. This is a treasury decision that takes ten minutes and prevents the most avoidable interruption in paid acquisition.
How do you size your cash gap?
Multiply your monthly acquisition spend by the number of months before that cohort's revenue actually reaches your bank — and use net revenue after fees, not the dashboard figure. The result is the working capital your growth requires, and most founders have never calculated it.
- Take monthly UA spend. The real figure including agency fees and creative production, not just media.
- Convert expected revenue to net. Apply your actual service fee tier — 15% or 30% depending on product type and revenue — before anything else.
- Apply the payout lag. Play pays around the 15th of the following month; Apple pays within 45 days of fiscal month end. Revenue earned in month one is cash in month two or three.
- Apply your payback curve. If a cohort returns its cost over six months, only a fraction of month one's spend comes back in month one — and even that fraction is delayed by step three.
- Add a refund allowance. Refunds and chargebacks net against payouts in the same cycle rather than arriving separately.
The number that falls out is not intuitive. Even a business with excellent unit economics needs several months of acquisition spend available as working capital simply to run at a constant rate, because it is always funding cohorts whose revenue has not arrived yet. Growing means that requirement grows too.
This is the calculation that makes the difference between an app business that scales steadily and one that lurches. In our experience the lurching pattern — spend hard, run short, cut abruptly, restart — costs far more than the slower path, because every cut resets campaign learning and every restart pays the learning cost again.
What happens to the gap when you grow?
It widens, because you are always funding your largest cohort before your earliest one has paid back — growth consumes cash even when every cohort is profitable. This is the counter-intuitive part, and it is why profitable app businesses run out of money.
The mechanism is arithmetic. If you spend more each month than the month before, the cohort you are currently funding is bigger than the cohort currently paying you back. The faster you grow, the larger that mismatch. A business doubling its spend every quarter with a six-month payback is, at every moment, funding twice as much as it is recovering.
Subscription apps have a specific version of this, and it cuts both ways. RevenueCat's State of Subscription Apps 2025, drawn from a benchmark set it describes as 75,000 subscription apps and over $10B in tracked revenue, reports that across all categories LTV rises by nearly 60% from month 1 to year 1.
Read that from a cash perspective rather than a valuation one. Most of the value of a subscription cohort arrives long after you paid to acquire it — which is excellent for the business and difficult for the bank account. The better your retention, the further into the future your money sits, and the more working capital the same growth rate requires.
The planning consequence is that your growth rate is constrained by your cash, not by your unit economics, until you have either enough reserves or external funding to bridge the gap. A founder asking "should we spend more?" is usually asking a unit economics question and receiving a unit economics answer, when the binding constraint is elsewhere entirely.
Which levers close the gap fastest?
Anything that pulls revenue forward beats anything that increases revenue later, when cash is the constraint. That inverts the usual monetisation priority list, and it is only the right inversion while the gap is binding.
- Move the paywall earlier, or add an earlier paid moment. Revenue in week one rather than month three changes the cash position of every cohort you acquire. This is a trade against long-term LTV and should be made consciously and reversibly.
- Favour annual plans where they suit the product. Annual billing collects the year's revenue at the start of the relationship rather than across it. The cash effect is immediate and large.
- Check your service fee tier and eligibility. Subscriptions at 15% versus one-time purchases above the $1M threshold at 30% is a substantial difference in net revenue on identical gross.
- Shorten the acquisition-to-value path. Faster activation means faster first payment, which is a cash lever disguised as an onboarding improvement.
- Shift mix toward faster-paying channels while the constraint binds, accepting that this may not be the highest-LTV mix.
Two things are not levers, however tempting. Cutting spend abruptly closes the gap by shrinking the business, and it costs you the campaign stability you paid for. And raising bids to "make the spend work harder" does not accelerate anything — it increases the outflow while the inflow timing stays exactly the same.
The honest framing for a board or a co-founder is that these are cash-flow decisions with an LTV cost, taken deliberately for a period. Presenting an earlier paywall as a pure improvement, when it is a trade, is how teams end up permanently monetising in a way that suited a cash crunch they no longer have.
So how much can you afford this month?
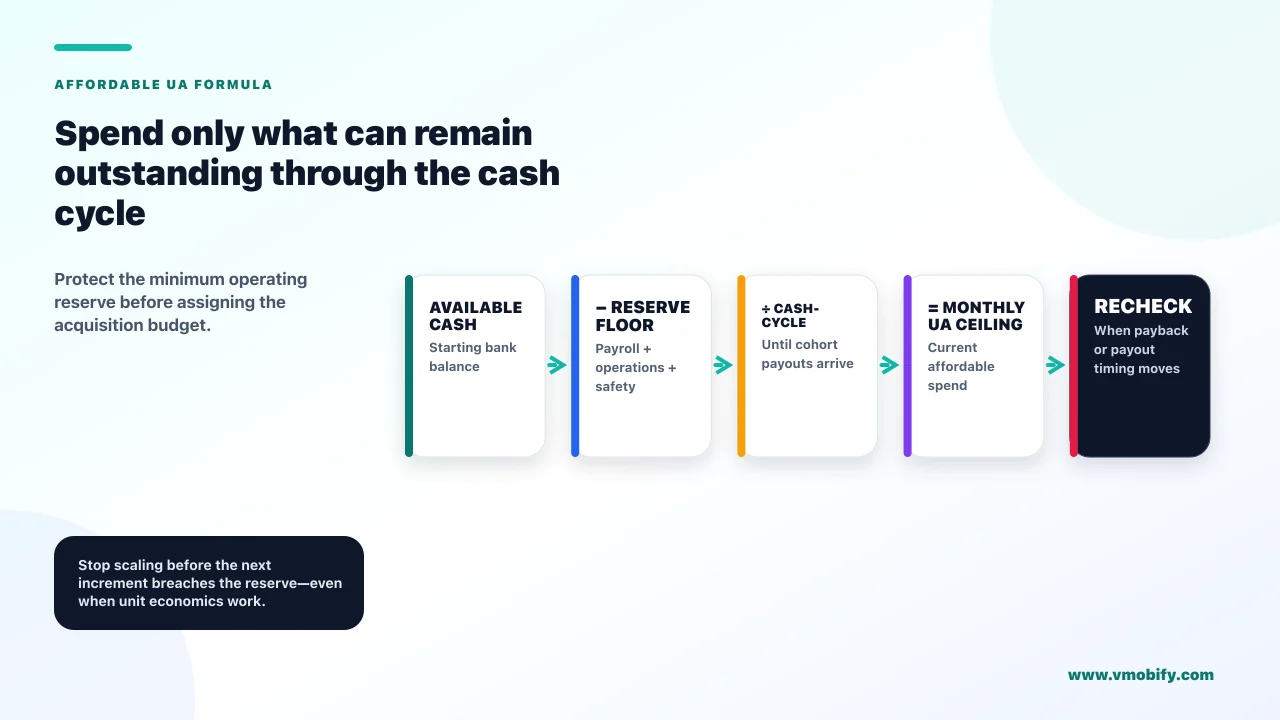
The amount you can leave outstanding for the length of your cash cycle without breaching your minimum balance — which is a treasury calculation, not a marketing one. Here is the version we actually use with clients.
- Start with cash on hand, minus the reserve you refuse to go below. Be honest about the reserve; it exists to survive a surprise, not to be spent.
- Subtract committed non-UA outgoings for the length of your cash cycle — payroll, infrastructure, everything contracted.
- Add expected store payouts that will actually land inside that window, net of service fees, based on payout timing rather than earning dates.
- Divide the remainder by your cycle length in months. That is your sustainable monthly UA ceiling at a constant rate.
- Provision daily headroom at around twice your average daily budget so a high-traffic day does not decline a charge.
- Only then check the unit economics to confirm that spending it is worth doing at all.
Notice the ordering. Unit economics is the last step, not the first. It answers whether you should spend the money you have; it never tells you how much money you have.
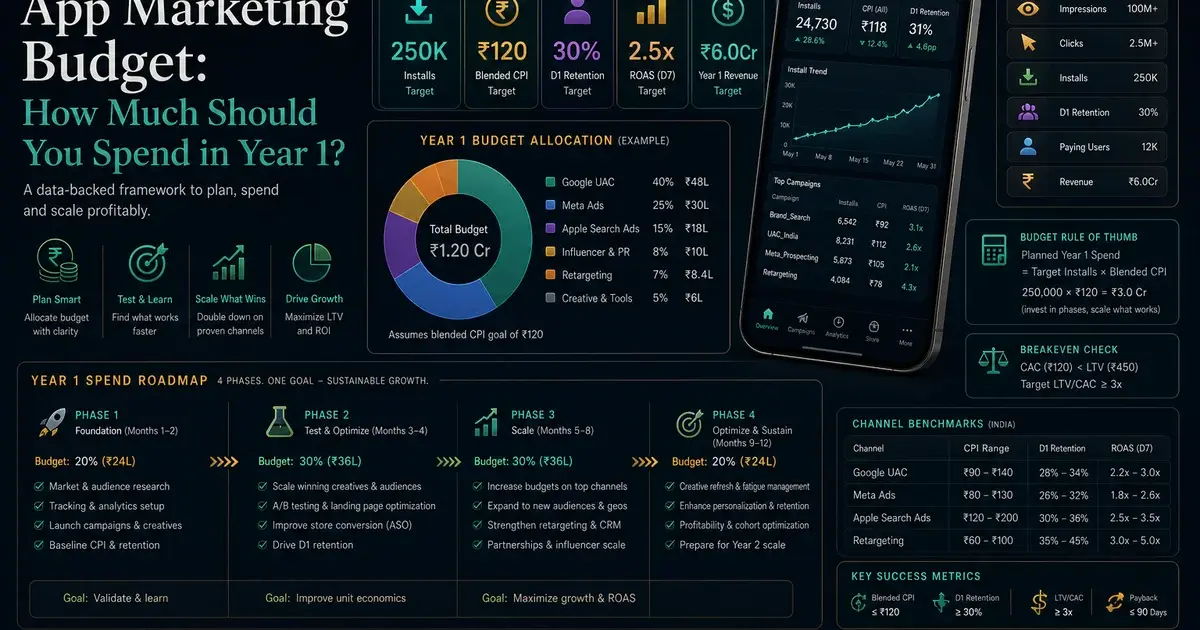
If the ceiling this produces is lower than your ambition, the options are genuinely limited: pull revenue forward using the levers above, raise capital to bridge the gap, or grow more slowly. There is no fourth option, and treating a cash constraint as a marketing problem is how the abrupt-cut cycle starts. Our guide to app marketing budgets in year one covers where a realistic ceiling tends to land by stage, and what an install actually costs in India covers the other side of the equation.
When should you stop scaling even though the maths works?
When the next increment would take you below your reserve, when your payback is lengthening rather than holding, or when you cannot yet see whether the last increment worked. Each is a stop signal on its own, and none of them shows up as a bad LTV:CAC ratio.
- The reserve test. If funding the increase means going below the balance you decided you would never breach, the answer is no regardless of how good the economics look. The economics assume you are still operating when the money arrives.
- The lengthening payback test. Scaling reaches less responsive audiences, so cohorts acquired at higher spend commonly pay back more slowly. A payback period that is drifting outward while spend rises means your cash cycle is lengthening at the same time as your outflow is growing — the two worst things happening together.
- The visibility test. If you cannot yet tell whether last month's increase worked, this month's increase is a guess compounding a guess. On iOS especially, where measurement is modelled and settles over weeks, a monthly scaling cadence can outrun your ability to read results.
- The concentration test. If nearly all your growth depends on a single channel, the cash-adjusted risk of scaling is higher than the ratio suggests, because a single policy or delivery event can stop the inflow while the outflow is already committed.
The discipline that helps most is to separate the two questions permanently in how you report. Put unit economics and cash position on the same page, as two distinct sections, so nobody can answer one while asking the other. In our portfolio, teams that do this scale more slowly at first and considerably further in the end, because they never have to execute the abrupt cut that undoes six months of campaign stability.
If you want a second pair of eyes on whether your ceiling is set by your economics or by your cash — they call for completely different responses — tell us what the two numbers are, or see how we approach spend planning in our user acquisition work.
Frequently Asked Questions
How long after a sale do I actually get paid?+
Apple states payments are made within 45 days of the last day of the fiscal month in which the transaction was completed. Google Play pays orders processed from the 1st to the end of a month around the 15th of the following month, with several more days possible before your bank credits the account.
Why does my profitable app keep running out of cash?+
Because growth consumes cash even when every cohort is profitable. If you spend more each month than the last, the cohort you are funding now is larger than the one paying you back now, and store payouts arrive weeks after the revenue is earned. This is a working capital problem, not a unit economics problem.
How much should I keep available for ad spend?+
Provision against roughly twice your average daily budget across active campaigns, because Google states a campaign might spend up to twice the average on a given day to take advantage of traffic fluctuations. The month still lands at no more than 30.4 times the average, so you are provisioning for timing rather than a bigger total.
What service fee should I model?+
It depends on your market, product type and revenue. Outside the EEA, UK and US, developers in the enrolled tier pay 15% on the first $1M annually and 30% above, while subscriptions are 15% regardless. State the assumption explicitly in your model, because crossing the threshold changes your marginal economics.
Do refunds show up as a separate bill?+
On Google Play, no. Orders processed, refunded or charged back within a month are all settled in that month’s payout, so refunds reduce the deposit rather than arriving separately. Forecasting from gross revenue therefore overstates cash by an amount you cannot easily predict.
Should I switch to annual plans to fix cash flow?+
It is one of the fastest levers, because annual billing collects the year’s revenue at the start of the relationship rather than across it. Treat it as a deliberate trade rather than a pure improvement, and revisit it once the cash constraint eases — otherwise you permanently monetise for a crunch you no longer have.
My LTV:CAC is above 3:1. Can I scale?+
That ratio says spending is worthwhile, not that you can afford it. Check whether the increment takes you below your reserve, whether payback is lengthening as you scale, and whether you can yet read the result of your last increase — on iOS especially, where measurement settles over weeks. Any one of those is a stop signal.
Sources
- Apple — Overview of receiving payments — Payment within 45 days of fiscal month end, and the minimum payment threshold.
- Google Play — Order processing and payouts — Payout around the 15th of the following month, thresholds, and refunds netted in-cycle.
- Google Play — Service fees — The 15% and 30% tiers, subscription rate, and the India alternative-billing reduction.
- Google Ads — Average daily budget and spending limits — Up to twice the daily average on a given day; no more than 30.4 times across a month.
- AppsFlyer — Lifetime value (LTV) glossary — Both LTV formulations and the at-least-3:1 LTV to CAC benchmark.
- RevenueCat — State of Subscription Apps 2025 — LTV rising nearly 60% from month 1 to year 1 across a stated 75,000-app benchmark set.
About the author
Amol Pomane — Founder, Vmobify
Amol leads Vmobify, a mobile app growth agency that has driven 30M+ downloads and ranked 54K+ keywords across 300+ apps since 2013. He writes about ASO, paid user acquisition, retention, and the operational reality of scaling mobile apps in India and global markets.
Model an install budget
Turn CPI and activation assumptions into acquisition scenarios.
Open free tool