ROAS, Blended CAC & UA Budget Allocation: The Financial Side of Growth
ROAS, CAC, LTV:CAC and payback period are the four numbers that decide whether paid growth funds itself or quietly drains your runway. Here is how to calculate each one correctly, why the 3:1 ratio is a rule of thumb and not a law, and how to allocate a UA budget by marginal ROAS in a low-ARPU market.

What is ROAS and how do you calculate it?
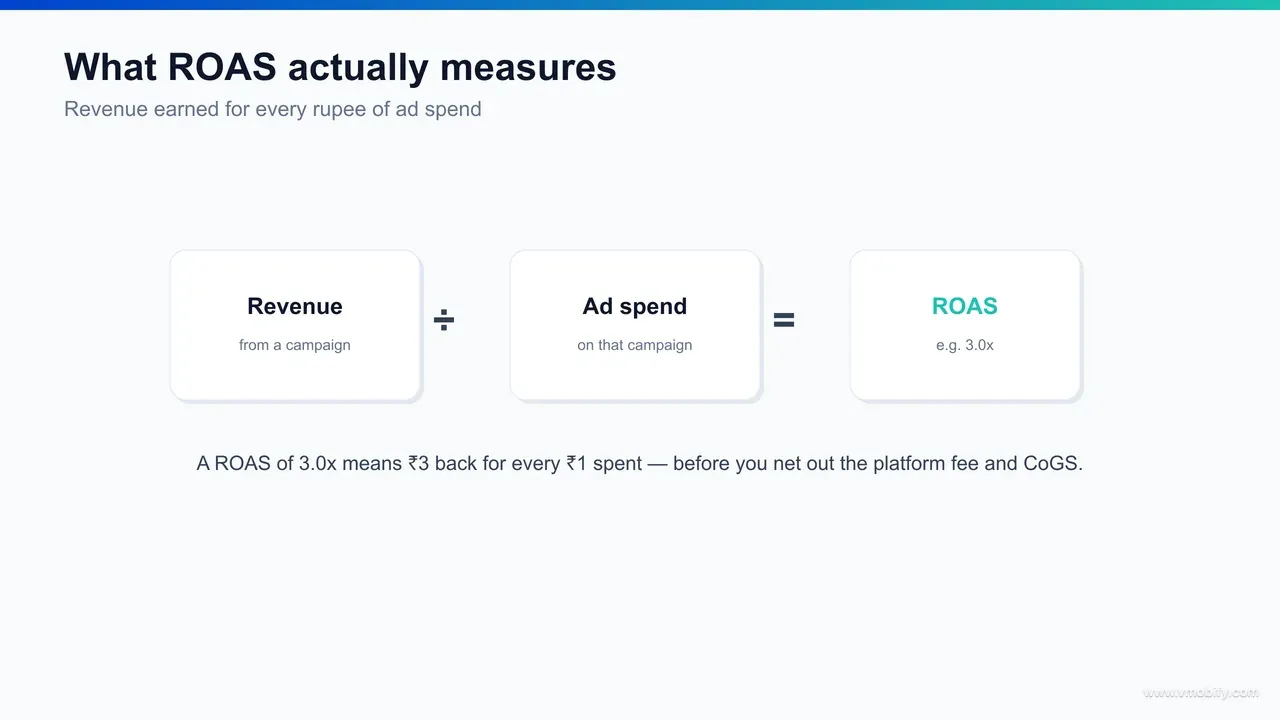
ROAS — return on ad spend — is the revenue a campaign generates divided by what you paid to run it, expressed as a multiple or a percentage: ₹3 of revenue for every ₹1 of spend is a 3.0x ROAS, or 300%. It is the most-quoted number in performance marketing and one of the most misread, because the headline figure means nothing until you anchor it to a margin and a time window.
The formula itself is trivial. If you spend ₹500,000 on a campaign and the users it acquired generate ₹650,000 in revenue, your ROAS is 650,000 ÷ 500,000 = 1.3x. The hard part is everything the formula hides: which revenue, measured over what period, and whether that revenue is gross or net of the 15-30% the app stores take before a rupee reaches you. A 1.3x gross ROAS on a product carrying a 70% store-and-payment cost is a loss; the same 1.3x on a software subscription with near-zero marginal cost is a strong result.
That is why "target ROAS" is the number that actually drives decisions, and why it cannot be borrowed from a benchmark report. Your break-even ROAS is simply 1 ÷ gross margin. An app keeping 40 paise of contribution on every rupee of revenue breaks even at a 2.5x ROAS and needs to clear that just to stand still. An app keeping 85 paise breaks even at roughly 1.18x. Two campaigns reporting the same ROAS can sit on opposite sides of profitability, and any team that scales against a generic "good ROAS is 3x" rule will overspend in one business and starve growth in another.
Across the 300+ apps we have managed since 2013, the single most useful reframing we give a new client is this: ROAS is not a grade you are trying to maximise, it is a ratio you are trying to hold above a margin-derived floor while you push volume. The job of user acquisition is to deploy as much capital as possible while keeping ROAS above that floor — not to chase the highest ROAS, which usually just means you are underspending on a channel that could absorb far more.
Google's own bidding documentation makes the same point in product form: its App Campaigns target-ROAS bidding asks you to set a tROAS goal and then optimises spend toward it, precisely because the platform cannot know your margin — only you can set the floor it should defend.
How is ROAS different from ROI and CAC?
ROAS, ROI and CAC answer three different questions: ROAS asks "how much revenue did this spend return," ROI asks "how much profit did it return after all costs," and CAC asks "what did it cost to acquire one customer" — and using one as a proxy for another is where most reporting goes wrong.
The cleanest way to keep them straight is to follow a single rupee through the funnel.
- ROAS is revenue ÷ ad spend. It only counts media cost in the denominator and gross revenue in the numerator. It is fast, channel-comparable, and what the ad platforms optimise toward — but it ignores margin, store fees, and every non-media cost.
- ROI is (profit − total cost) ÷ total cost. It nets out store commissions, payment fees, creative production, tooling, and often headcount. A 3x ROAS can be a negative ROI once those layers are subtracted, which is exactly how a campaign can look like a winner in the ad dashboard and a loser in the P&L.
- CAC is total acquisition spend ÷ customers acquired. It is a per-unit cost, not a return ratio. CAC pairs with LTV to tell you whether a customer is worth more than they cost; ROAS pairs with margin to tell you whether a campaign cleared its floor.
A worked example makes the gap concrete. Say a campaign spends $10,000 and drives $25,000 in gross in-app purchase revenue — a tidy 2.5x ROAS. Now subtract a 30% store fee ($7,500), $2,000 of creative production, and $1,500 of attribution and analytics tooling allocated to the campaign. Net contribution is 25,000 − 7,500 − 2,000 − 1,500 − 10,000 = $4,000, an ROI of 40% on the fully-loaded cost. Still positive — but a very different story than "2.5x" implies, and the difference is the entire reason finance and growth teams argue.
The practical rule we use across our portfolio: report ROAS for channel optimisation and pacing because it is fast and the platforms speak it, but never sign off a scaling decision on ROAS alone — convert to contribution-margin ROI and to CAC-versus-LTV before you move budget. ROAS is the dashboard speedometer; ROI and CAC are the fuel gauge and the map.
What is the difference between blended and paid CAC?
Blended CAC divides total marketing spend by every new customer — paid and organic combined — while paid CAC divides paid spend by only the customers paid media actually acquired; blended is the right number for board-level health, and paid CAC is the only honest number for channel scaling decisions. Mixing them, almost always by dividing paid spend across all customers, is the most common self-deception in app finance.
The arithmetic of why it matters: imagine a month with ₹20,00,000 of paid spend producing 4,000 paid customers, plus 6,000 organic customers who cost nothing in media. Blended CAC is 20,00,000 ÷ 10,000 = ₹200. Paid CAC is 20,00,000 ÷ 4,000 = ₹500. Those are not two views of the same number — they are 2.5x apart, and a team that scales paid budget against the ₹200 blended figure is silently assuming the organic users will keep arriving for free at the same rate while paid volume grows. They will not.
This gap is especially wide for Indian apps, where organic install share tends to be high thanks to strong word-of-mouth, referral mechanics, and attribution that often under-credits paid touchpoints. We have repeatedly seen Indian apps where blended CAC looks healthy at ₹150-200 while paid CAC sits at ₹450-600 — and the moment paid spend scales, organic does not keep pace, so blended CAC rises toward paid CAC and the previously "profitable" plan stops working.
The distinction that resolves most of these arguments is the marginal one. The real question is not "what is my average paid CAC" but "what does the next customer cost" — because acquisition cost rises as you push deeper into an audience and exhaust the cheapest inventory. We will return to this when we get to budget allocation, but the principle starts here: blended CAC for the narrative, paid CAC for the channel, and marginal CAC for the next rupee.
One operational note from our portfolio: we instrument both numbers from day one and report them side by side, because the gap between blended and paid CAC is itself a diagnostic. A narrowing gap as you scale is a warning that organic is not keeping up; a stable gap means your organic engine is scaling with paid, which is the healthier pattern. For the full treatment of how these feed into the unit-economic picture, our LTV vs CAC calculator and benchmarks guide walks through the calculation inputs end to end.
What is the LTV:CAC ratio, and is 3:1 really the target?
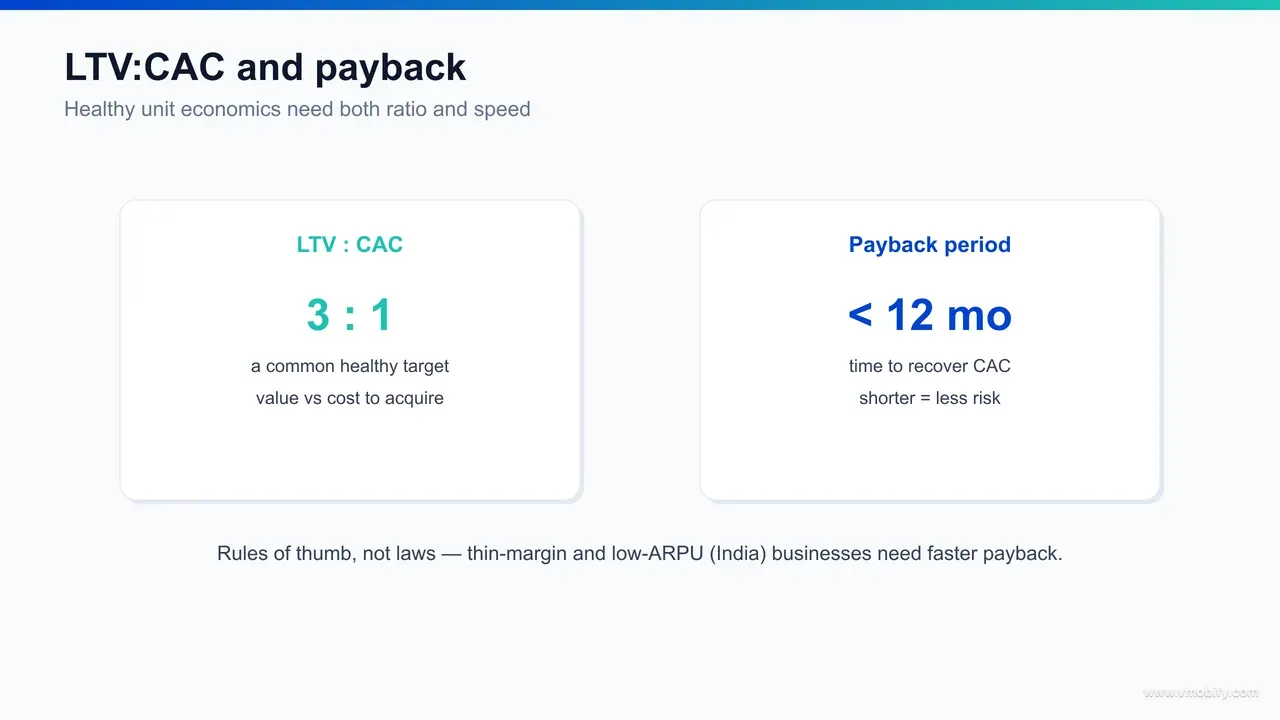
LTV:CAC compares the lifetime value of a customer to what it cost to acquire them, and the widely-cited 3:1 target is a useful rule of thumb — a default cushion for risk, overhead and forecast error — not a law of physics that every app must obey. The right ratio for your app depends on margin, churn predictability, payback speed, and how much you trust your own LTV model.
The logic behind 3:1 is sound as a starting point. If a customer is worth three times their acquisition cost, you have room to absorb the store's commission, fund the marketing team and tooling, cover the inevitable optimism baked into LTV forecasts, and still bank a margin. At 1:1 you break even on media alone and lose money once every other cost lands. Below 1:1 you lose money on every customer and scaling simply accelerates the loss. So 3:1 is shorthand for "enough headroom to survive being wrong."
But treating it as a hard gate causes real mistakes in both directions:
- It under-invests in predictable, high-retention businesses. A fintech or subscription app with low, stable churn and an 18-month observed lifetime can scale confidently at 2:1, because its LTV is far more trustworthy than a young game's extrapolated curve. Forcing it to hit 3:1 leaves profitable growth on the table.
- It over-invests in volatile ones. A hyper-casual game whose LTV depends on whether a handful of cohorts retain wants more than 3:1 of cushion, because the LTV estimate itself could be off by 50%. A 3:1 ratio built on a fragile forecast is not the safety margin it looks like.
The honest framing we give clients is that the ratio is a function of forecast confidence. The less you trust your LTV — short cohort history, high churn, speculative monetisation — the more cushion you should demand above break-even, and 3:1 (or higher) is reasonable. The more you trust it — long histories, contractual subscription revenue, stable retention curves — the closer to break-even you can responsibly run. We treat 3:1 as the default for a business we do not yet understand, and we move off it deliberately as the data earns our trust. The mechanics of computing a defensible LTV, and the category-by-category benchmark bands, are covered in full in our LTV vs CAC guide.
How do you compute payback period?
Payback period is the number of months it takes a cohort of acquired customers to generate enough cumulative net revenue to repay their CAC — and in a cash-constrained business it frequently matters more than ROAS or even LTV:CAC, because it governs how fast you can recycle money into the next cohort.
The calculation is a running total, not a single division. Take a cohort's CAC, then add up the net revenue each customer produces month by month until the cumulative figure crosses the CAC line. A worked example: suppose paid CAC is ₹600 and a customer nets ₹120 per month after store fees. Month 1 returns ₹120 (₹480 still owed), by month 3 you have recovered ₹360, and the cohort crosses ₹600 partway through month 5 — so payback is roughly five months. The same cohort might have a perfectly healthy 4:1 LTV:CAC over 24 months, but if it takes five months to get your money back, the speed at which you can reinvest is capped.
Why this dominates in practice comes down to cash velocity. Two apps can have identical LTV:CAC ratios, but the one with a 3-month payback can recycle its capital roughly four times a year while the one with a 12-month payback recycles once. For a bootstrapped or thinly-funded Indian app, the 3-month-payback business can out-grow the 12-month one even on a smaller balance sheet, simply because the same rupee does more laps. We have seen well-funded teams ignore payback and run out of cash mid-scale, and lean teams win their category because they obsessed over it.
- Under 6 months: comfortable for most app categories; you can scale aggressively without straining working capital.
- 6-12 months: workable for subscription and fintech apps with strong retention and access to capital, but it ties up cash and demands a trustworthy LTV model.
- Over 12 months: only defensible with patient capital and very predictable, contractual revenue; for everyone else it is a runway risk dressed up as a growth plan.
The discipline we enforce in our portfolio is to model payback per channel and per cohort, not just blended, because a channel with a tempting ROAS can carry a punishing payback if its revenue arrives late. Tracking the cumulative-return curve is exactly the kind of work our analytics setup is built to surface — without the per-cohort curve, payback is a guess.
What is cohort-based ROAS across D7, D30 and D90?
Cohort-based ROAS measures the cumulative revenue a single group of users — say, everyone acquired in one week — returns by day 7, day 30 and day 90 after install, expressed against the spend that acquired them; it replaces a single misleading "campaign ROAS" with a curve that shows how value accumulates over time.
The reason this matters is that revenue is back-loaded for almost every app. A campaign measured the day it ends will always look weaker than it truly is, because most of the cohort's spending, subscription renewals and ad impressions have not happened yet. D7 ROAS captures the early signal — trial starts, first purchases, opening-week engagement — while D90 ROAS captures something much closer to the cohort's eventual worth. Reading only the early number understates good cohorts; reading only the late number means waiting three months to act.
The way mature teams use the curve is to predict the late number from the early one. If your historical data shows that, for a given channel, D90 ROAS tends to land at roughly 2.5x of D7 ROAS, then a fresh cohort hitting 0.8x by D7 is on track for a 2.0x D90 — and you can make a scaling call in week one instead of waiting until month three. This D7-to-D90 multiplier is the bridge between fast feedback and accurate measurement, and it differs sharply by category: a subscription app with annual plans has a very different curve from a hyper-casual game that earns most of its lifetime value in the first fortnight.
- D7 ROAS: your fastest reliable signal for pacing and creative decisions — but only meaningful relative to your own historical D7-to-D90 ratio, never as an absolute.
- D30 ROAS: the workhorse window for most subscription and IAP apps, capturing the first renewal or repeat-purchase cycle.
- D90 ROAS: the closest practical proxy for realised value; the number to validate your scaling model against, even if you cannot wait for it before acting.
Both major measurement providers build their reporting around this cohort logic — AppsFlyer's measurement resources and Adjust's analytics documentation both centre cohort cumulative-revenue curves precisely because point-in-time ROAS is so easy to misread. In our portfolio, the single most common reporting upgrade we make for a new client is replacing "campaign ROAS" with a D7/D30/D90 cohort curve and a predicted-D90 column — it changes which campaigns get cut almost immediately.
How do SKAN and incrementality change ROAS truth?
Apple's SKAdNetwork, the loss of deterministic iOS attribution, and the reality of organic uplift all mean that platform-reported ROAS is almost always wrong — usually overstated through over-attribution — and only incrementality testing tells you the ROAS you can actually spend against. Reported ROAS and true ROAS are different numbers, and the gap is not small.
There are three structural reasons reported ROAS drifts from truth. First, Apple's SKAdNetwork framework replaced user-level iOS attribution with privacy-preserving, aggregated, delayed and partially obfuscated postbacks — so on iOS you are estimating ROAS from coarse conversion values and modelled gaps, not measuring it directly. Second, networks claim credit for conversions across generous attribution windows, so the same install can be counted by multiple channels, and last-touch logic over-credits whichever platform fired the final tracked event. Third, and most importantly, much of the revenue attributed to paid would have happened anyway — these are users who would have found you organically, so crediting their spend to a campaign overstates that campaign's true contribution.
The antidote is incrementality: measuring the lift a channel actually causes versus a holdout that did not see the ads. If you switch off a channel in a controlled geo and revenue barely moves, that channel's "ROAS" was largely organic revenue wearing a paid costume. If revenue drops sharply, the channel is genuinely incremental and you can trust its numbers. This is the difference between attributed ROAS and incremental ROAS, and for any channel spending meaningfully it is the only ROAS worth scaling against. We walk through the full methodology — geo holdouts, ghost ads, and media mix modelling — in our incrementality testing and MMM guide.
Across our portfolio the pattern is consistent: branded search, retargeting, and broad-audience channels with high organic overlap are the ones whose reported ROAS most overstates incremental ROAS, sometimes by 40-70%. Prospecting into genuinely new audiences usually holds up better under a holdout test. The practical workflow we run is to keep reported ROAS as the fast operational signal, run quarterly incrementality tests to calibrate a per-channel "discount factor," and then apply that factor to reported numbers before any budget reallocation. Without that calibration, you are allocating real money against a number the privacy architecture has already told you is an estimate.
What do India low-ARPU unit economics change?
India's defining unit-economic reality is low ARPU against globally competitive acquisition costs, which compresses margins to a sliver and makes payback period, organic share and retention the levers that decide whether an app is viable — the maths that works in a high-ARPU market often inverts here.
The structural challenge is the ratio between what an Indian user is worth and what they cost. ARPU in most Indian consumer categories is a fraction of US or European levels — rupees per month where a Western app earns dollars — yet CPMs and CPIs, while lower, are not lower by the same multiple, and they keep rising as more advertisers compete for the same attention. The result is that the LTV:CAC headroom an Indian app operates on is structurally thinner, and there is far less room for the optimism that a high-ARPU app can absorb. AppsFlyer's Performance Index repeatedly shows India among the highest-volume install markets in the world precisely because costs are low — but low cost meets low value, and the gap is the whole game.
This changes which levers matter, in a specific order:
- Payback period becomes the binding constraint. With thin margins, the time to recover CAC stretches, and cash velocity — not lifetime value — is usually what limits growth. An Indian app living or dying by how fast it recycles capital is the norm, not the exception.
- Organic and referral share carries the model. Because paid CAC is hard to make pay on its own at Indian ARPU, the apps that scale profitably lean heavily on word-of-mouth, referral loops and a strong organic engine to pull blended CAC down to something the margin can support.
- Retention does the heaviest lifting on LTV. When per-user monthly value is small, the only way to a workable LTV is many cycles — so a few points of D30 retention move the unit economics more than any CPI optimisation can.
- Monetisation mix has to match willingness to pay. Ad monetisation, low-priced subscriptions, regional pricing and UPI-friendly micro-transactions often out-earn a straight port of a Western paywall, because the pricing has to meet the market where it is.
The mistake we see most often from global teams entering India is importing a target ROAS and a CAC tolerance calibrated to dollar ARPU and concluding the market does not work. It works — but on a different model, where speed of payback and organic pull matter more than absolute LTV, and where a 1.6x ROAS run with disciplined payback and a strong organic tailwind can build a real business that a 3x-or-nothing rule would have killed. Building that model correctly for the Indian market is exactly the kind of work our UA team specialises in.
How do you allocate a UA budget by marginal ROAS?
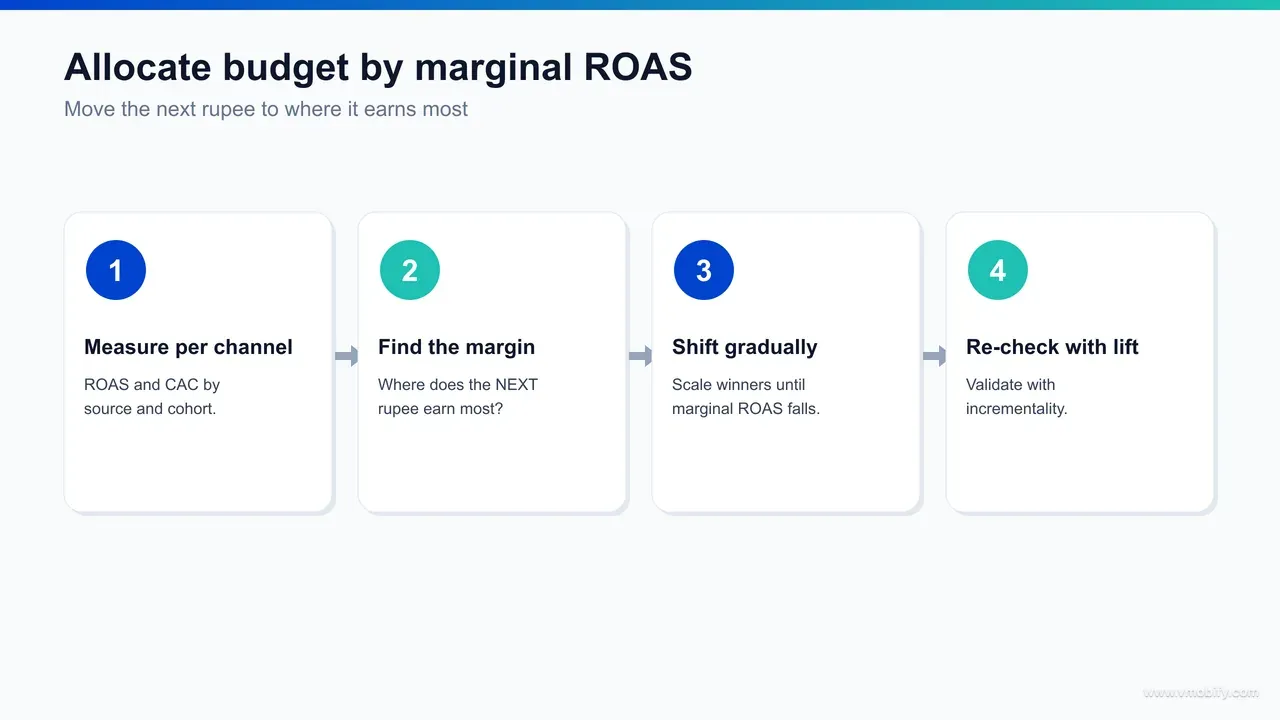
You allocate a UA budget by chasing marginal ROAS, not average ROAS: the right question is never "is this channel profitable on average" but "what does the next ₹100,000 return here versus everywhere else" — and you keep shifting spend toward the highest marginal return until every channel's next rupee earns the same, at or above your floor.
The reason average ROAS misleads is that returns diminish as you scale a channel. The first slice of budget buys the cheapest, highest-intent inventory; each additional slice reaches a slightly less responsive audience at a slightly higher cost. So a channel showing a 4x average ROAS might be returning only 1.5x on its last increment of spend — meaning the next rupee there is far less valuable than a rupee moved to a channel sitting at 2.5x average but 2.4x on the margin. Allocating on the average number systematically over-funds mature channels and starves emerging ones.
The allocation discipline, in practice:
- Measure ROAS in increments, not totals. Look at what the last ₹1-2 lakh of spend returned on each channel this week, not the channel's all-time average. The trend of marginal ROAS as spend rises is the signal.
- Equalise marginal returns across channels. Move money from wherever the next rupee earns least to wherever it earns most, repeatedly, until the marginal ROAS converges — that convergence point is the efficient allocation.
- Hold the line at your margin floor. Stop adding budget to a channel the moment its marginal ROAS drops to your break-even-plus-cushion floor, even if its average still looks healthy. The average is paying for the marginal loss.
- Calibrate with incrementality. Apply the per-channel discount factor from your holdout tests before comparing, so you are equalising incremental marginal ROAS, not attributed marginal ROAS — otherwise you will over-fund the channels that merely over-claim.
- Reserve a test budget. Ring-fence 10-20% for new channels and audiences whose marginal ROAS is unknown; today's small experiment is tomorrow's cheapest marginal inventory, and a portfolio with no exploration ossifies.
Across our portfolio, reallocating from average to marginal ROAS is one of the highest-return changes a team can make without spending a rupee more — it routinely lifts blended efficiency by reshuffling the existing budget rather than growing it. The mechanism is simple but counterintuitive: you deliberately pull money out of your best-looking channel because its next rupee is no longer its average rupee. Getting this right depends entirely on clean incremental measurement, which is why we treat analytics and incrementality as the foundation of allocation rather than an afterthought.
What are the most common ROAS and CAC mistakes?
The same handful of errors break ROAS and CAC analysis in almost every team we audit, and they share one root cause: treating a fast, convenient number as if it were the true, fully-loaded one.
- Optimising for the highest ROAS instead of the most profitable volume. A 6x ROAS on ₹2 lakh of spend usually means you are underspending; the goal is maximum contribution above the floor, not a trophy ratio. Chasing peak ROAS is chasing the wrong objective.
- Confusing blended CAC with paid CAC. Dividing paid spend across all customers — paid and organic — flatters every channel and quietly assumes free organic volume will scale with paid. It will not, and the plan breaks the moment you scale.
- Reading gross ROAS as if it were net. Ignoring the 15-30% store commission and payment fees per App Store Connect's published terms turns a loss into an apparent win. Always net the platform's cut before judging a campaign.
- Trusting attributed ROAS as incremental ROAS. Branded search and retargeting routinely over-claim revenue that would have arrived organically. Without a holdout, you are scaling a number the privacy architecture already flagged as an estimate.
- Ignoring payback period. A healthy LTV:CAC with a 14-month payback is a runway risk, not a growth plan — especially at Indian ARPU. Cash velocity, not lifetime value, is what usually caps how fast you can grow.
- Allocating on average ROAS. Funding channels by their all-time average over-feeds mature channels whose marginal rupee has already decayed and starves the emerging ones where the next rupee earns most.
- Borrowing a benchmark target ROAS. A "good ROAS is 3x" rule imported from a report calibrated to a different margin and market will overspend in one business and underspend in another. Derive your floor from your own margin, every time.
Across the 300+ apps we have worked with, at least one of these shows up in the majority of incoming reporting, and fixing the measurement frequently changes the strategy more than any new tactic could. If you want a second set of eyes on whether your ROAS, CAC and payback numbers are telling you the truth — and on how to allocate against them — that is exactly the work our team does, and you can talk to us directly to get your unit economics audited before you scale spend against them.
Frequently Asked Questions
What is a good ROAS for a mobile app?+
There is no universal good ROAS. Your break-even ROAS is 1 divided by your gross margin, so a thin-margin commerce app might need 2.5x to break even while a high-margin subscription app breaks even near 1.2x. Set your target as that floor plus a cushion, not by copying a benchmark.
What is the difference between ROAS and ROI?+
ROAS is revenue divided by ad spend and counts only media cost. ROI is profit divided by total cost and nets out store fees, creative, tooling and sometimes headcount. A 3x ROAS can be a negative ROI once all costs are subtracted.
What is the difference between blended CAC and paid CAC?+
Blended CAC divides total marketing spend by all new customers, paid and organic. Paid CAC divides paid spend by only paid-acquired customers. Use blended for board-level health and paid CAC for channel scaling decisions — they are often 2x or more apart.
Is the 3:1 LTV:CAC ratio a real rule?+
It is a rule of thumb, not a law. 3:1 is a sensible default cushion for risk and overhead, but a low-churn fintech app with a trustworthy LTV can scale at 2:1, while a volatile game with an uncertain LTV should demand more headroom.
How do you calculate payback period for an app?+
Add up a cohort's net monthly revenue until the cumulative total repays its CAC. If CAC is ₹600 and a user nets ₹120 per month, payback is about five months. Under six months is comfortable; over twelve is a runway risk.
Why is platform-reported ROAS often wrong?+
Because SKAdNetwork only gives aggregated, delayed iOS signals, networks over-claim across attribution windows, and much attributed revenue is organic that would have happened anyway. Incrementality testing against a holdout reveals the true, spendable ROAS.
How should I allocate a UA budget across channels?+
By marginal ROAS, not average. Shift spend toward wherever the next ₹100,000 returns most, stop each channel at its margin floor, calibrate with incrementality, and ring-fence 10-20% to test new channels.
Sources
- AppsFlyer — Marketing Measurement Resources — Cohort ROAS, LTV and measurement methodology guides
- Adjust — Resources and Analytics Guides — Cohort cumulative-revenue curves and ROAS measurement
- Google Ads — App Campaigns Help — Target-ROAS and target-CPA bidding mechanics for app campaigns
- AppsFlyer Performance Index — India install-volume and cost context for unit economics
- AppsFlyer State of App Marketing — Aggregated unit-economic and LTV:CAC benchmark context
- Apple — SKAdNetwork Documentation — Privacy-preserving, aggregated iOS attribution that reshapes ROAS measurement
- Apple App Store Connect — Official 15-30% store commission structure that nets gross ROAS to contribution
About the author
Amol Pomane — Founder, Vmobify
Amol leads Vmobify, a mobile app growth agency that has driven 30M+ downloads and ranked 54K+ keywords across 300+ apps since 2013. He writes about ASO, paid user acquisition, retention, and the operational reality of scaling mobile apps in India and global markets.
Free Growth Audit
See exactly how to scale your app with 13+ years of expertise behind you.
Get My Strategy

