Incrementality Testing & Media-Mix Modelling for Apps
Attribution tells you which ad got the last click — not which spend actually caused the install. This is how incrementality testing and media-mix modelling measure causal lift, why they layer on top of attribution rather than replace it, and when each is worth running.

Why does last-click attribution overstate paid channels?
Last-click attribution overstates paid channels because it hands 100% of the credit to whichever ad a user touched immediately before installing — including the large share of users who would have installed anyway, with or without that ad. Attribution answers "which ad got the last click?", which is a useful operational question, but it is not the same as "which spend actually caused the install?" — and the gap between those two questions is where most wasted budget hides.
The clearest example is retargeting and branded search. If someone has already decided to download your app — they heard about it from a friend, saw your TV spot, or searched your brand name — and they happen to tap a retargeting ad on the way to the store, last-click attribution records that as a paid install. The channel looks brilliant on a cost-per-install basis. But the install was always going to happen; the ad simply intercepted demand you had already created. The paid channel claimed credit for an organic outcome.
This is not a rounding error, and it is not symmetric: the bias runs in one direction, always flattering the channels closest to the point of conversion. Across our 300+ apps managed since 2013, the channels that look strongest in a last-click dashboard are almost always the ones most exposed to this overcounting — retargeting, brand keywords, and any audience that overlaps heavily with your existing organic demand. The further up the funnel a channel sits, the more attribution undercredits it, because its impact is separated from the install by days and several other touches. The deterministic, user-level model that powers mobile attribution is excellent for day-to-day operations, but it cannot tell you what would have happened in a world where you ran no ads at all. That counterfactual — the world without the ad — is the only thing that defines true incremental value.
Privacy changes have widened the gap further. As deterministic signal has thinned and platforms have leaned on aggregated and modelled conversions — the world Apple's SKAdNetwork ushered in — attribution has become noisier and more self-reported by the very ad networks being measured. The honest conclusion is that attribution alone cannot grade itself. You need a method that compares a world with the ad against a world without it, which is exactly what incrementality testing and media-mix modelling were built to do.
What is incrementality testing and how does it measure lift?
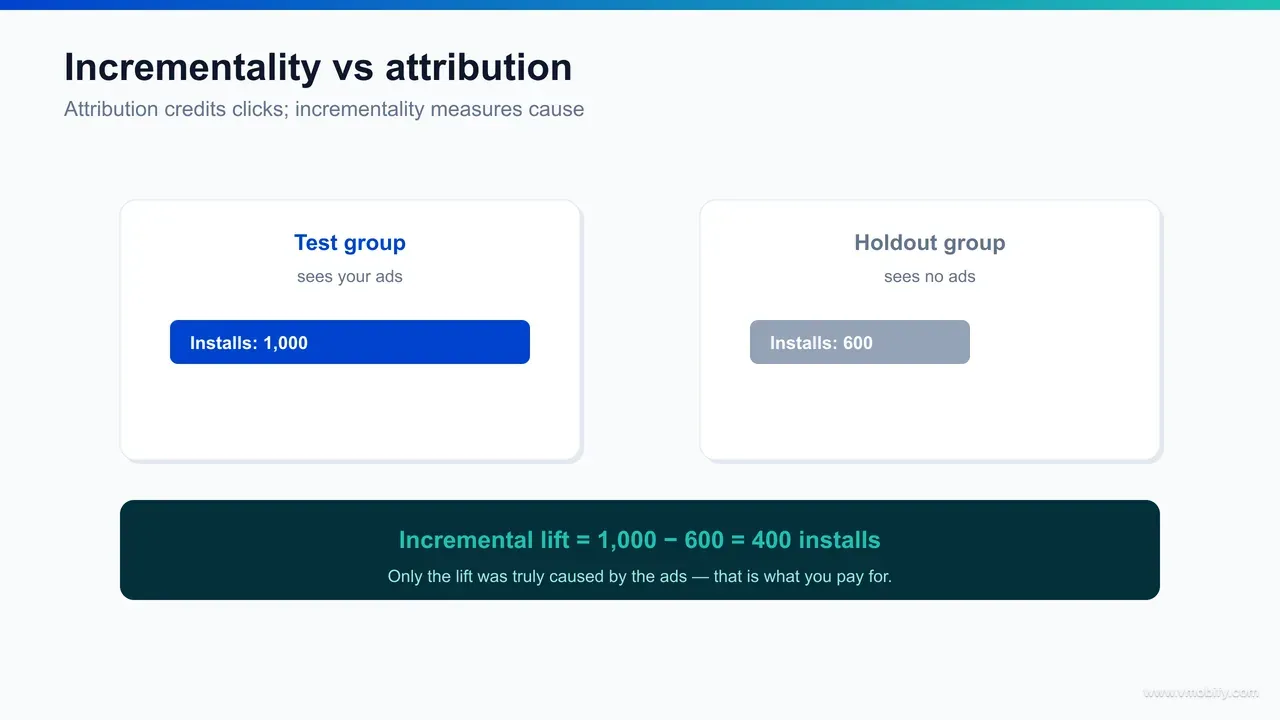
Incrementality testing measures the true causal effect of a channel by comparing a test group that is exposed to your ads against a holdout or control group that is not — the difference in outcomes between the two groups is the incremental lift your spend actually caused. It is the closest thing app marketing has to a controlled experiment, and it directly answers the counterfactual question attribution cannot.
The logic is simple: if your test group installs at 5% and a comparable control group that never saw the ad installs at 4%, then the ad caused one percentage point of incremental installs — not the full 5% the last-click report would claim. Everything above the control baseline is genuinely caused by the campaign; everything at or below it would have happened regardless. There are three designs that dominate in practice:
- Geo holdouts: you run a channel in some regions (test markets) and deliberately withhold it in comparable regions (control markets), then compare results. Geo tests are the workhorse for channels where you cannot split individual users — they need carefully matched markets and enough volume to be read cleanly.
- PSA / ghost ads: the control group is shown a neutral public-service ad (PSA) or a "ghost" placeholder instead of your real creative, so both groups are equally ad-exposed and only the message differs. This isolates the effect of your ad from the effect of simply being targeted, and platforms increasingly run it as a managed product.
- Platform conversion-lift tests: the large ad networks offer built-in lift studies that randomly split your audience into exposed and held-out cells and report the incremental conversions. They are the lowest-effort way to start — the trade-off is that the platform both runs the test and is the channel being graded.
In our portfolio, the first incrementality test on a mature account is almost always uncomfortable: a channel that looked like the hero in the attribution dashboard turns out to be carrying a large slice of organic demand, while an upper-funnel channel that attribution barely credited turns out to drive real incremental installs. Adjust and AppsFlyer both publish practical primers on running these designs — see Adjust's measurement resources and AppsFlyer's incrementality resources — and the directional signal from industry measurement surveys is that adoption of these tests is rising as marketers lose trust in last-click numbers.
How do you design a geo holdout experiment?
You design a geo holdout by splitting comparable regions into matched test and control groups, switching the channel off entirely in the control regions, and sizing both the holdout and the runtime so the experiment has enough statistical power to detect the lift you actually care about. The geo design is the workhorse for any channel where you cannot randomise individual users — connected TV, out-of-home, influencer, and increasingly the privacy-walled social platforms — because geography becomes the unit you randomise instead of the person.
It starts with market matching. The two cells have to behave alike before the test begins, so you pair regions on the metrics that genuinely drive your installs: baseline organic install rate, historical paid efficiency, seasonality, device mix, and average revenue per user. If your control markets are systematically smaller, wealthier, or seasonally out of phase with your test markets, any difference you measure afterwards is confounded and the test is dead on arrival. Mature geo methods build a synthetic control — a weighted blend of untreated regions engineered to track the test region's pre-period trend — rather than relying on a single naive city-for-city pairing.
Then comes power. Statistical power is the experiment's ability to detect a real effect when one exists, and it is governed by three things: the size of the lift you are hunting, the natural week-to-week variance in your install volume, and how much total volume sits inside the cells. A small expected lift buried in noisy daily installs needs far more volume and a longer window than a large lift in a stable baseline. The intuition we drill into clients is blunt — if a channel moves your numbers by a few percent and your installs already swing by double digits week to week, a tiny holdout will never see the signal through the noise. Size the holdout for the smallest lift worth acting on, not the lift you hope to find.
Runtime follows from the same logic. A geo test has to run long enough for the cumulative volume in each cell to clear the threshold your power calculation set, and long enough to outlast the channel's full conversion lag plus at least one cycle of the downstream event you care about. In practice that pushes most geo holdouts into a multi-week window rather than a few days, and it means resisting the urge to read the chart while it is still moving. An underpowered test cannot be rescued by staring at it harder; the only fixes are a bigger holdout, a longer window, or a larger true effect — all decisions you make at design time, not after launch.
Contamination is the geo design's signature failure mode. Spillover happens when your test-market advertising bleeds into control markets — a national connected-TV buy, a creator whose audience ignores your map, or users who simply travel across the line. When that happens the control is no longer ad-free, its baseline rises, and your measured lift collapses toward zero for entirely the wrong reason. The defence is to choose channels and geographies you can cleanly separate, leave buffer regions between cells where spillover is likely, and treat any channel with national reach as a poor candidate for a tight geo split. Across our 300+ apps managed since 2013, the geo tests that fail almost never fail on the maths — they fail on a contaminated control nobody pressure-tested before launch.
How do PSA, ghost-ad and conversion-lift tests work on Google, Meta and TikTok?
PSA, ghost-ad and platform conversion-lift tests all build an ad-free control at the user level: the platform randomly holds back a slice of your eligible audience, shows them either nothing, a neutral public-service ad, or a ghost placeholder, then compares conversions between the held-back cell and the exposed cell to report the incremental lift. They are the lowest-effort entry point into causal measurement because the network does the randomisation and the bookkeeping for you — the catch is that the network grading itself is the channel under test.
The designs differ in one important detail: what the control group sees. In a pure holdout the control is simply suppressed and shown no ad at all. In a PSA test the control sees an unrelated public-service ad, which holds advertising pressure constant so you isolate the effect of your message rather than the effect of merely being targeted. In a ghost-ad test the platform logs the users who would have seen your ad in an auction it deliberately lets a competitor win, giving a clean counterfactual without burning impressions on a charity spot. Each design answers the same question — what did my ad cause above the baseline? — and each is offered, under various names, by the large ad networks. Google, Meta and TikTok all run managed conversion-lift studies on top of their app-campaign products; Google's sits alongside App Campaigns, and Meta's lives inside its Advantage+ measurement suite.
This is also the cleanest way to see why last-click attribution flatters the self-attributing networks (SANs). A SAN both serves the ad and reports the conversion, claiming any install where its own click or view appears in the path — a model that structurally double-counts when the same user is reachable on several networks, and that overcredits view-through conversions which may never have driven anything. A conversion-lift test cuts straight through that self-report: it ignores who claimed the click and measures only whether the exposed cell converted more than the held-back cell. In our portfolio, the gap between a SAN's self-attributed installs and its lift-measured incremental installs is routinely the single most expensive number a client has never looked at.
The honest limitation is the conflict of interest. When the platform designs the test, defines the audience, runs the split and reports the result, it controls every lever that could flatter the outcome — so a lift study run entirely inside one walled garden is a useful signal, not a verdict. We treat platform lift tests as the fast first read and reserve geo holdouts, which we control end to end, for the high-stakes channels where being wrong is most expensive.
What is media-mix modelling and when does it fit?
Media-mix modelling (MMM) is a top-down statistical method that regresses your aggregate marketing spend and other factors against an aggregate outcome — installs, registrations, or revenue — to estimate how much each channel contributes, using no user-level data at all. Where attribution works bottom-up from individual touchpoints, MMM works top-down from totals: weekly spend per channel, seasonality, price changes, promotions, and external factors all become inputs to a model that apportions the result across them.
The defining advantage is privacy resilience. Because MMM consumes only aggregated figures — what you spent and what you earned, period by period — it does not depend on device identifiers, opt-in rates, or cross-app tracking. That is precisely why interest has returned to a technique that predates mobile entirely: it keeps working when the user-level signal degrades, and it captures effects attribution misses, such as the lagged, brand-building impact of upper-funnel spend that pays off weeks after the impression.
MMM has also been modernised. The classic objection — that it was a slow, quarterly, consultant-led exercise — is fading as the method moves to open-source, code-first, increasingly AI-assisted implementations that can be refreshed far more frequently than the old annual cadence. Google's open-source Meridian and its predecessor LightweightMMM are the most visible examples — Bayesian, reproducible, and designed to be run in-house — and the directional signal from industry measurement surveys is that MMM adoption is climbing as teams look for a privacy-durable budget lens. We treat this as one of the core questions our analytics team sets up for clients spending across many channels.
What MMM is not is a fast, tactical tool. It will not tell you which creative to pause this afternoon or which keyword to bid up tomorrow — its resolution is the channel and the week, not the ad and the hour. It also needs a meaningful history of spend variation to learn from: if you have always spent the same amount on every channel, the model has nothing to separate them by. That is why MMM is a scale technique, and why it complements rather than replaces the granular tools below it.
How do attribution, incrementality and MMM layer together?
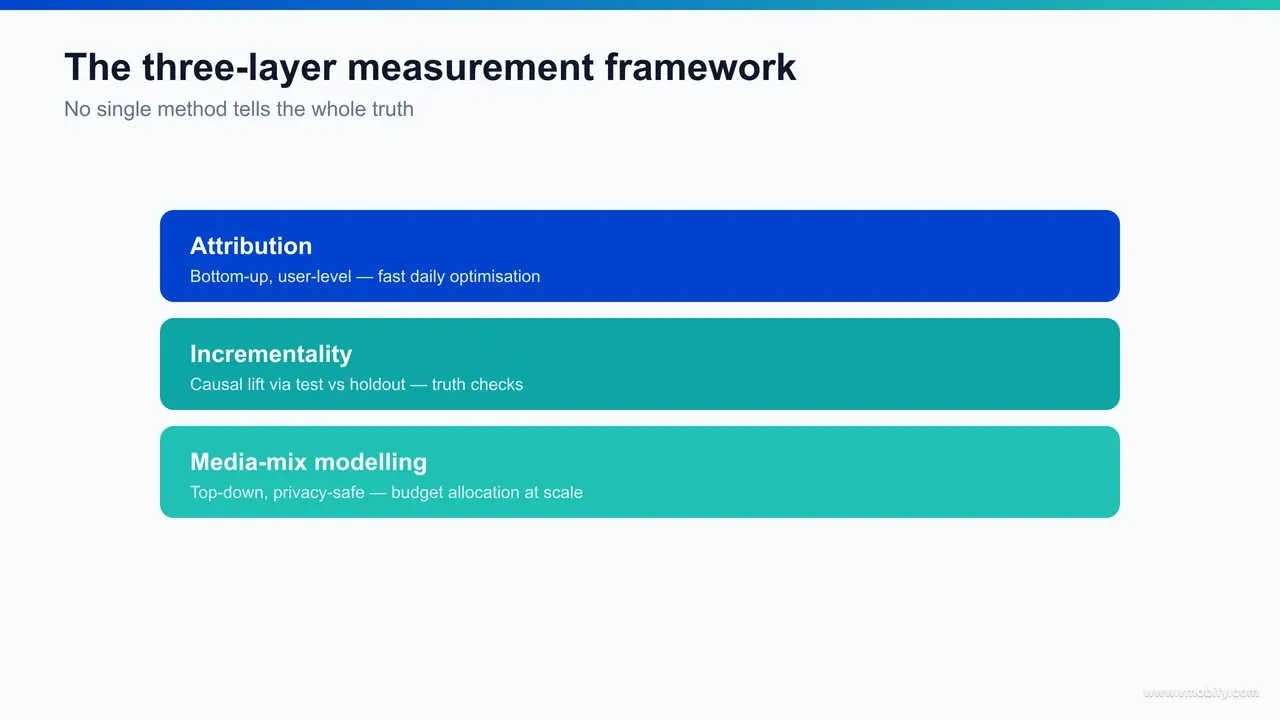
Attribution, incrementality and MMM are not competing answers to the same question — they are three layers that operate at different altitudes, and a mature measurement stack runs all three together. The mistake is treating them as a single choice; the discipline is knowing which layer answers which question and letting each correct the others.
- Attribution — the bottom-up operating layer: user-level, day-to-day, granular. It tells you which campaigns, creatives and keywords are driving recorded installs right now, so you can manage bids, pause losers and optimise creative. It is your steering wheel — fast and tactical — but it overcredits, so it must be calibrated by the layers above.
- Incrementality — the causal truth-check layer: run periodically, not continuously. It tells you how much of what attribution recorded was actually caused by the spend, by comparing against a holdout. Think of it as the calibration check that keeps your day-to-day dashboard honest — it produces "incrementality factors" you can apply to discount the channels attribution inflates.
- MMM — the top-down allocation layer: aggregate, strategic, privacy-durable. It tells you how to split a total budget across channels — including the brand and offline effects attribution never sees — and where the next rupee or dollar earns the most. It is the map, not the steering wheel.
The three reinforce each other when you triangulate. MMM gives you the strategic allocation; incrementality validates whether MMM's channel estimates hold up under a controlled test; attribution executes the plan and feeds fresh data back. When all three roughly agree on a channel, you can act with confidence. When they disagree — say attribution loves retargeting but an incrementality test shows near-zero lift — the disagreement itself is the insight, and it almost always favours the causal method. This triangulated approach is what we have seen separate teams that scale spend profitably from teams that scale a vanity dashboard.
What inputs and outputs does a media-mix model use?
A media-mix model takes aggregate time-series inputs — weekly spend and impressions per channel, plus the non-media factors that move your business — and returns three outputs: each channel's contribution to the outcome, a response curve showing its diminishing returns, and an optimal budget allocation derived from those curves. Knowing what goes in and what comes out is the difference between treating MMM as a black box and using it as a decision tool.
On the input side, a credible model needs far more than media spend. The core feed is period-by-period spend and exposure for every channel — search, social, video, offline, influencer — but the model is only as honest as the controls around it. You feed in the confounders that also move installs: price and promotion changes, seasonality and holidays, app-store featuring, PR spikes, macro factors, and a baseline that captures organic demand. Leave those out and the model hands their effect to whichever channel happens to be correlated with them, which is how a Diwali sales spike gets miscredited to the campaign that merely ran during Diwali. Two media-specific transforms matter most: adstock, which models how an impression's effect decays over the following weeks rather than vanishing the day it runs, and saturation, the curve capturing how each additional rupee buys less incremental outcome than the last.
On the output side, the response curves are the prize. A contribution figure alone — "social drove 18% of installs" — is descriptive; the response curve is prescriptive, because it tells you where you sit on each channel's diminishing-returns line and therefore where the next unit of budget earns the most. A channel can carry a large total contribution and still be saturated at the margin, meaning the next rupee belongs elsewhere. The optimiser walks those curves to propose an allocation, but it proposes within the range of spend the model has actually observed — push a channel far beyond any historical spend level and the curve out there is extrapolation, not evidence.
This is also where the build-or-buy question lands. Google's open-source Meridian and its predecessor LightweightMMM put a credible Bayesian model in reach of any team with a competent data-science function, with full control over priors and assumptions; a managed vendor trades that control for speed, support, and a maintained pipeline. We have seen in-house Meridian builds work brilliantly for teams that already have analysts who can defend the priors — and stall badly for teams that treat it as fire-and-forget software rather than a model that needs constant tending.
How do you calibrate MMM with incrementality results?
You calibrate a media-mix model by feeding it the causal lift from your incrementality experiments as a prior or a constraint, so the regression is anchored to a channel effect you measured directly rather than one it merely inferred from correlated spend. Calibration is what turns two imperfect methods into one trustworthy one: incrementality supplies a few points of hard causal truth, and MMM extends that truth across the channels and time periods you could never run an experiment on.
The need for it comes from a real weakness in MMM. A regression on observational spend data can only see correlation, and marketing spend is rarely random — you spend more on the channels and weeks you already expect to perform, which entangles cause and effect. Two channels that move together are hard for the model to tell apart, and the result can be a confident-looking contribution estimate that is simply wrong. An incrementality test does not suffer that problem, because it manufactures the randomness the observational data lacks. So you run the experiment on your biggest channels, take the measured lift, and use it to pin the model: in a Bayesian framework such as Meridian that means setting an informative prior on the channel's effect, so the model starts from your experimental result and only departs from it if the aggregate data strongly disagrees.
This is the practical heart of triangulation. When MMM and an incrementality test on the same channel roughly agree, your confidence in the whole model rises, because a method built on aggregates and a method built on a controlled split arrived at the same answer by different routes. When they disagree, the experiment usually wins — it has the cleaner causal claim — and the disagreement tells you where the model's assumptions are leaking. A sensible cadence is to re-run a small set of incrementality tests each quarter and re-calibrate the model against them, so the model never drifts far from ground truth and your analytics stack stays honest as audiences saturate and creative fatigues. The goal is not a perfect model; it is a model that is wrong in known, bounded ways and corrected on a schedule.
When is each measurement approach worth running?
Run attribution always, run incrementality on your biggest channels and budgets where a wrong call is expensive, and reach for MMM once your spend is large and spread across enough channels for a regression to find signal. Each method has a threshold below which the effort outweighs the insight, and matching the method to your stage is most of the skill.
Attribution is non-negotiable from day one — it is the operating system of user acquisition, and every app needs it to run campaigns at all. The question is only when to add the layers above it.
Incrementality earns its keep when three things are true: the channel is large enough that being wrong about it moves real money, the spend is concentrated enough that a holdout is worth the foregone installs, and you suspect overcounting — which is the default for retargeting, branded search, and any audience overlapping your organic base. A useful rule of thumb: if a channel is taking a meaningful share of your budget and you cannot confidently say what would happen if you switched it off, that channel is overdue for an incrementality test. Start with your single largest paid channel, because that is where a hidden zero-lift problem is most costly.
MMM is the last layer to add because it is the most demanding. It needs a portfolio of channels (so there is a mix to model), a history of spend that actually varied (so the model can separate effects), and enough total volume that weekly aggregates are not pure noise. For a small app running one or two channels, MMM has nothing to chew on — incrementality and attribution are sufficient, and cheaper. A practical sequence we have seen work is to add incrementality once a single channel passes a meaningful share of spend, then layer MMM in only when the channel count and budget have both grown enough to justify it. Once you are spending across search, social, video, offline and influencer at scale, MMM becomes the only tool that can see the whole board, including the brand effects the others miss.
How do you run a basic incrementality test?
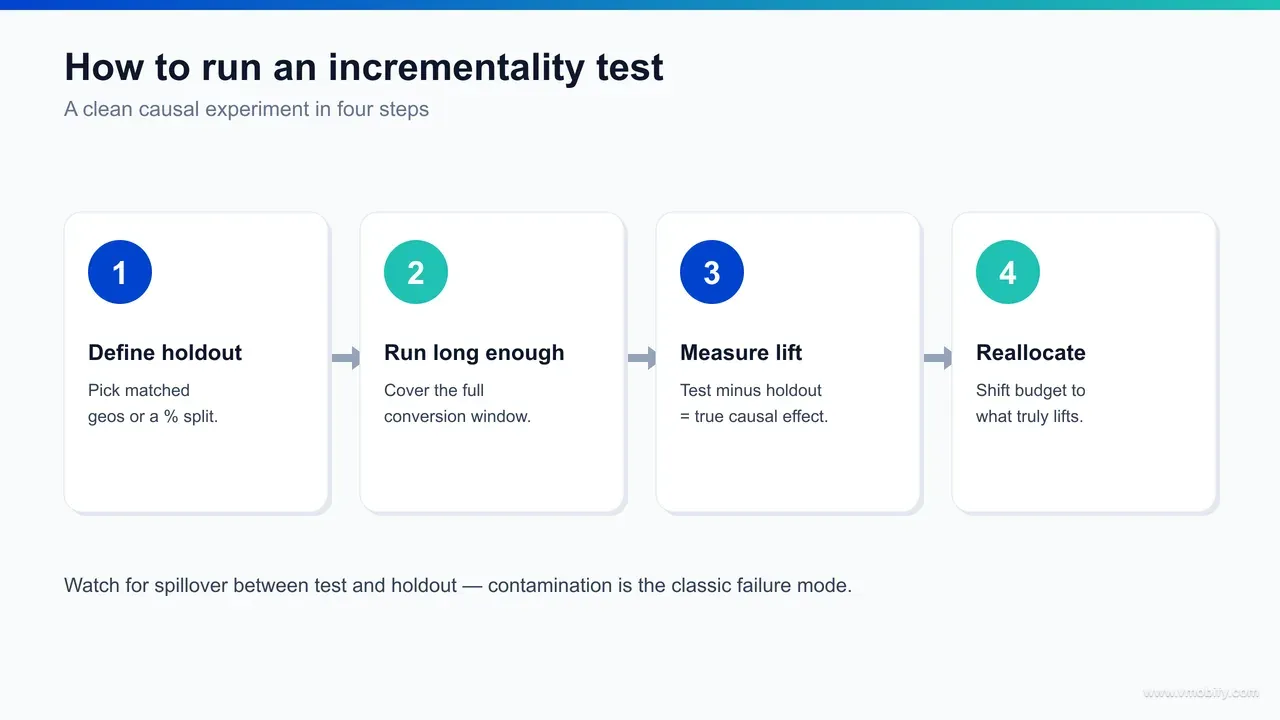
A basic incrementality test is four disciplined moves: define a clean holdout, run it long enough to clear your conversion window, measure the lift against the control baseline, and reallocate budget on what you learn. The mechanics are not hard; the discipline is in resisting the urge to peek early or contaminate the control group.
- Define the holdout. Decide the unit of randomisation — individual users (via a platform conversion-lift test) or geographies (via matched test and control markets). The two groups must be genuinely comparable before the test starts; if your control markets are systematically smaller or wealthier, the result is meaningless. Pick a holdout large enough to detect a realistic lift but small enough that the foregone installs are affordable.
- Run it long enough. The test has to outlast your full conversion window — including the lag between impression and install, and ideally one cycle of the downstream event you care about (registration, first purchase). Cutting a test short is the most common way teams fool themselves: early reads are dominated by the users who would have converted fastest anyway. Hold the line and do not change targeting or budget mid-flight.
- Measure the lift. Compare the test group's outcome against the control baseline and express the difference as incremental conversions and incremental cost per action. The output you want is an "incrementality factor" — the share of attributed conversions that were genuinely caused — which you then apply to discount that channel's reported numbers going forward.
- Act on it. Reallocate budget toward the channels with the highest true lift and away from those carrying organic demand, then re-run periodically because lift decays as you saturate an audience. A test is only valuable if it changes a decision.
Tie every result back to unit economics, because lift only matters in the context of what a user is worth. A channel with modest incremental volume but excellent retained value can beat a high-volume channel of zero-lift installs — which is why we run incrementality findings straight through an LTV/CAC model before reallocating a rupee. Incremental CAC, not reported CAC, is the number that should drive the budget.
What do teams get wrong about incrementality and MMM?
The biggest mistakes are treating these methods as a replacement for attribution rather than a calibration on it, reading tests before they are statistically ripe, and measuring lift in a vacuum instead of against unit economics. Getting the methods right matters less than getting the decisions they feed right.
- Throwing out attribution entirely. Some teams discover overcounting, lose faith in their MMP, and try to run on incrementality or MMM alone. Neither can manage a campaign day-to-day — you still need attribution to pull the levers. The fix is calibration, not replacement: use the causal layers to discount what attribution inflates.
- Peeking and stopping early. An incrementality test read before it clears the conversion window reports the fast converters first and overstates lift. Pre-commit to a runtime and a sample size, and do not touch the test until it ends.
- Contaminating the control. If your control group is reachable by other campaigns — a retargeting list, an email blast, an organic push — the "no ad" world is no longer ad-free and the lift collapses toward zero for the wrong reason. Suppress the channel cleanly across the whole control.
- Expecting MMM to be tactical. Teams stand up an MMM and then ask it which creative to pause. It cannot answer; its resolution is the channel and the week. Hold it to strategic allocation and let attribution handle the tactics.
The throughline across all of these is that measurement only earns its cost when it changes a decision and that decision improves unit economics. A perfectly executed incrementality test that nobody acts on is wasted spend; a rough one that moves budget from a zero-lift channel to a real one pays for itself many times over. In our portfolio, the teams that win are the ones that wire causal measurement directly into budget meetings — every channel's reported numbers carry an incrementality discount, and every reallocation is judged on incremental CAC against retained value, not on the flattering last-click figure. If you want help standing that measurement stack up, talk to us about your channel mix.
Frequently Asked Questions
What is the difference between attribution and incrementality?+
Attribution records which ad a user touched before converting and credits it bottom-up at the user level. Incrementality measures how many of those conversions the ad actually caused by comparing an exposed group against a held-out control group. Attribution tells you the last click; incrementality tells you the true causal lift.
What is media-mix modelling (MMM) in simple terms?+
MMM is a top-down statistical model that regresses your aggregate marketing spend and other factors against an aggregate outcome like installs or revenue, then estimates how much each channel contributed. It uses no user-level data, so it keeps working under privacy restrictions, and it captures brand and offline effects that user-level attribution misses.
Does incrementality testing replace my attribution provider?+
No. Attribution remains your day-to-day operating layer for managing bids, creatives and keywords. Incrementality is a periodic calibration that tells you how much to discount what attribution reports. You run both together, with incrementality keeping the attribution dashboard honest.
How long should an incrementality test run?+
Long enough to outlast your full conversion window plus, ideally, one cycle of the downstream event you care about, such as a first purchase. Reading the test early biases it toward fast converters and overstates lift. Pre-commit to a runtime and sample size and do not change anything mid-flight.
When is media-mix modelling worth it for an app?+
MMM earns its keep once you spend at scale across several channels with a history of varied spend for the model to learn from. A small app running one or two channels has too little for a regression to separate; for it, attribution plus incrementality is enough. MMM becomes essential when you need to allocate a large budget across search, social, video and offline together.
What is a geo holdout test?+
A geo holdout runs a channel in some regions (test markets) while deliberately withholding it in comparable regions (control markets), then compares outcomes. It is the standard incrementality design for channels where you cannot split individual users, and it depends on carefully matched markets and enough volume to read the difference cleanly.
Why does last-click attribution overstate paid channels?+
Because it gives full credit to the final ad touch even when the user would have installed anyway. Retargeting and branded search are the worst offenders: they intercept demand you already created and book it as paid, inflating those channels and hiding the true contribution of upper-funnel spend.
Sources
- Adjust — Measurement & incrementality resources — Practical primers on incrementality test designs and lift measurement
- AppsFlyer — Incrementality resources — Guides on conversion-lift and holdout testing for mobile
- Google — Meridian (open-source MMM) — Bayesian, code-first media-mix modelling built to run in-house
- Google — Meridian on GitHub — Source and documentation for the modern MMM framework
- Google — LightweightMMM on GitHub — Meridian's open-source predecessor for lightweight Bayesian MMM
- Apple — SKAdNetwork (developer docs) — Privacy-preserving, aggregated attribution context behind the measurement shift
- Google Ads — App Campaigns Help — Platform context for app-campaign conversion-lift measurement
- Meta — Advantage+ App Campaigns — Self-attributing-network app product behind Meta conversion-lift studies
About the author
Amol Pomane — Founder, Vmobify
Amol leads Vmobify, a mobile app growth agency that has driven 30M+ downloads and ranked 54K+ keywords across 300+ apps since 2013. He writes about ASO, paid user acquisition, retention, and the operational reality of scaling mobile apps in India and global markets.
Free Growth Audit
See exactly how to scale your app with 13+ years of expertise behind you.
Get My Strategy

