Why Is My CPI Going Up? A 7-Cause Diagnostic
Your cost per install has drifted upward for three weeks and the campaign settings have not changed. That combination has a small number of documented causes, and most teams check them in the wrong order — starting with bids, which is the one lever most likely to make the problem worse. This is the fault tree we work through instead.
On this page
- Which CPI actually went up?
- Did you restart the learning period?
- Have you run out of audience?
- Is your creative fatigued?
- Did the auction get more expensive around you?
- Is this seasonality rather than a problem?
- Are your own campaigns bidding against each other?
- Did your quality signals get worse?
- What order should you check these in?
- Frequently Asked Questions
Which CPI actually went up?
Before you diagnose anything, establish which of the three numbers called CPI has moved, because they fail for entirely different reasons. A large share of the CPI emergencies we are pulled into are arithmetic problems in the reporting layer rather than auction problems in the buying layer.
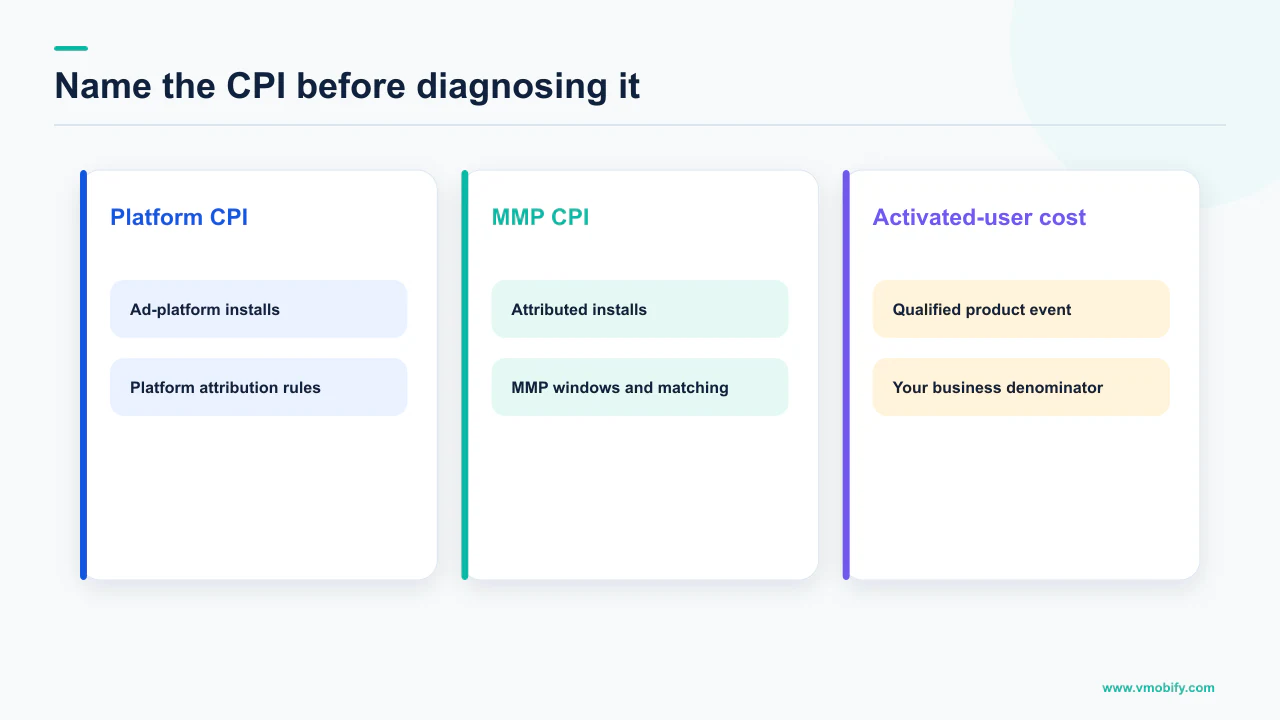
The three numbers are:
Network-reported CPI
- Spend divided by installs the ad network claims
- What the platform dashboard shows
- Moves when the auction moves
- This is the auction signal
MMP-attributed CPI
- Spend divided by installs your MMP attributes to that source
- Moves when attribution logic, SDK versions or consent rates change
- Can rise while the auction is flat
- This is a measurement signal
The third is blended CPI — total UA spend divided by total installs, organic included. It rises whenever your paid mix shifts toward a more expensive channel or organic installs fall, even if every campaign is buying at exactly last month's price.
So the first question is not why CPI rose. It is whether network-reported CPI rose on any individual campaign. If it did not, and only the blended or attributed figures moved, stop reading this fault tree and start on the measurement one — our guide to mobile attribution and the piece on install discrepancies between platform and MMP cover that path.
Across the 300+ apps we have managed since 2013, the commonest cause of a reported CPI increase with no campaign change behind it is a change in what is being counted, not what is being paid. Establish the denominator before you touch a bid.
Did you restart the learning period?
If your CPI rose within days of an edit, the most likely explanation is that the edit put your bid strategy back into learning — and Google states this can take up to 3 weeks or 1–2 conversion cycles to settle. This is the cause that most often gets misdiagnosed as a market change, because the person who made the edit rarely connects it to a cost rise a week later.
Google's documentation on the duration of the learning period is specific about both the timeframe and the triggers. It states that it can take up to 3 weeks or 1–2 conversion cycles for the bid strategy to calibrate to the new objective, although it can be faster depending on the amount of conversion data present. Duration is affected by the number of conversions obtained, the length of your conversion cycle, and which bid strategy you use.
The triggers are broader than most buyers assume — a new or reactivated strategy, a change to bid strategy settings, and campaigns or ad groups added to or removed from the strategy. Google notes that its algorithms continue learning even after the bidding status stops showing Learning, so the label leaving the screen is not the same event as the system being finished.
CPI rises, someone cuts the target CPI to compensate, and the cut is itself a bid strategy setting change that restarts learning. Cost rises again, the target is cut again, and the campaign never leaves calibration. We see this loop more often than any other single mistake in app buying.
Google's own guidance on maximising an App campaign sets a size limit on edits worth adopting as a rule: try not to make drastic changes to your campaign, for example, changing the budget by more than 20%, or changing your CPI by more than 20%. It also notes that App campaigns can take a few days to start gathering information.
The behaviour is not unique to Google. TikTok's learning phase documentation states that campaign performance may fluctuate as the system explores and adapts to the campaign settings, and that volatility typically starts to decline after about 25 campaign results or 7 days from when the campaign enters the learning phase. It lists pausing campaigns and ad groups, and edits that retrigger the learning phase status, among the operations to avoid.
Practically: pull the change history for the affected campaign and line the edits against the cost curve. If an edit precedes the rise, you have a candidate, and the correct response is to stop editing rather than to edit more.
Have you run out of audience?
If cost rises steadily as spend rises, with no edit behind it, you are probably buying deeper into a finite audience — and depth costs more by construction. This is the least dramatic cause and the most common one on scaling campaigns.
The mechanism is not mysterious. Auction-based systems buy the cheapest qualifying impressions first. When your budget grows, the system must reach people it previously did not need to reach, and those impressions cost more because it is less confident they will convert. Google describes Smart Bidding as optimising for conversions in every auction using auction-time signals; once the highest-probability inventory is exhausted, what remains is lower-probability inventory at a higher effective price.
No platform publishes a saturation curve for your app, and we will not invent one. There is no honest number for "your audience is 40% exhausted" — that figure does not exist in any documentation we can cite, and anyone quoting one is guessing. What you can observe are the directional symptoms:
- CPI rises roughly in step with daily budget increases, and falls again when you pull budget back.
- Frequency climbs where the platform reports it, meaning the same people are seeing you more often.
- Install volume flattens while spend keeps climbing — the classic shape of a channel at its ceiling.
- Post-install quality falls, because the marginal user is a worse fit than the average user you started with.
That last point matters more than the CPI itself. A rising CPI on a scaling campaign is a problem only if the incremental install is no longer worth what you paid — a payback question, answered with the framework in our ROAS and CAC guide and the cash-flow view in UA budget and cash payback.
If you are genuinely at the ceiling of an audience, no bid change fixes it. The fixes are new geographies, new channels, or a broader targeting definition — all of which reset your learning period, which is why this diagnosis needs to be right before you act on it.
Is your creative fatigued?
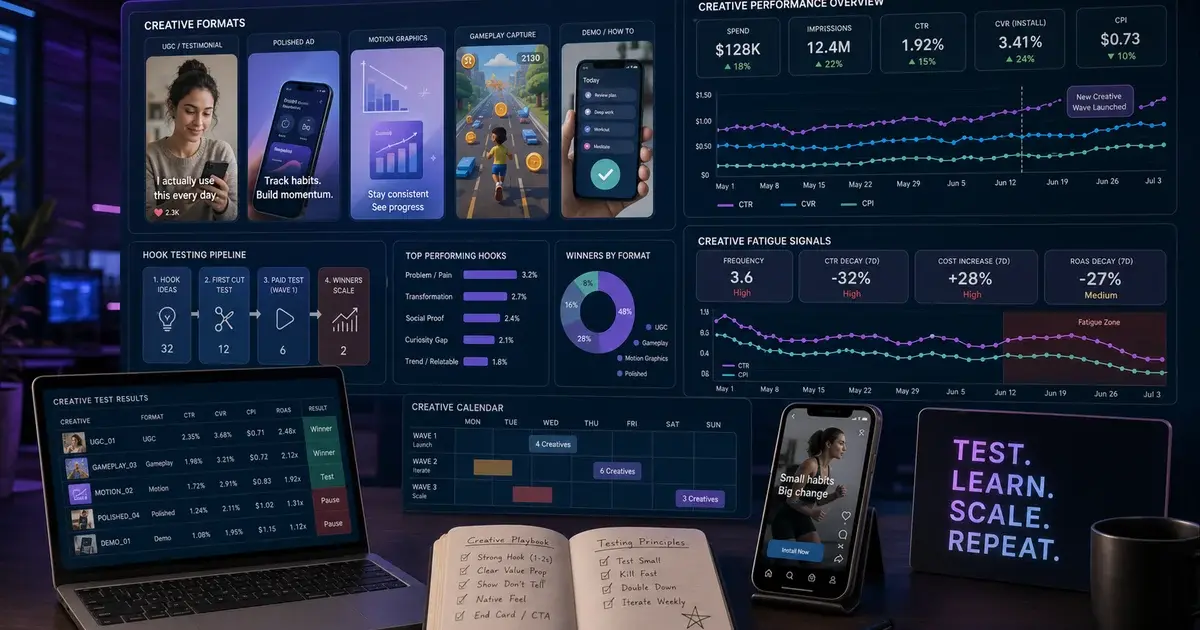
If your click-through and install rates fell while impression volume held steady, the auction did not get more expensive — your creative got less persuasive, and the platform is paying more to compensate. Creative fatigue shows up as a CPI problem long after it started as a conversion-rate problem.
Watch the ratios rather than the cost. Cost per install is the product of what you pay for attention and how efficiently that attention converts. If cost per click or per thousand impressions is flat but CPI is up, the loss is in conversion, and creative is the first place to look. If impression cost is up too, the cause is an auction one, covered next.
Google's best practice guide for setting up App campaigns treats asset supply as a performance input rather than a housekeeping task. It advises providing a diverse mix of text and high-quality video and image assets so that campaigns can dynamically generate creative optimised for reach and performance across different channels, notes that you can include up to 10 text, 20 image and 20 video assets per ad group, and recommends using all the asset slots available. On maintenance it is explicit: regularly monitor your asset performance based on the ratings in your asset report and replace low-performing assets with new ones.
Its tips article carries a similar target — ideally 20 images and 20 videos with a variety of aspect ratios and sizes, along with four separate lines of text.
Open the campaign and count the assets. In our portfolio, most campaigns with a slow CPI drift are running a fraction of the available asset slots, and half of what is there has never been refreshed since launch. That is not a bidding problem with a bidding fix.
There is no published number for how long a creative lasts, and any benchmark you have been quoted is somebody's average rather than your app's. What is publishable is the method: replace on evidence from the asset report, add before you remove so the campaign is never starved, and keep the replacement rate steady. Our creative strategy guide covers building a pipeline that sustains it.
Did the auction get more expensive around you?
Your cost can rise with nothing changed on your side, because the auction is re-run for every impression against whoever else is bidding at that moment. This is the cause you cannot fix, only respond to — which makes it important to confirm rather than assume.
Google's description of how the ad auction works states that the auction process repeats for every search on Google, each time with potentially different results depending on the competition at that moment and which ad you use. Ads are ordered based on Ad Rank, which it defines as a combination of bid amount, the quality of your ads and landing page, the Ad Rank thresholds, the competitiveness of an auction, the context of the person's search, and the expected impact of assets and other ad formats.
Read that list again with your cost problem in mind. Only one of the six inputs is your bid. Two — auction competitiveness and the Ad Rank thresholds — are set outside your account entirely. A well-funded competitor launching in your category changes your cost without changing anything you control.
The signature of a genuine competitive shift is specific, and it is worth checking against before accepting the explanation:
- Impression cost rises, not just install cost. If CPM or CPC is flat, competition is not your cause.
- The rise is broad, not campaign-specific. Competitive pressure lands across your campaigns in that geography and category, not on one ad group.
- Your conversion rates held. Same creative performance, higher entry price.
- Impression share or volume fell at a constant bid. You are being outbid rather than under-converting.
If all four hold, your cost floor moved. The response is commercial rather than technical: decide whether the new price still clears your payback threshold, and if it does not, shift budget to a channel or market where it does. Cutting your bid to chase the old number buys fewer installs at a price the market no longer offers — and restarts your learning period on the way. Where a campaign stops spending altogether, the diagnosis is different; see why an App campaign stops spending.
Is this seasonality rather than a problem?
Some CPI increases are calendar effects that will reverse on their own, and the worst thing you can do to them is optimise. The test is whether the same period last year shows the same shape.
Two distinct things get called seasonality. The demand-side version: your category converts worse in this window, so the same impressions produce fewer installs. The supply-side version: other advertisers are bidding harder because it is their peak, so impressions cost more even though your conversion rate is unchanged. Splitting them takes one look at whether CPM moved.
Google gives Smart Bidding an explicit tool for the demand-side case. Its documentation on creating a seasonality adjustment describes them as an advanced tool that can be used to inform Smart Bidding of expected changes in conversion rates for future events like promotions or sales. The constraints matter as much as the feature: seasonal adjustments are ideal for short events of 1–7 days, and Google warns they may not work as well if you use them for extended periods of more than 14 days at a time. Google also notes that Smart Bidding already accounts for seasonal events, so the adjustment is for major anticipated changes rather than routine variation.
That documented ceiling is the useful part. If your CPI rise has run for six weeks, a seasonality adjustment is the wrong instrument by Google's own description of it, and the increase is not the kind of short event the tool exists for.
The prerequisite for using seasonality as an explanation at all is a year-on-year view of your own cost curve; without one you are pattern-matching against intuition. Build the comparison before the season, not during it — and if you buy in India, the calendar that moves cost there is not the one that moves it in Western markets, as we cover in what app installs actually cost in India. Where the same rise appears in the same weeks across multiple years, plan budget around it rather than fighting it inside the campaign.
Are your own campaigns bidding against each other?
If you launched a second campaign and your first one got more expensive, you may have split one audience across two buyers and paid for the privilege. Overlap is a structural cause, so it produces a step change at launch rather than a drift.
The symptom is easy to confirm. Total installs stay roughly flat while spend rises; the older campaign's volume falls by about as much as the new one gains; and both now sit at a higher CPI than the original did alone. Nothing about the market changed. You reorganised your own demand.
The mechanism has two parts. Splitting a fixed audience halves the conversion data available to each campaign, and Google's guidance on Smart Bidding is that you should measure performance over longer time periods with at least 30 conversions, such as a month or longer — 50 conversions for Target ROAS. Two campaigns each below that threshold optimise worse than one campaign above it. And a new campaign is a new strategy, which as established puts you back in the learning period.
Google's App campaign best practices do describe legitimate structural splits — for example running one campaign targeting all users for install volume alongside a separate campaign focused on users likely to perform an in-app action, with different CPI targets. The distinction that makes a split legitimate is that the two campaigns are buying genuinely different outcomes at genuinely different prices, not the same outcome twice.
If you cannot name the different objective, the different target price and the different creative set, the split is duplication. Consolidating two overlapping campaigns back into one is one of the few CPI interventions that reliably works — but it triggers a learning period of its own, so commit to it and leave it alone for the full calibration window.
Overlap between separate networks is harder to see, since neither dashboard knows about the other. The tell is the same at portfolio level: adding a channel raised total spend without raising total installs. That is an incrementality question — our guide to incrementality testing and MMM for apps sets out how to answer it.
Did your quality signals get worse?
Your bid is only one of the inputs to what you pay, and the ones you influence through product and store quality move your price without ever appearing in your campaign settings. This cause has the longest lag and is therefore the one nobody suspects.
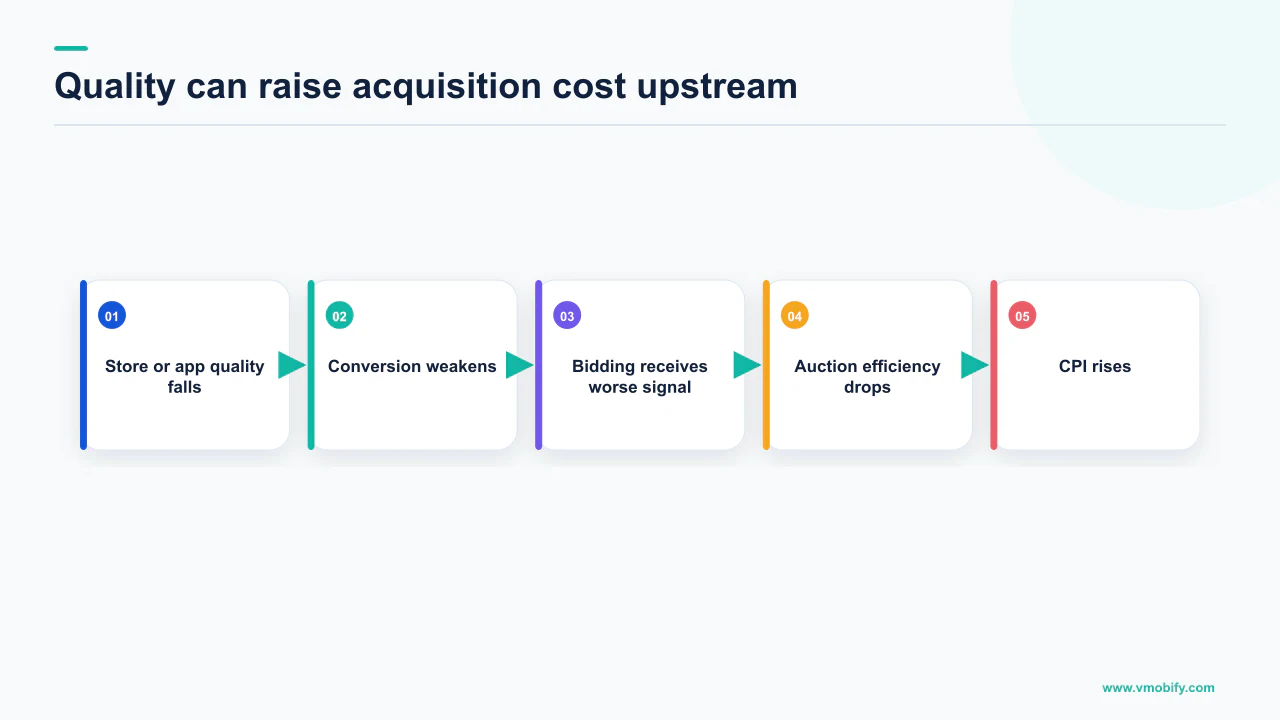
Google states in its Ad Rank documentation that Ad Rank is calculated every time a user does a search and is recalculated for different positions on the results page, that it is based on your bid, ad and landing page quality, Ad Rank thresholds, auction competitiveness, search context and expected asset impact — and, crucially, that higher quality ads can often lead to lower CPCs, meaning you pay less per click when your ads are higher quality. Quality is a price input, in both directions.
For an app, the destination that gets judged is your store listing, and everything on it is in play:
- Your rating. A listing that converts worse turns the same paid traffic into fewer installs, which is a CPI rise even at a constant cost per click. If your stars moved recently, start at why an app rating drops.
- Your screenshots and store copy. Store conversion rate multiplies every paid visitor you send. It is usually the cheapest lever on this whole list.
- Technical quality. Crashes, ANRs and slow starts degrade the post-install outcomes the bidding system optimises toward, and the cost shows up in acquisition. We set that argument out in the tax bad vitals levy on acquisition.
- Conversion signal integrity. If your conversion events broke, were renamed, or started arriving late, the bidding system is optimising against a distorted picture. Check event volume before assuming the auction changed.
That last point masquerades as every other cause on this list. A conversion tracking regression produces rising reported CPI, falling attributed volume, and an optimisation system quietly making worse decisions on bad data. Confirm your events are still firing at normal volume before accepting any other diagnosis — our work on why analytics numbers look wrong covers the usual culprits.
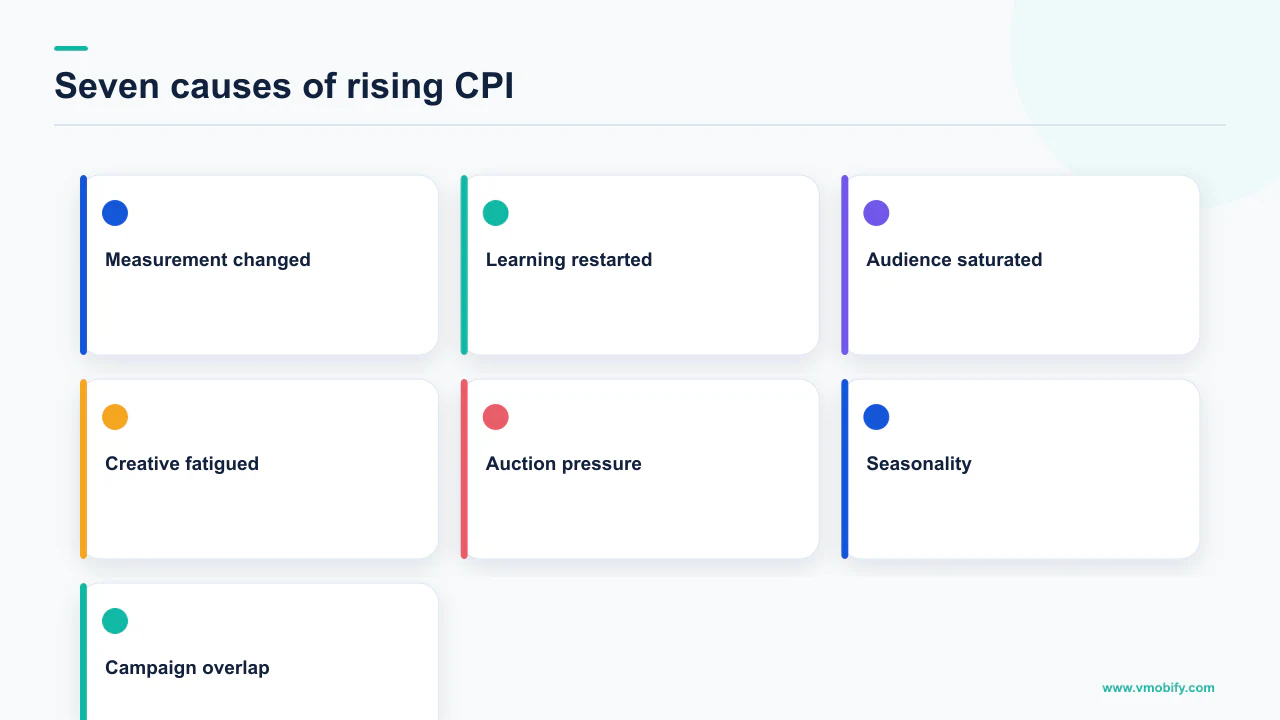
What order should you check these in?
Cheapest and most reversible first, structural last — and do not change your bid until you have ruled out the causes a bid change cannot fix. The order matters more than the list, because several of these interventions restart your learning period and therefore cannot be run concurrently.
- Confirm the number. Is network-reported CPI up on an individual campaign, or has only blended or attributed CPI moved? Fix the measurement question first.
- Check conversion event volume. A tracking regression looks exactly like every other cause and invalidates the rest of the investigation.
- Read the change history. Any edit in the preceding three weeks is a learning-period candidate. If one exists, stop and wait out the calibration window.
- Split the ratio. Did impression cost rise, or did conversion rate fall? This one comparison separates auction causes from creative and listing causes.
- Count the assets. If conversion fell and your asset slots are half empty or stale, you have found it.
- Compare year on year. Same weeks, previous years. Seasonality is a plan, not a fix.
- Review structure. Overlapping campaigns and duplicated audiences get consolidated, then left alone for a full learning period.
Two disciplines separate a diagnosis from a guess. Change one thing at a time, because concurrent changes to a system with a three-week calibration window produce results nobody can attribute. And give each change the full learning period before judging it — an uncomfortable instruction when cost is rising, and correct anyway.
There is no publishable benchmark CPI for your category, geography and app. Every figure circulating in that shape is a blend of undisclosed samples across incompatible attribution setups, and quoting one would give you a target that has nothing to do with your economics. The number that matters is your own payback period, and it is the only one worth optimising against.
A rising CPI is only a problem in relation to what an install is worth to you. If payback still clears, a higher CPI at higher volume is often the better business; if it does not, no amount of campaign tuning rescues it. If you have worked this tree and cannot place your increase, tell us what the ratios did — the split between impression cost and conversion rate usually settles it in one look. Our user acquisition work starts at the same place.
Frequently Asked Questions
My CPI rose but I did not change anything. What happened?+
Start by checking which CPI moved. If only blended or MMP-attributed CPI rose, the cause is usually a change in channel mix, organic volume or attribution rather than the auction. If network-reported CPI on a single campaign rose, work through learning period, audience depth, creative fatigue, auction competition, seasonality, campaign overlap and quality signals in that order.
How long does the learning period actually last?+
Google states that it can take up to 3 weeks or 1-2 conversion cycles for the bid strategy to calibrate to a new objective, although it can be faster depending on how much conversion data is present. Duration depends on your conversion volume, the length of your conversion cycle and which bid strategy you use. TikTok says volatility typically starts to decline after about 25 campaign results or 7 days.
Will lowering my target CPI bring costs back down?+
Usually not, and it can make things worse. A change to bid strategy settings is one of the triggers Google lists for the learning status, so the cut restarts calibration. Google also advises against drastic changes such as altering budget or CPI by more than 20%. If the auction price genuinely moved, a lower target buys less volume rather than cheaper installs.
How do I tell creative fatigue apart from rising competition?+
Compare impression cost with conversion rate. If cost per click or per thousand impressions is flat while CPI is up, you are losing conversion and creative is the likely cause. If impression cost is also up while your conversion rates held, the auction around you got more expensive. The two need completely different responses.
What is a normal CPI for my category?+
We do not publish one, because no honest source exists. Public CPI benchmarks blend undisclosed samples across different geographies, attribution windows and campaign objectives, so any figure you match yourself against is measuring something other than your app. Judge your CPI against your own payback period instead.
Does adding a second campaign make my first one more expensive?+
It can, if both are buying the same audience for the same outcome. Splitting one audience halves the conversion data each campaign has to optimise on, and Google recommends measuring Smart Bidding over periods with at least 30 conversions, or 50 for Target ROAS. A split is only justified when the objective, target price and creative set genuinely differ.
Can I use a seasonality adjustment to handle a long-running increase?+
No. Google describes seasonality adjustments as ideal for short events of 1-7 days and warns they may not work as well when used for more than 14 days at a time. A cost increase that has run for a month or more is not the kind of event the tool was built for, so the answer is budget planning rather than a bidding adjustment.
Sources
- Google Ads Help — Duration of the learning period for campaigns and what affects it — States up to 3 weeks or 1-2 conversion cycles to calibrate, the factors affecting duration, and the changes that trigger learning status.
- Google Ads Help — Tips for maximizing your App campaign — Advises against changing budget or CPI by more than 20%, and notes App campaigns take a few days to start gathering information.
- Google Ads Help — About the Google Ads auction — The auction repeats for every search with results depending on the competition at that moment; lists the six Ad Rank inputs.
- Google Ads Help — About Ad Rank — Ad Rank is recalculated for every search, and higher quality ads can often lead to lower CPCs.
- Google Ads Help — About Smart Bidding — Auction-time bidding and the recommendation to measure over periods with at least 30 conversions, or 50 for Target ROAS.
- Google Ads Help — Create a seasonality adjustment — Adjustments are ideal for short events of 1-7 days and may not work as well beyond 14 days at a time.
- Google Ads Help — Best practices guide: Setting up your App campaigns — Asset slot limits per ad group, the advice to use all available slots, and to replace low-performing assets using the asset report.
- TikTok Ads Manager Help — About Learning Phase — Volatility typically declines after about 25 campaign results or 7 days; lists pausing and retriggering edits as operations to avoid.
About the author
Amol Pomane — Founder, Vmobify
Amol leads Vmobify, a mobile app growth agency that has driven 30M+ downloads and ranked 54K+ keywords across 300+ apps since 2013. He writes about ASO, paid user acquisition, retention, and the operational reality of scaling mobile apps in India and global markets.
Model an install budget
Turn CPI and activation assumptions into acquisition scenarios.
Open free tool