Why Your Firebase Numbers Look Wrong
Firebase says one install count, your MMP says another, and Play Console says a third. Your event has vanished into a row marked "(other)". Nothing is broken. Firebase is a batched, aggregated reporting system and you are reading it like a database — this is what it is actually doing, and which of the three numbers belongs in a board pack.
On this page
- What mental model should you have of Firebase reporting?
- Why are my events not showing up yet?
- What is the two-month retention setting quietly costing you?
- What is the "(other)" row, and which parameter caused it?
- Why do Firebase, your MMP and Play Console never agree?
- Which of the three numbers should you report to a board?
- When can the console genuinely not answer your question?
- How do you audit an analytics setup you inherited?
- Which mistakes are hardest to undo later?
- Frequently Asked Questions
What mental model should you have of Firebase reporting?
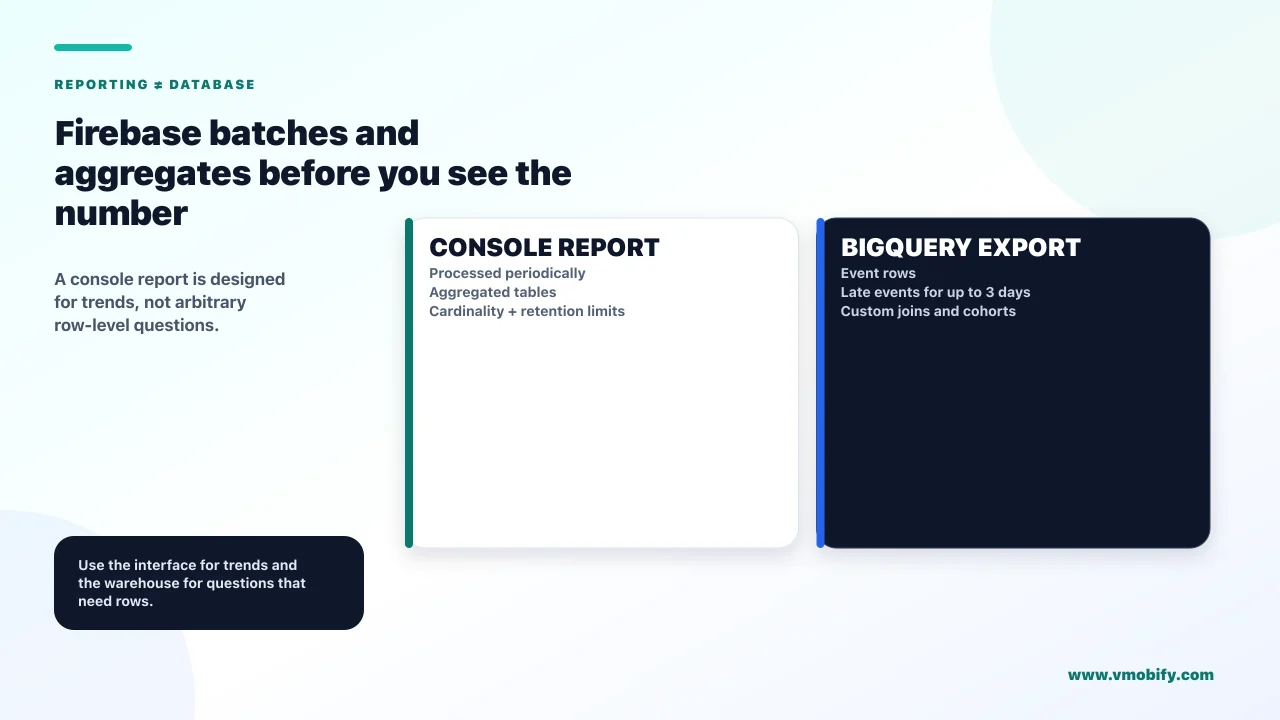
Firebase Analytics is a batched, aggregated reporting system, not a queryable database — and almost every complaint that "the numbers are wrong" dissolves once you hold that distinction. Events are collected on the device, sent in batches, processed on a schedule, and then presented through reports that have row limits and retention windows applied to them.
A database answers the question you asked, now, against every row. A reporting system answers an approximation of your question, later, against whatever it has retained and can fit in a table. Both are useful. Confusing one for the other produces a specific and predictable set of complaints:
- "I fired the event and it isn't there" — a timing question
- "My comparison only goes back two months" — a retention question
- "Half my values are in a row called (other)" — a cardinality question
- "Firebase says 8,400 installs and AppsFlyer says 6,900" — a definitional question
Not one of those is a bug. Each has a documented cause, and the fixes are entirely different — which is why "our analytics is broken" is an unhelpful ticket. In our portfolio, the teams that trust their data are not the ones with more sophisticated tooling. They are the ones who know which of these four things they are looking at.
Check your event data retention setting today. The default is short, deletion runs monthly, and deleted data does not come back — even though changing the setting later does apply to data you still hold. Details are two sections down, but if you read nothing else, go and look at that setting.
Why are my events not showing up yet?
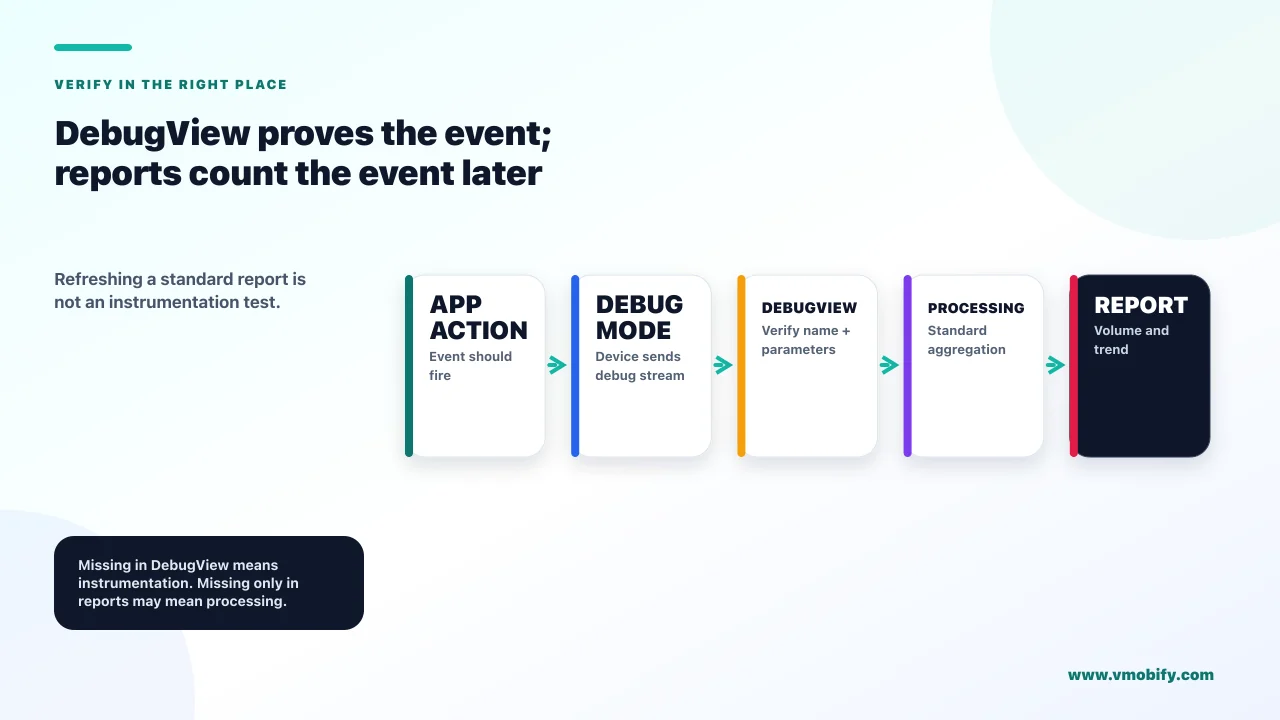
Because standard reports are built on a processing schedule rather than in real time, and the only place designed to confirm an event fired is DebugView. Waiting and refreshing the dashboard is the wrong tool for the question you are asking.
Firebase's own documentation on logging events is candid about this: the dashboard updates periodically throughout the day, and for immediate verification it directs you to debug output rather than to reports. DebugView is the tool built for that job. That is the whole answer to "is my event working" — you should never be answering it from a standard report.
DebugView
- Answers: did this event fire, with these parameters, right now
- Latency: effectively immediate
- Scope: only devices you have explicitly put in debug mode
- Use for: every instrumentation check, before and after release
Standard reports
- Answer: how many, across everyone, over a period
- Latency: processed on a schedule, not live
- Scope: your whole user base, aggregated
- Use for: trends and volumes, never for verification
Two consequences follow. First, an instrumentation bug found by staring at a dashboard has usually already cost you days of collection — verify in DebugView before the release ships, not after. Second, a same-day number is never final, so a "yesterday versus today" comparison read at nine in the morning is comparing a complete day against a partial one.
There is one hard figure worth knowing if you export to BigQuery: per Firebase's BigQuery export documentation, Firebase updates the daily event tables with events for a given date for up to three days after that date. Late-arriving data is a documented behaviour, not a glitch, and any pipeline that reads a day's table the morning after will systematically undercount. Build a three-day settling window into anything automated.
A weekly report generated on Monday morning for the week that ended Sunday is reading days that are still settling. Every week will look slightly worse than it was, and the shortfall is invisible because it is consistent. Generate the report a few days in arrears, or accept that the last day or two is provisional and label it that way.
What is the two-month retention setting quietly costing you?
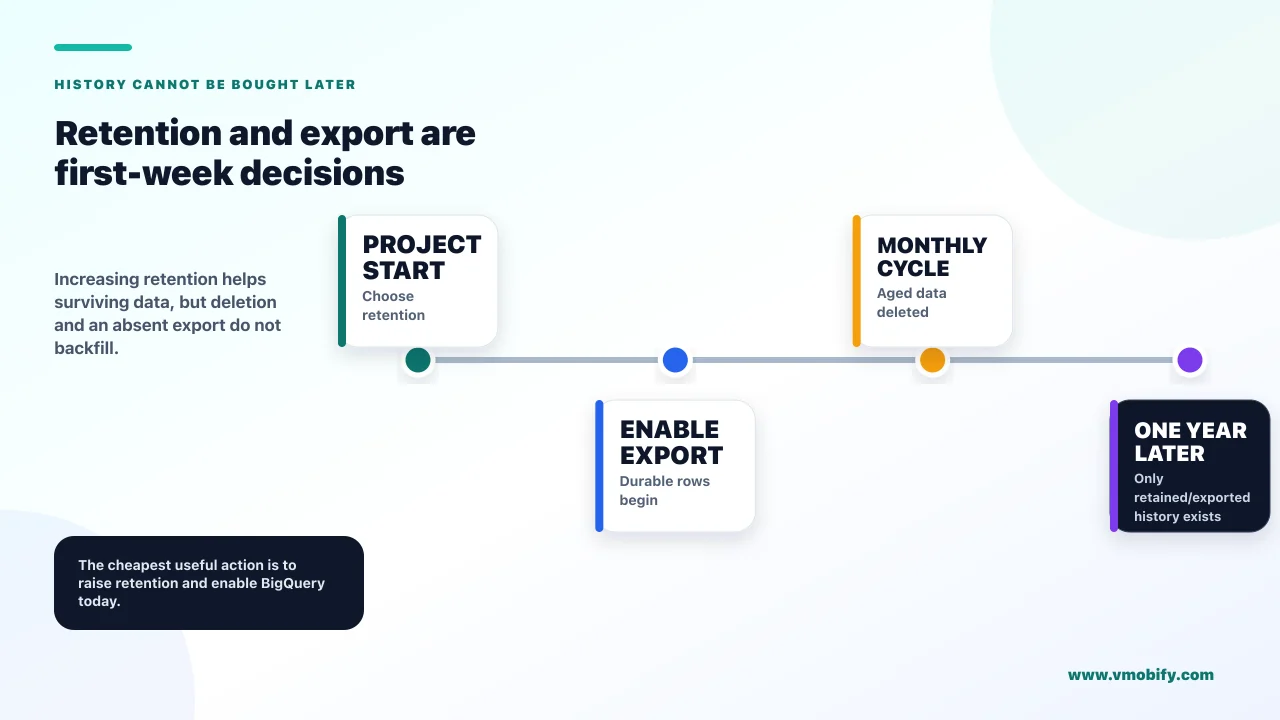
Every exploration you might want to run against last year's data, because event data outside the retention window is deleted on a monthly basis and no setting change brings it back. This is the most consequential default in Firebase Analytics and by far the least discussed.
The options, per Google Analytics' data retention documentation, are two months or fourteen months for user-level data, and two, fourteen, twenty-six, thirty-eight or fifty months for event-level data — with the longer event-level options available only on 360 properties.
Now the part that is widely misreported, including in guidance we reviewed while researching this article. Increasing the retention period is applied to data you have already collected. Google's wording is explicit: when you increase the retention period it is applied to data you have already collected. So raising it is not purely forward-looking.
The reason to change this today is not that the setting fails to apply backwards. It is that deletion is irreversible. Data that has already aged past your current window has been deleted on the monthly cycle and is gone. Raising the setting protects everything you still hold; it cannot resurrect what has already been purged. Every month you leave it at the short default, another month of history is destroyed permanently.
Two further details worth knowing. Reducing the retention period causes affected data to be deleted during the next monthly process, so a reduction is not instant but is equally permanent. And there is a short grace period after a change during which it can be reverted without data loss — which matters if someone lowers the setting by accident.
The practical consequence for a growth team is about the questions you will be able to ask later. Year-on-year seasonality, the retention curve of a cohort acquired nine months ago, whether last Diwali's campaign produced users who are still active — none of these can be answered from data that no longer exists. This is also the strongest single argument for exporting to BigQuery early, which we come back to below.
What is the "(other)" row, and which parameter caused it?
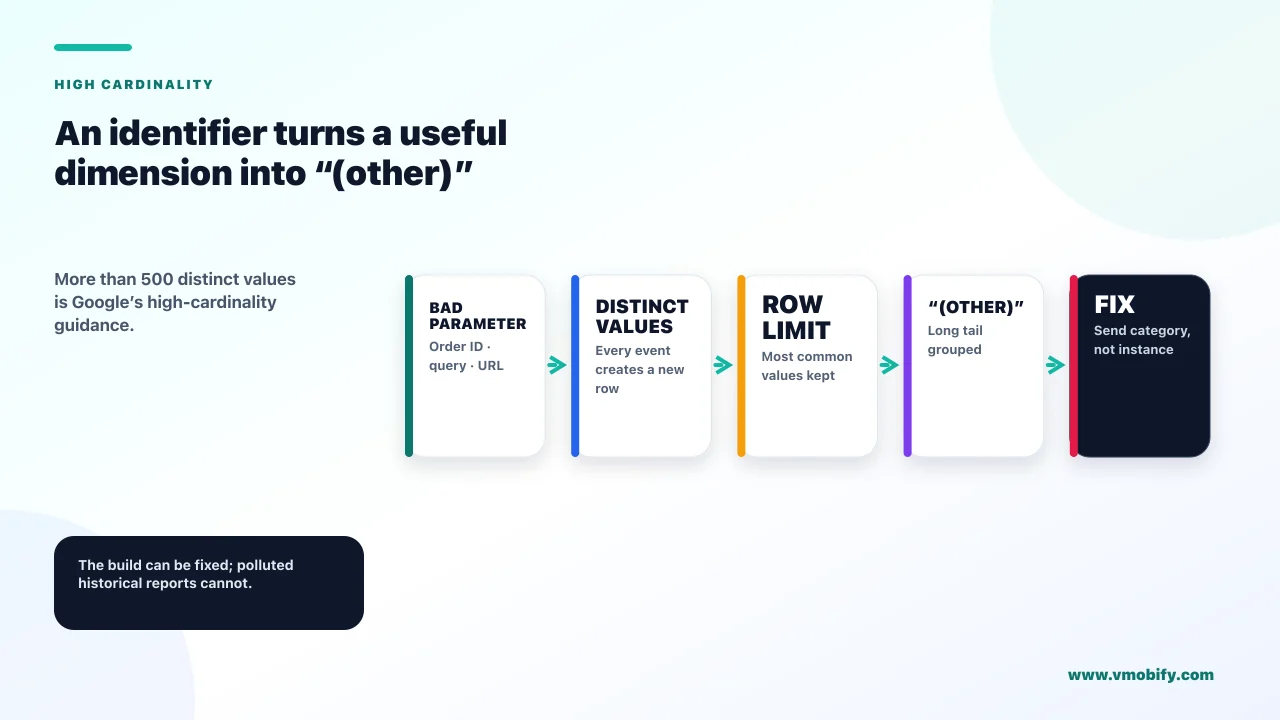
It is what a report shows when your data has more distinct values than the table can hold, and it is almost always caused by a parameter someone instrumented with an identifier in it. Once values fall into "(other)" they cannot be separated back out in that report.
The mechanism, per Google's documentation on high-cardinality dimensions, is straightforward: when a report exceeds its row limit, the rows are sorted from most to least common and the remainder are grouped together under "(other)". You keep the head of the distribution and lose the tail.
On what counts as high cardinality, the guidance is that any dimension with more than 500 values should be considered high-cardinality, because it significantly increases the cardinality of every table storing that dimension. Note the framing — Google states that the 500 figure is guidance rather than a hard limit, and that the actual limits vary by property type, by report and by how complex the query is. Multi-dimensional reports with filters are the most likely to trigger it.
In practice, the culprit is nearly always one of a short list:
- An identifier used as a parameter — order id, user id, session id, transaction reference. Every value is unique by definition, so cardinality equals your event volume.
- A free-text field — a search query, a note, a product title. Unbounded by design.
- A timestamp or a price sent as a raw value rather than bucketed into ranges.
- A URL or deep link with query parameters, where every variation counts as a distinct value.
Send the category, not the instance. Bucket price into bands. Send the screen name, not the deep link with its parameters. Keep the identifier out of parameters entirely and let BigQuery handle the row-level questions. What you cannot do is repair the reports you have already polluted — the historical data stays aggregated, so the sooner a bad parameter is caught, the less of your history it costs.
This is the strongest practical argument for defining an event schema before instrumenting rather than after. Our guide to building funnels that answer product questions covers the taxonomy side, and the cardinality question is the one most often skipped when a plan is written by someone who has not hit "(other)" before.
Why do Firebase, your MMP and Play Console never agree?
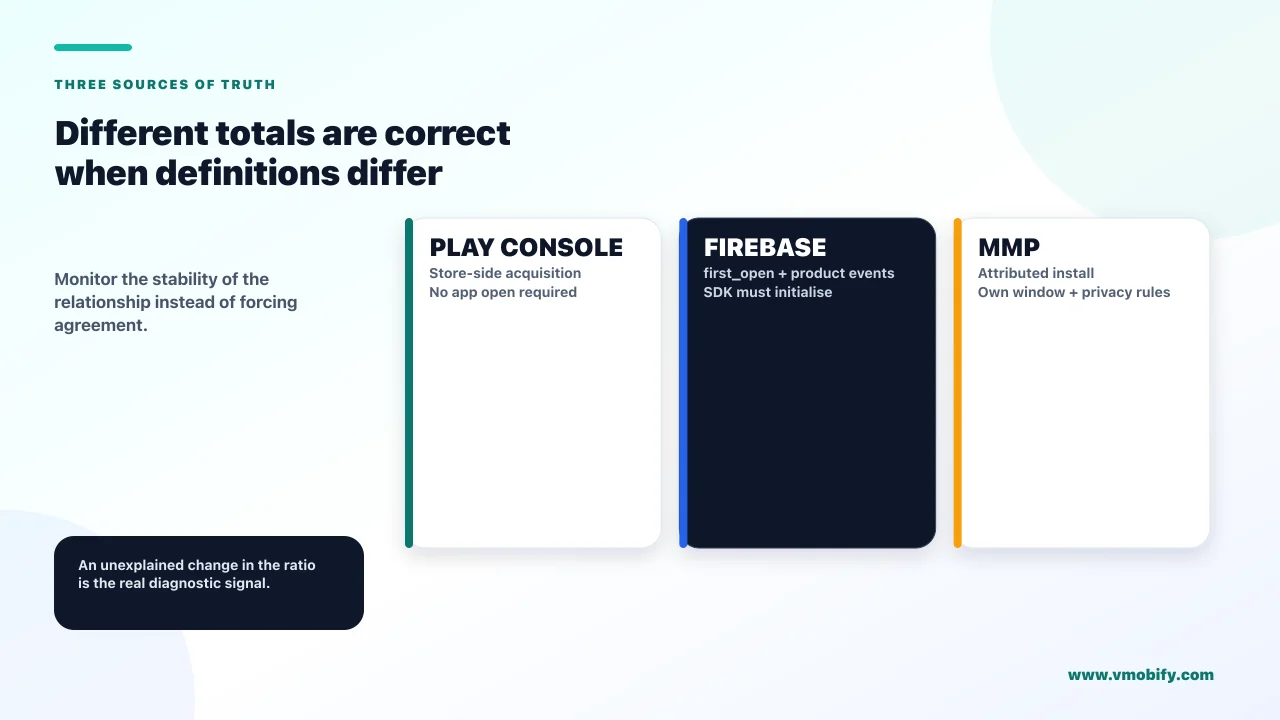
Because all three are counting different events over different populations with different attribution rules, and there is no configuration in which they converge. Chasing agreement between them is one of the most reliable ways to waste an engineering month.
What each is actually measuring:
Play Console
- Counts: store-side events — acquisitions, installs on devices, uninstalls
- Population: everyone who transacted with the store
- Does not need: your app to open, or an SDK to initialise
- Best for: store-side truth — the number the platform believes
Firebase
- Counts: first_open — the app being opened, not installed
- Population: devices where the SDK initialised and reported
- Misses: installs that never opened, and opens it never received
- Best for: in-app behaviour and product funnels
Your MMP
- Counts: attributed installs, under its own attribution window and rules
- Population: installs it can attribute, subject to platform privacy limits
- Differs by: lookback windows, view-through settings, SKAN and privacy modelling
- Best for: deciding which channel to pay more
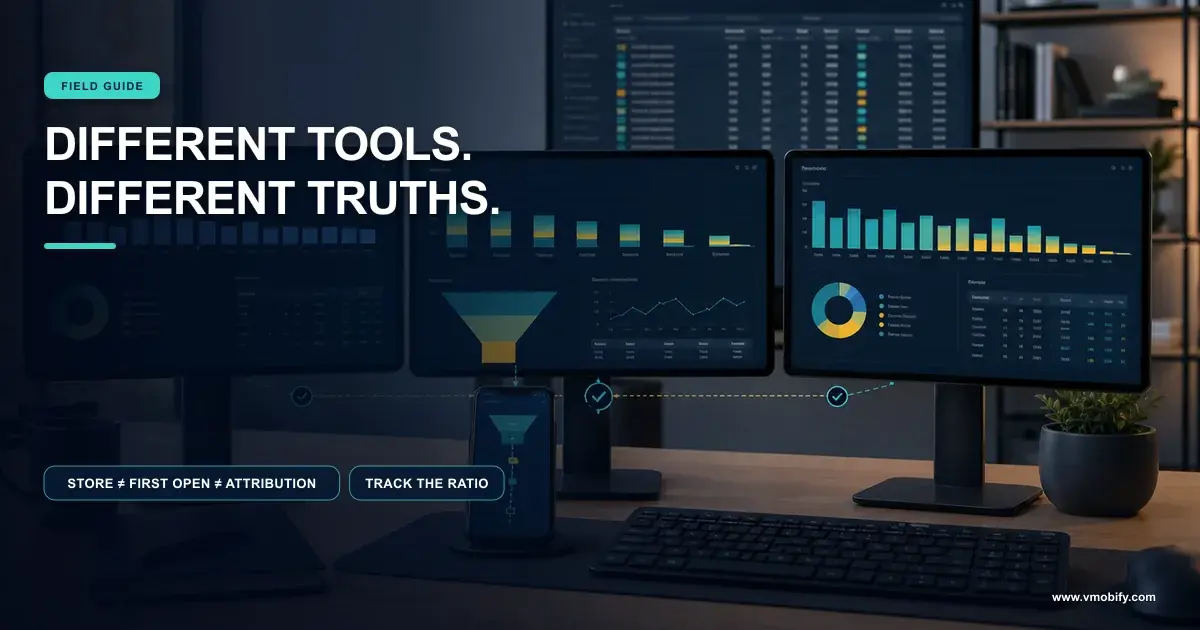
The single largest and most misunderstood gap is between an install and a first open. A download that is never opened is an install to the store and nothing at all to Firebase. On Android that gap is real and material, and it widens where devices are constrained or connectivity is intermittent — which is to say, exactly where a large part of an Indian install base sits.
Attribution adds a second layer of legitimate divergence. Different windows, different treatment of view-through, and different handling of platform privacy frameworks all produce different totals from the same underlying reality. Our comparison of the major MMPs covers where those rules differ, and the attribution guide covers why the totals cannot reconcile by design.
The correct goal is not agreement between the three. It is a stable, understood ratio between them. If Firebase first_open has been running at roughly 85% of Play Console installs for six months, that ratio is your baseline, and a sudden move in it is a genuine signal worth investigating. The absolute gap is not the problem; an unexplained change in the gap is.
Which of the three numbers should you report to a board?
Pick one source per question, write down which, and never switch between them to tell a better story. The specific choice matters far less than the consistency, but there is a defensible default for each type of question.
- Installs and store performance — Play Console and App Store Connect. These are the platforms' own numbers. When an investor or a partner checks, this is what they will see, and defending a different figure is a conversation you do not want.
- Paid channel performance — your MMP. It is the only one applying consistent attribution rules across channels, which is what makes channels comparable. Use it to decide where budget goes.
- Product behaviour, activation and funnels — Firebase. It is measuring what people did inside the app, which neither of the others sees at all.
- Revenue — the stores and your billing system, never an analytics SDK. Client-reported purchase events are a product signal, not a financial one. Finance numbers come from the source of truth for money.
Then state the source on the slide. "Installs: Play Console + App Store Connect" in small type under the number removes an entire category of argument, and it stops the quiet drift where whichever tool shows the better figure becomes that month's source.
Across the 300+ apps we have managed since 2013, mixed sourcing in a single report is one of the most common causes of a board losing confidence in a growth team — not because any individual number was wrong, but because the set could not be reconciled when someone asked. A consistent, slightly conservative number defended calmly beats a flattering one that changes source between quarters.
When can the console genuinely not answer your question?
When the question is about individual rows, arbitrary joins, or a period longer than your retention window — at which point the answer is BigQuery, not a better report. Recognising this early saves a great deal of time spent fighting the interface.
The console cannot help you when:
- The question needs row-level detail. "Which users did X then Y within ten minutes" is a query, not a report.
- The dimension is high cardinality. Anything that lands in "(other)" in the console is fully available in the export.
- You need to join to your own data — subscription state from your backend, support tickets, cost data from ad platforms.
- The period predates your retention window, assuming the export was running at the time.
- You need a custom attribution or cohort definition that the built-in reports do not express.
The strategic argument for turning the export on early is that it is the only durable copy. Retention settings govern what the console keeps; an export accumulates independently. A team that enabled BigQuery in month two can answer questions in year two that a team relying on console retention simply cannot, regardless of how much they are prepared to pay later.
Remember the three-day settling behaviour when you build on the export: daily tables receive late events for up to three days after the event date. Any scheduled query that treats yesterday's table as final will undercount, consistently and invisibly.
If you do nothing else after reading this, raise the retention setting and switch on the BigQuery export. Neither takes long, neither needs engineering time to design, and both are worth far more in twelve months than any dashboard you build now. The one thing you cannot buy later is history you did not keep. Our analytics stack comparison covers what to add on top once those two are in place.
How do you audit an analytics setup you inherited?
In under an hour, by checking six things in order — and the first two are settings rather than code, because those are the ones that are silently costing you data right now.
- Data retention setting. If it is at the short default, change it. Every month at the default destroys another month of history permanently.
- BigQuery export. On or off, and if on, since when. That date is the real start of your usable history.
- The event list, read as a stranger would. Can you tell what each event means from its name alone? Are there near-duplicates from two different implementations —
signup_completeandsign_up_completed— which is the classic signature of two developers instrumenting independently? - Any report showing "(other)". Find the parameter responsible. It is polluting history for as long as it stays in the build.
- Which events are marked as key events. If everything is a conversion, nothing is. This is usually where you learn what the previous team actually cared about.
- DebugView against the current build, walking the core journey. Compare what fires against what you expected. This is the only step that tells you whether the instrumentation still matches the product.
Step six regularly produces the biggest surprise, because instrumentation decays. A screen gets rebuilt and its event is not reimplemented. A parameter is renamed on one platform only. A funnel that has looked flat for months turns out to be missing its middle step entirely, and the drop-off everyone has been trying to fix is a measurement artefact.
Write the six answers down. It takes ten minutes and it is the document you will want the next time someone asks why two numbers disagree.
Which mistakes are hardest to undo later?
The ones that destroy data rather than misrepresent it — because a bad report can be rebuilt and deleted history cannot. Ranked by how permanent the damage is:
- Leaving retention at the short default. Irreversible. Every month costs a month, and no later change recovers what has been deleted.
- Not enabling the BigQuery export. Irreversible for the period it was off. The export does not backfill.
- Putting an identifier in an event parameter. Permanent for the affected history. You can fix the build; the polluted reports stay polluted.
- Inconsistent event naming across platforms. Fixable going forward, but the historical series is split and every cross-platform comparison before the fix stays unreliable.
- Marking everything as a key event. Fixable, and worth fixing, but it degrades every report while it persists.
- Reporting from whichever tool flatters the number. Fixable in a day, and the most damaging to trust while it continues.
The pattern is that the expensive mistakes are all decisions made in the first fortnight of a project by whoever set up the SDK, usually without knowing they were decisions at all. Retention and export are two toggles that nobody discusses in a kickoff and that determine what questions the business can answer two years later.
The idea worth carrying out of this article is that Firebase is not lying to you and neither is your MMP. They are different instruments pointed at different things, reporting on different schedules, through interfaces with limits that are documented but rarely read. Once you know which instrument answers which question, the numbers stop being contradictory and start being useful. If you would rather have your setup audited against these six checks than work through it yourself, send us your event list and we will start with the retention setting.
Frequently Asked Questions
Why are my Firebase events not showing up in the console?+
Standard reports are built on a processing schedule rather than in real time — Firebase describes the dashboard as updating periodically through the day and directs you to debug output for immediate verification. Use DebugView to confirm an event fired with the right parameters; use standard reports only for volumes and trends. If an event is absent from DebugView on a device in debug mode, that is an instrumentation problem rather than a reporting delay.
Does changing the Firebase data retention setting apply to old data?+
Increasing the retention period is applied to data you have already collected, so it is not purely forward-looking. The important qualification is that data which already aged past your previous window has been deleted on the monthly cycle and cannot be brought back by any setting change. Reducing the period causes affected data to be deleted during the next monthly process, and there is a short grace period during which a change can be reverted.
What does the "(other)" row mean in my reports?+
It means the report exceeded its row limit, so the rows were sorted from most to least common and the remainder grouped together. It is a symptom of high cardinality — Google treats a dimension with more than 500 distinct values as high-cardinality guidance, though the actual limits vary by property type, report and query complexity. The usual cause is an identifier, free-text field, raw price or parameterised URL sent as an event parameter.
Why does Firebase show fewer installs than Play Console?+
Because they count different things. Play Console counts store-side acquisitions and installs on devices; Firebase counts first_open, which is the app being opened. A download that is never opened is an install to the store and nothing to Firebase. The gap is legitimate and widens where devices are constrained or connectivity is poor. Track the ratio between them rather than trying to make them match.
Which install number should I report to investors?+
Play Console and App Store Connect, because those are the platforms' own figures and the ones anyone checking will see. Use your MMP for paid channel comparisons, Firebase for in-app behaviour, and the stores or your billing system for revenue. State the source on the slide. The consistency matters more than which source you pick, and mixed sourcing within one report is what actually costs a team credibility.
Can I fix an event parameter that caused a "(other)" row?+
You can fix it going forward by sending a category instead of an instance — bucket prices into bands, send screen names rather than parameterised URLs, keep identifiers out of parameters entirely. What you cannot do is repair the historical reports, which stay aggregated. That is why catching a high-cardinality parameter early matters: the longer it ships, the more of your history it costs.
When do I actually need BigQuery rather than the Firebase console?+
When the question needs row-level detail, when it involves a high-cardinality dimension that the console groups into "(other)", when you need to join analytics data to your own backend or cost data, when the period predates your retention window, or when you need a cohort or attribution definition the built-in reports do not express. Enabling the export early matters because it accumulates independently of console retention and does not backfill.
Sources
- Google Analytics — Data retention — Retention options for user-level and event-level data, the retroactive behaviour of an increase, and the monthly deletion process
- Google Analytics — High-cardinality dimensions and the (other) row — How rows are grouped when a report exceeds its limit, and the 500-value cardinality guidance
- Firebase — BigQuery export for Analytics — Daily tables receive events for up to three days after the event date
- Firebase — Log events — Dashboard update cadence and the recommendation to verify events through debug output rather than reports
- Firebase — DebugView — The tool designed for verifying that events fire with the expected parameters
- Firebase — Get started with Analytics — SDK setup and the automatically collected events that underpin first_open
- Google Analytics — Key events — What promoting an event to a key event changes in reporting
About the author
Amol Pomane — Founder, Vmobify
Amol leads Vmobify, a mobile app growth agency that has driven 30M+ downloads and ranked 54K+ keywords across 300+ apps since 2013. He writes about ASO, paid user acquisition, retention, and the operational reality of scaling mobile apps in India and global markets.