Low-Volume Experimentation for Indie Apps: Learn Without Fake Wins
Low traffic does not prevent learning; it prevents small-effect A/B tests from resolving quickly. This guide shows indie teams how to select high-information tests, size decisions, combine behavioural and qualitative evidence, and report uncertainty honestly.

On this page
- What does low-volume experimentation mean?
- Which app changes are worth testing at low volume?
- How do you calculate a feasible sample size?
- Which experiment designs work with little traffic?
- How should you use Firebase A/B Testing at low volume?
- How can qualitative research strengthen a small test?
- How do you read an inconclusive experiment?
- When should you stop an experiment early?
- How do you avoid false winners and metric shopping?
- What should a low-volume experiment report contain?
- Frequently Asked Questions
What does low-volume experimentation mean?
Low-volume experimentation means choosing methods and effect sizes that match the small number of eligible observations your app can realistically generate. It does not mean lowering the confidence threshold until every chart produces a winner.
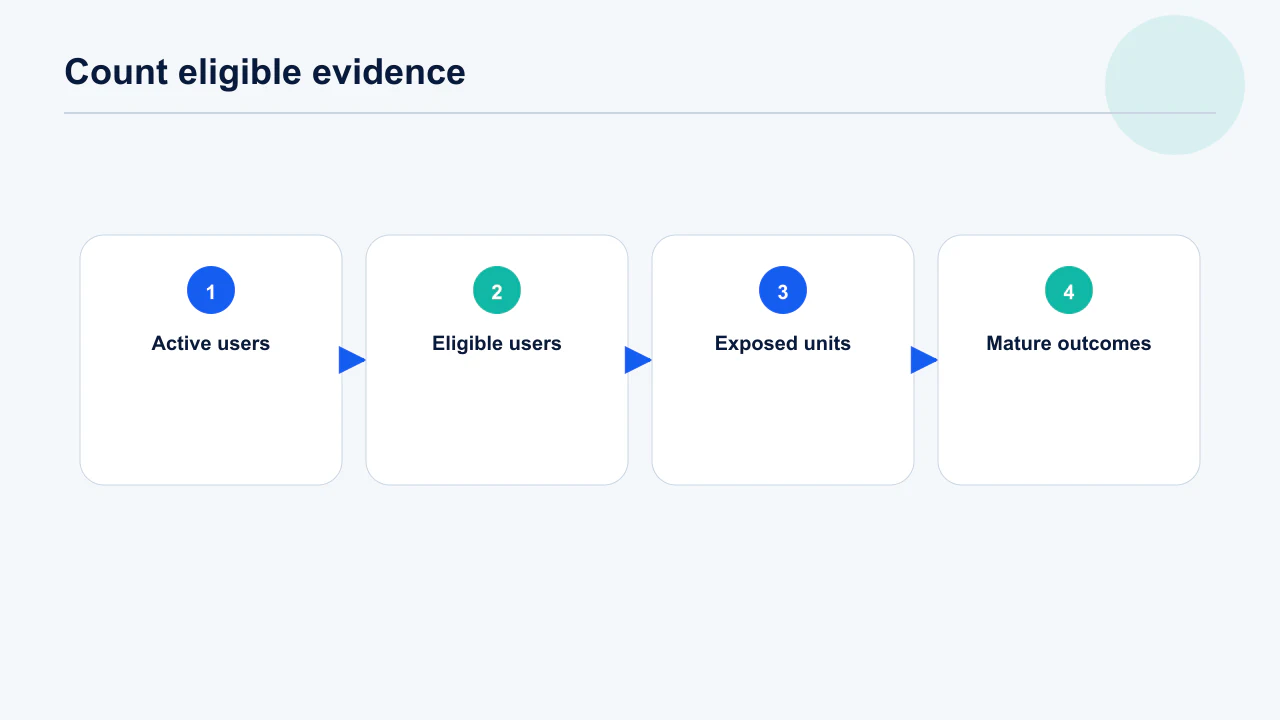
Volume is defined at the experiment unit after eligibility, not by total installs. A paywall test may include only users who reach the paywall; a renewal test may need weeks of follow-up. Estimate daily eligible users, baseline conversion and outcome delay before choosing a method.
- Unit: Decide whether assignment is by user, device, account, session, market or time block. The unit determines independence.
- Eligibility: Count only users who can receive the variant and produce the outcome. Top-line MAU is misleading.
- Baseline: Use a recent comparable cohort and display numerator with rate. Seasonality and releases can shift it.
- Delay: Include the time between exposure and a mature outcome. Retention cannot be read tomorrow.
Decision rule: Call a test feasible only when the eligible sample and decision deadline can detect an effect large enough to change what you will do.
A subscription app with 20,000 monthly users may still be low-volume for an annual-plan renewal test because only a small cohort reaches the decision each week.
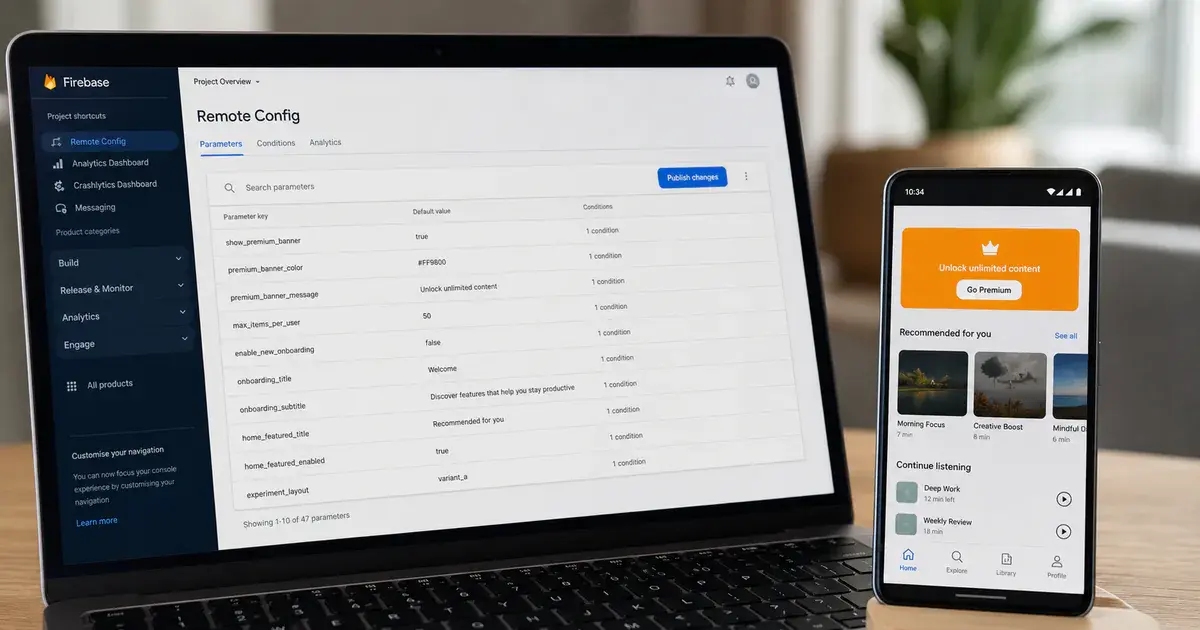
The honest starting position is that most indie apps cannot detect the effects they care about, and pretending otherwise produces confident wrong decisions. A test needs roughly sixteen times as many users to detect a five per cent lift as a twenty per cent one, which is why small teams should test only changes large enough to move a metric visibly. Work out what you can detect before designing anything: take your daily eligible users, your baseline conversion rate and a realistic run length, and see what effect size that combination can actually resolve. Firebase's A/B testing concepts set out the assignment and activation model these calculations depend on.
If the answer is that nothing detectable is testable, that is a finding, not a failure. Remote config and A/B testing still earn their place as a safe rollout mechanism.
Which app changes are worth testing at low volume?
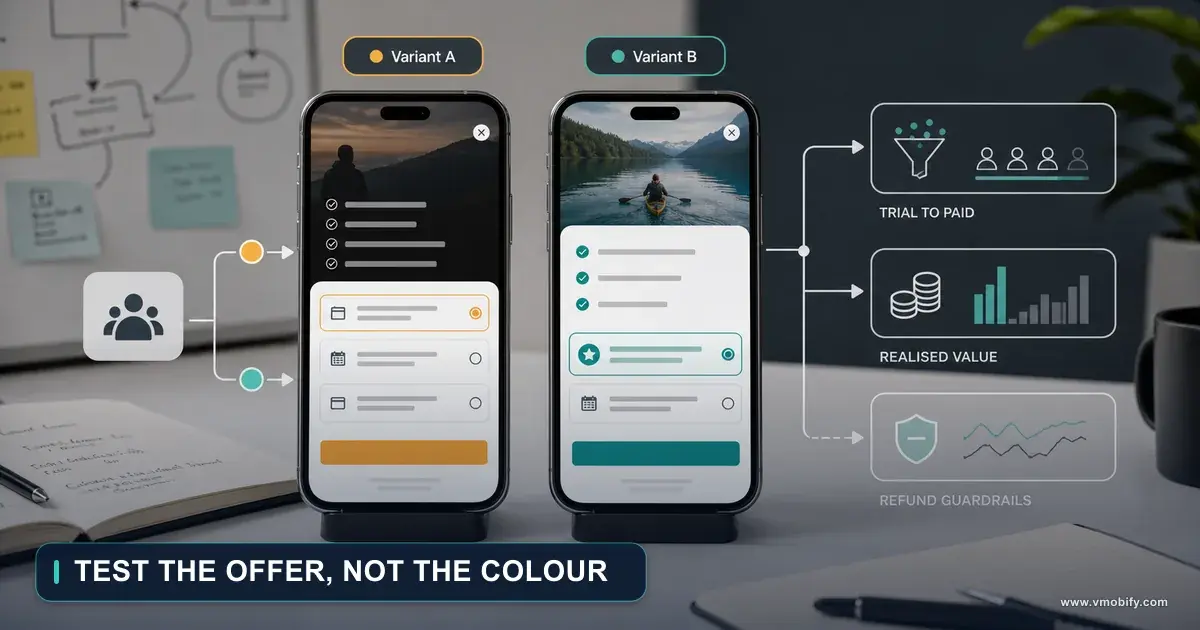
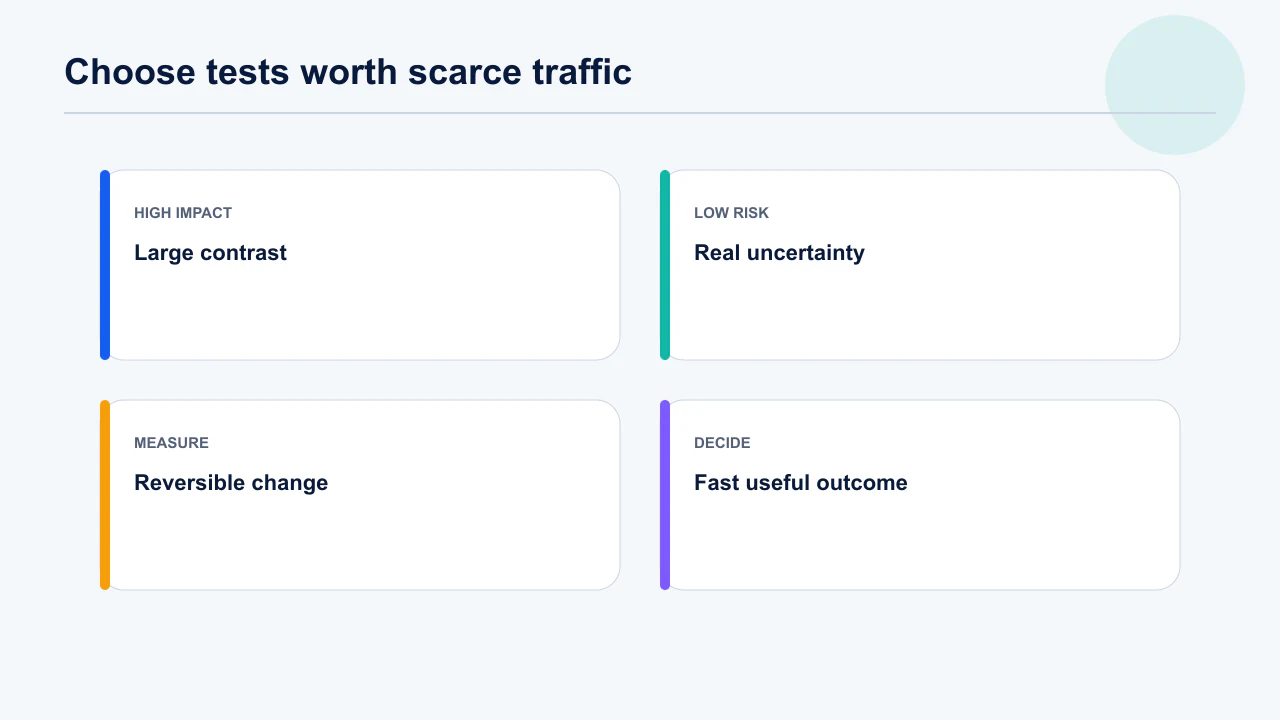
Test changes that could create a large behavioural difference, are uncertain enough to learn from and are reversible if guardrails fail. Headline value proposition, onboarding structure, paywall timing and a major workflow often qualify; button shade and microcopy punctuation usually do not.
Score candidate decisions by plausible impact, uncertainty, eligible reach, reversibility and time to outcome. Research or ship obvious corrections directly. Reserve controlled experiments for decisions where the wrong choice is consequential and both variants are defensible.
- Large contrast: Make variants meaningfully different so a useful effect is detectable. Preserve the same underlying promise.
- Real uncertainty: Write credible reasons each variant could win. Testing a foregone conclusion wastes users.
- Reversibility: Use flags and compatible data models. Low volume does not remove harm.
- Fast outcome: Prefer activation or task completion before distant LTV where appropriate. Keep revenue and retention as guardrails.
Decision rule: If the smallest effect you care about is below what three months of traffic can detect, redesign the contrast or use another evidence method.
We would test guided versus self-directed onboarding, not two nearly identical tooltip sentences. The first can change activation enough to observe; the second invites noise.
Filter candidates by contrast before anything else, because at low volume only large differences are legible. A new paywall structure, a different onboarding path, a changed default — these can move a metric enough to see. A button colour, a reworded label or a small copy change almost certainly cannot, and testing them consumes weeks to produce a result indistinguishable from noise. Genuine uncertainty is the second filter: if the team already agrees which version is better and the change is reversible, ship it and watch, rather than spending traffic proving a point nobody disputes. Firebase's experiment configuration makes the ship-and-watch path straightforward to unwind.
Keep a list of untestable-but-shipped changes with their reasoning. Paywall testing is usually where the largest contrast lives.
How do you calculate a feasible sample size?
Start with baseline rate, minimum detectable effect, allocation, significance level and desired power, then compare the required sample with eligible traffic. Firebase says its inference does not require a declared minimum beforehand, but its experiment concepts still recommends a sample-size calculator and enough data for a useful result.
The minimum detectable effect is a product decision: the smallest improvement that repays engineering, risk and complexity. Smaller target effects require dramatically more observations. Use a calculator or statistician, retain the inputs, and run sensitivity cases instead of publishing a universal “1,000 users” rule.
- Baseline: Enter the actual eligible conversion rate, not an industry benchmark. Use a comparable recent window.
- Effect: Define absolute and relative lift to avoid ambiguity. A move from 5% to 6% is one point and 20% relative.
- Power: Choose the chance of detecting the target effect when it is real. Document the trade-off.
- Duration: Divide required observations by daily eligible units and add outcome maturity. Include weekly behaviour.
Decision rule: Do not launch when required duration exceeds the period in which product, acquisition mix or seasonality can reasonably remain stable.
A calculator is a planning tool, not a promise. If assumptions change mid-test, record them and treat the original inference cautiously rather than quietly rewriting the brief.
Do the arithmetic before the experiment, not after, because the most common outcome of skipping it is a test that could never have succeeded. You need four inputs: the baseline rate, the smallest effect worth acting on, the confidence you want and the power you want. Conventional settings are ninety-five per cent confidence and eighty per cent power, though a reversible change may justify relaxing them deliberately — the point is to relax them on purpose and record that you did. Multiply the required sample by the number of variants, divide by daily eligible users, and if the answer exceeds about six weeks the design needs changing rather than starting. Play's store listing experiments report their own confidence intervals, which is worth reading before trusting a short run.
Write the required sample and planned duration into the test document before launch. Testing tools differ in how they handle small samples.
Which experiment designs work with little traffic?
Use user-level randomisation when it is feasible, and switch to time, market, staged or within-subject designs only when their assumptions match the product. Each alternative trades one source of noise for another; none manufactures information.
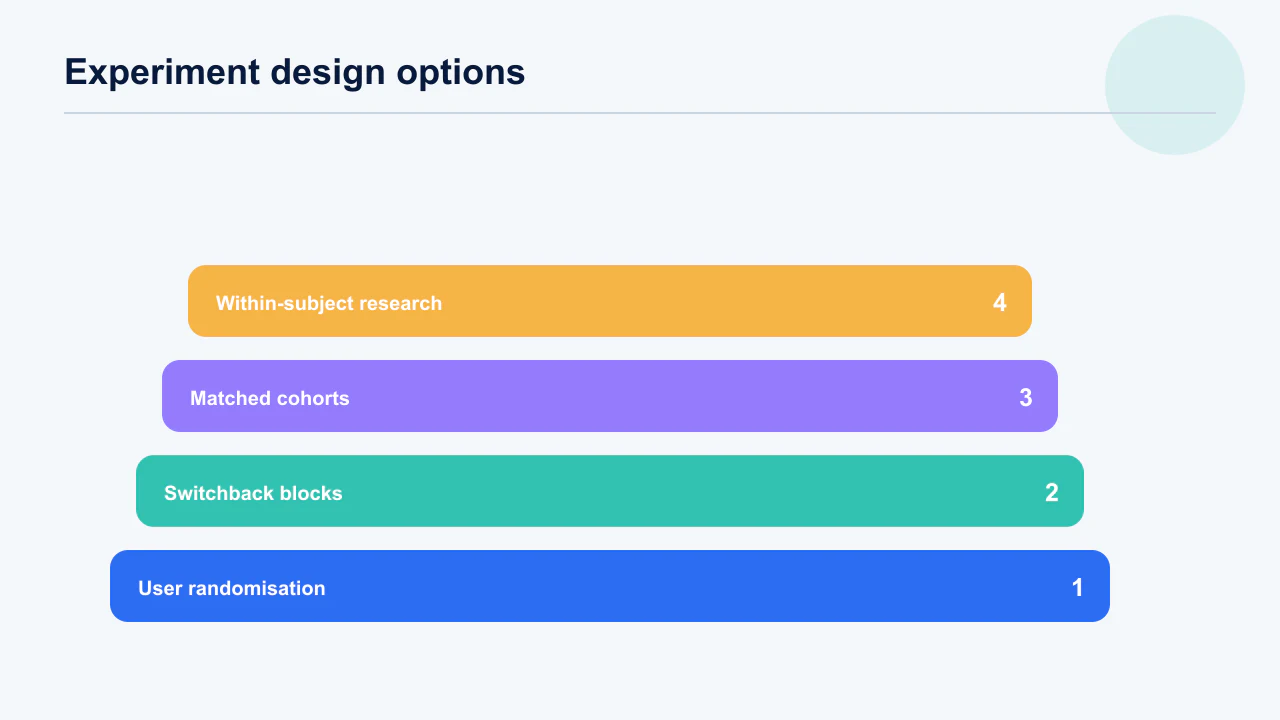
A switchback alternates treatments across time blocks, useful when users share an environment but vulnerable to day-of-week and carryover. A market test compares geographies but needs comparable baselines. A staged rollout offers safety evidence, not necessarily causal inference. Within-subject tasks can work for usability but learning effects matter.
- Randomised users: Best default when users can remain assigned and interference is limited. Hash a stable identifier.
- Switchback: Useful for marketplace or operational changes affecting everyone. Balance time blocks and washout.
- Matched cohorts: Use historical or geographic comparison for large changes. Report confounding explicitly.
- Within-subject: Good for task time and comprehension in research sessions. Counterbalance order.
Decision rule: Choose the design whose most dangerous assumption you can test, monitor or honestly disclose.
A before-and-after conversion lift during a marketing campaign is not clean product evidence. If randomisation is impossible, annotate the campaign and narrow the claim.
Change the design when the traffic will not support the standard one. Switchback alternates the whole population between variants over time periods, using each period as its own comparison and removing between-user variance — effective for pricing or scheduling changes, unsuitable where exposure to one variant changes later behaviour. Matched cohorts compare similar groups across time when randomisation is impossible. Within-subject designs ask the same user to experience both, which suits interface preference questions but not conversion. Each trades a different assumption for statistical power. Product page optimisation tests run at the store level, so they draw on store traffic rather than your in-app population.
Store-level tests often have more traffic available than in-app ones. The ASO testing framework covers that surface in detail.
How should you use Firebase A/B Testing at low volume?
Use Firebase for stable random assignment and measurement, but size the decision independently and avoid editing behaviour during the run. Firebase uses frequentist inference, daily result refreshes and persistent variant assignment; it recommends a typical Remote Config experiment run for at least two weeks and stops processing after 90 days.
Set an activation event after parameters are fetched but before the changed experience is used. Pick one primary event and a short list of guardrails. Audience membership may lag, so time-sensitive targeting should prefer immediate properties or built-in conditions where suitable.
- Assignment: Use a stable Firebase installation or authenticated unit appropriate to the journey. Understand cross-device limitations.
- Activation: Place it between configuration availability and treatment exposure. Wrong ordering biases inclusion.
- Metrics: Choose one outcome tied to the hypothesis and crash-free or revenue guardrails. Do not promote whichever metric turns green.
- Export: Use BigQuery experiment properties for independent cohort checks where justified. Preserve exact date and variant definitions.
Decision rule: Do not modify targeting or variant behaviour after exposure begins unless you are willing to invalidate or explicitly segment the result.
A low-traffic test can run longer, but a long run crosses releases and acquisition shifts. We prefer fewer, larger contrasts over 90 days of accumulating confounders.
Separate assignment from activation or you will dilute the effect until it disappears. Users assigned to a variant but never reaching the screen it changes contribute noise to both arms; only those who actually encountered the difference belong in the analysis. Configure activation on the event that represents exposure, and keep assignment stable across sessions and app updates so a returning user does not switch arms. Export raw event data rather than relying only on the console summary, because at low volume you will want to inspect individual sequences and re-run the analysis with a different cut. The NIST/SEMATECH statistics handbook is a solid free reference for choosing and applying the test itself.
Check assignment balance before reading results. A disciplined event plan is a precondition for any of this.
How can qualitative research strengthen a small test?
Use interviews, session review and task observation to explain mechanisms and reject broken variants, not to manufacture a population-wide lift. Qualitative evidence answers why and where; controlled behavioural data estimates whether and how much.
Recruit from both variant cohorts after the outcome window without revealing the desired answer. Use a fixed task and neutral prompts. Tag observed friction before reading conversion outcomes where possible. Five conversations can reveal a repeated usability failure, but cannot prove that 73% of all users prefer a design.
- Prototype first: Observe the largest design contrasts before engineering both fully. Remove obvious comprehension failures.
- Sample deliberately: Include activated, abandoned and edge-case users. Convenience samples hide failure.
- Code themes: Use a consistent taxonomy and preserve verbatim notes privately. Count occurrences without overclaiming prevalence.
- Triangulate: Ask whether behavioural movement and observed mechanism agree. Disagreement is a finding.
Decision rule: Use qualitative evidence to change the hypothesis or implementation; use it alone for a population claim only when that claim is explicitly qualitative.
We have rejected a numerically promising onboarding variant after recordings showed users accidentally advancing. The metric moved; the intended understanding did not.
Use qualitative work to decide what to test and to explain what happened, because five moderated sessions will find a broken flow that a six-week experiment would only report as a flat result. Recruit deliberately from the segment the change targets rather than from whoever answers, run the prototype before building, and code themes rather than counting mentions. The strongest evidence at low volume is agreement between sources: a qualitative finding, a supporting funnel movement and a small experiment pointing the same way justify a decision that none of them would support alone. Microsoft's experimentation research documents how often even large-sample tests contradict confident expectations.
Record qualitative findings with the same rigour as quantitative ones. Funnel analytics show where to point the research.
How do you read an inconclusive experiment?
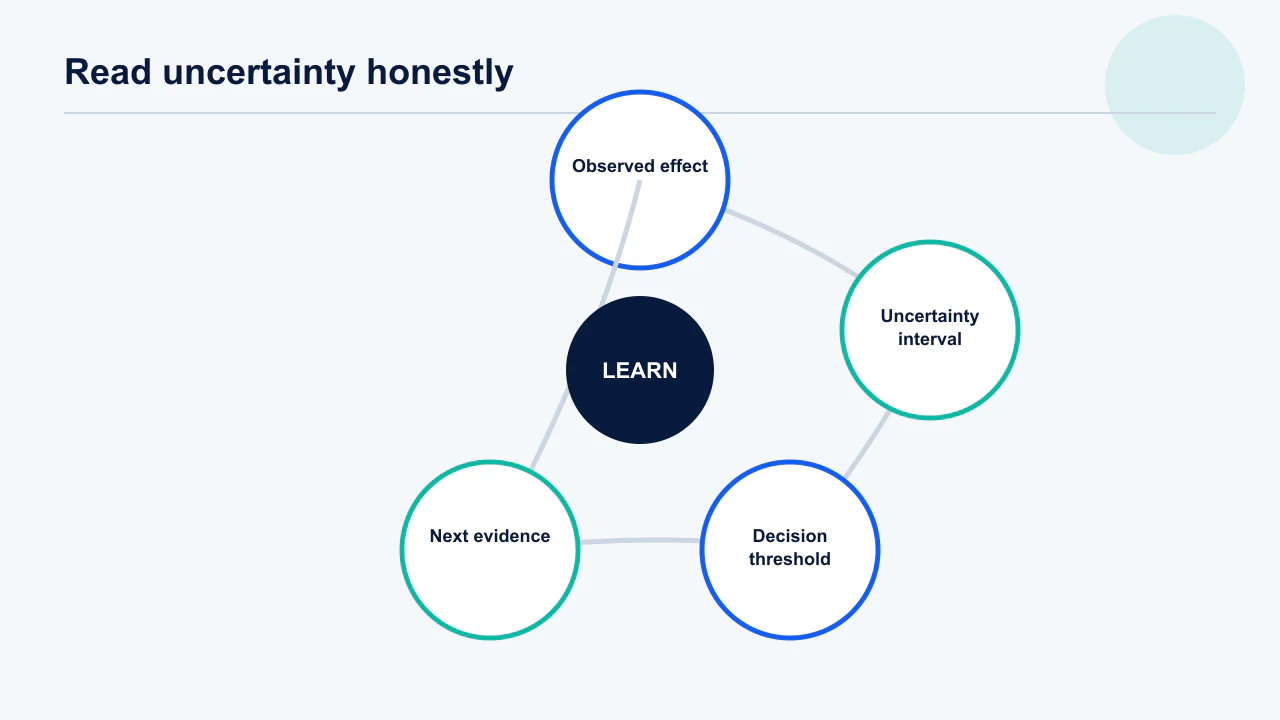
Report the observed effect, uncertainty interval, sample and remaining plausible outcomes instead of translating “not significant” into “no difference”. A small test can rule out a huge effect while remaining unable to distinguish a modest gain from a modest loss.
Compare the interval with the minimum effect worth acting on. If the whole interval is commercially trivial, variants may be practically equivalent. If it spans meaningful harm and benefit, the decision is unresolved. Continuing only helps when the product and audience can remain stable and additional data will arrive.
- Observed data: Show numerator, denominator and rate for each variant. Avoid percentages without counts.
- Uncertainty: Display a compatible interval and the method used. Do not report a naked p-value.
- Decision threshold: Overlay the minimum useful gain and maximum tolerable harm. Product economics matter.
- Next action: Continue, stop as equivalent, choose on other evidence or redesign. State why.
Decision rule: An inconclusive result is useful when it changes which effects remain credible or prevents a false winner from shipping.
“B won by 8%” sounds decisive until the interval spans a 15% loss to a 35% gain. The honest sentence is that the test is too imprecise for the decision.
Report the interval, not the verdict, because 'no significant difference' is routinely misread as 'no difference'. A result showing anywhere between an eight per cent decline and a twelve per cent improvement has not shown the change is neutral; it has shown the test could not distinguish a meaningful gain from a meaningful loss. State the observed effect with its confidence interval, then decide against a pre-agreed threshold: ship if the plausible downside is acceptable and the change has other merits, otherwise keep the current version. Remote config makes shipping-under-uncertainty safe, since a change that later looks wrong can be withdrawn without a release.
Never re-label an inconclusive test as a win in a summary deck. Incrementality methods face the same interpretation trap at larger scale.
When should you stop an experiment early?
Stop for predefined safety harm, implementation failure or a valid sequential boundary—not because today’s graph looks exciting. Repeatedly checking a conventional fixed-horizon test and stopping on a favourable day increases false-positive risk.
Write stop conditions before launch. Operational guardrails such as crashes, failed purchases or severe support incidents can stop exposure immediately. Statistical early stopping requires a method designed for repeated looks. If instrumentation breaks, pause assignment and label affected data rather than excluding inconvenient days later.
- Safety: Stop when a critical guardrail crosses its declared threshold. Protect users first.
- Integrity: Stop when assignment, exposure or outcome tracking is corrupted. Do not patch data invisibly.
- Futility: Use a planned rule if further sample cannot change the action. Avoid ad hoc pessimism.
- Sequential method: Use boundaries or Bayesian policy selected in advance. Retain every look and decision.
Decision rule: The person who benefits from a positive outcome should not invent the early-stop rule after seeing the chart.
Our experiment logs include every pause, rollout change and metric alert. That timeline often explains apparent lifts better than the final dashboard does.
Decide the stopping rules before launch, because peeking at an accumulating result and stopping when it looks good manufactures significance out of noise. Safety and integrity stops are always legitimate: a crash, a payment failure or a broken assignment should end the test immediately. Futility stops are legitimate when the observed effect makes the target outcome implausible within the planned run. Stopping early because the numbers currently favour your preferred variant is not a stop, it is a bias. If you genuinely need to look repeatedly, use a sequential method that accounts for it rather than applying a fixed-sample test many times. Analytics documentation on experiment duration explains why short runs also miss weekday and weekend cycles.
Write the stopping rules into the test document and have someone else hold you to them. A safe rollback path reduces the temptation to stop early.
How do you avoid false winners and metric shopping?
Declare one primary outcome, constrain secondary analyses and distinguish exploratory findings from confirmatory decisions. With enough variants, segments and metrics, ordinary noise will produce something that looks impressive.
Use a short signed-off brief containing hypothesis, unit, eligibility, primary outcome, guardrails, minimum effect, duration and analysis method. Analyse the intended population first. Segment exploration can generate the next hypothesis but should not retroactively become the success criterion.
- One primary: Choose the outcome that would actually cause the decision. Everything cannot be primary.
- Few variants: Every arm divides scarce traffic and expands comparison risk. Test the strongest contrast.
- Stable segments: Define geography, platform and lifecycle cohorts before the run. Label post-hoc cuts exploratory.
- Complete reporting: Publish negative and inconclusive results internally. A decision log defeats survivor bias.
Decision rule: If the winning sentence was not possible to write before the test began, label it exploratory and validate it separately.
A variant that loses activation but wins one small-country seven-day retention slice is not a retention winner. It is a hypothesis about that slice.
Commit to one primary metric in writing and treat everything else as context, because with enough metrics something always looks significant. Twenty independent measures at ninety-five per cent confidence will produce roughly one false positive by chance alone, and a small team checking retention, conversion, session length, revenue and engagement across three segments has far more than twenty comparisons available. Keep variants to two where possible, fix the segments before launch rather than discovering them afterwards, and report every metric you looked at — including the ones that went the wrong way. Firebase's concepts documentation covers how goal metrics are defined and why changing them mid-test invalidates the result.
A segment discovered after the fact is a hypothesis for the next test, never a result from this one. Tooling should make the pre-registration easy.
What should a low-volume experiment report contain?
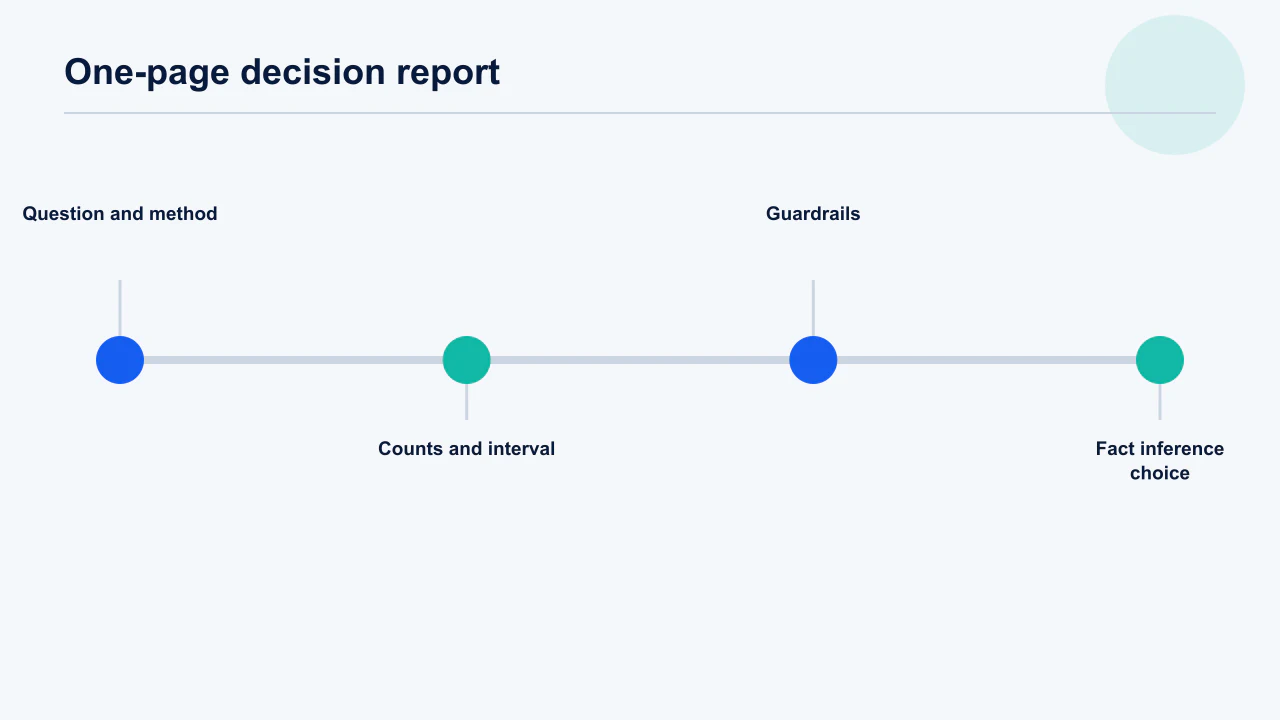
A useful report contains the decision, complete context, observed counts, uncertainty, guardrails, caveats and the next evidence step on one page. It should let a future operator reconstruct why the team acted without opening the analytics tool.
Lead with the decision and its confidence, then distinguish facts from interpretation. Link implementation version, exposure dates and query or dashboard. Include acquisition or release events that changed the population. Archive screenshots only as supporting evidence; tables and definitions remain the source of truth.
- Question: State the choice and hypothesis in plain language. Avoid a project-code title.
- Method: Document unit, allocation, eligibility, duration and exclusions. Name deviations.
- Result: Show counts, rates, effect and uncertainty plus every guardrail. Include negative evidence.
- Decision: Choose ship, stop, continue, redesign or defer and name the owner. Set a review date.
Decision rule: A report is complete only when someone outside the experiment can identify what would have produced a different decision.
We use a fact-inference-choice table. “312 of 980 activated” is fact; “the shorter path reduced confusion” is inference; “ship to 50%” is choice.
Keep the report to one page and write the question and method before the result exists, because a document written afterwards will unconsciously fit the story to the outcome. Record the hypothesis, the primary metric, the required sample, the planned duration and the stopping rules up front; add the observed effect with its interval, the decision and the reasoning at the end. Store the reports together so the team accumulates a searchable record of what has already been tried — the largest practical benefit of experimentation at small scale is not any single result but no longer relitigating the same argument every quarter. Experiment configuration should be captured in the report so a future run is reproducible.
Include inconclusive and abandoned tests in the archive. Honest records are what keep a small team from repeating expensive mistakes.
Frequently Asked Questions
How many users do I need for an app A/B test?+
There is no universal number. Required sample depends on baseline rate, minimum effect, allocation, significance level and power. Calculate those inputs for eligible users and compare the resulting duration with how long the product can remain stable.
Can I run an A/B test with fewer than 1,000 users?+
Sometimes, if the expected effect is large and the outcome common. In other cases even tens of thousands are insufficient. A sample-size calculation and uncertainty interval are more honest than a fixed threshold.
Should a low-traffic app use Bayesian testing?+
Bayesian methods can express probability and expected loss in decision-friendly terms, but they do not create information. Specify priors and decision thresholds in advance and report sensitivity to reasonable priors.
How long should a Firebase A/B test run?+
Firebase recommends at least two weeks for a typical Remote Config experiment, enough sample for a useful result, and automatically stops result processing after 90 days. Your mature outcome and traffic may require a different planned window.
What does a non-significant result mean?+
It means the observed data did not cross the selected significance rule. It does not prove the variants are identical. Read the effect interval against commercially meaningful benefit and harm.
Can interviews replace an A/B test?+
Interviews and usability sessions reveal motivations, comprehension and failure mechanisms. They cannot alone estimate a population conversion lift, but they can reject broken ideas and improve the next behavioural test.
When should an experiment stop early?+
For a predefined safety threshold, corrupted implementation, planned futility rule or a valid sequential boundary. Do not stop a fixed-horizon test simply because a favourable result appears during repeated checking.
Sources
- Firebase — About Firebase A/B tests — Inference, assignment, activation events, duration, sample planning and BigQuery export.
- Firebase — Create Remote Config experiments — Official experiment setup workflow.
- Google Play — Store listing experiments — Native Play listing test controls and results.
- Apple — Product page optimization — Native App Store product-page tests.
- NIST — Engineering Statistics Handbook — Primary public reference for experimental design and statistical methods.
- Microsoft Research — Experimentation platform publications — Primary research collection on online controlled experiments.
- Firebase — Remote Config — Configuration delivery, targeting and rollout control.
- Google Analytics — BigQuery Export schema — Event-level export used to inspect experiment assignments and outcomes.
About the author
Amol Pomane — Founder, Vmobify
Amol leads Vmobify, a mobile app growth agency that has driven 30M+ downloads and ranked 54K+ keywords across 300+ apps since 2013. He writes about ASO, paid user acquisition, retention, and the operational reality of scaling mobile apps in India and global markets.