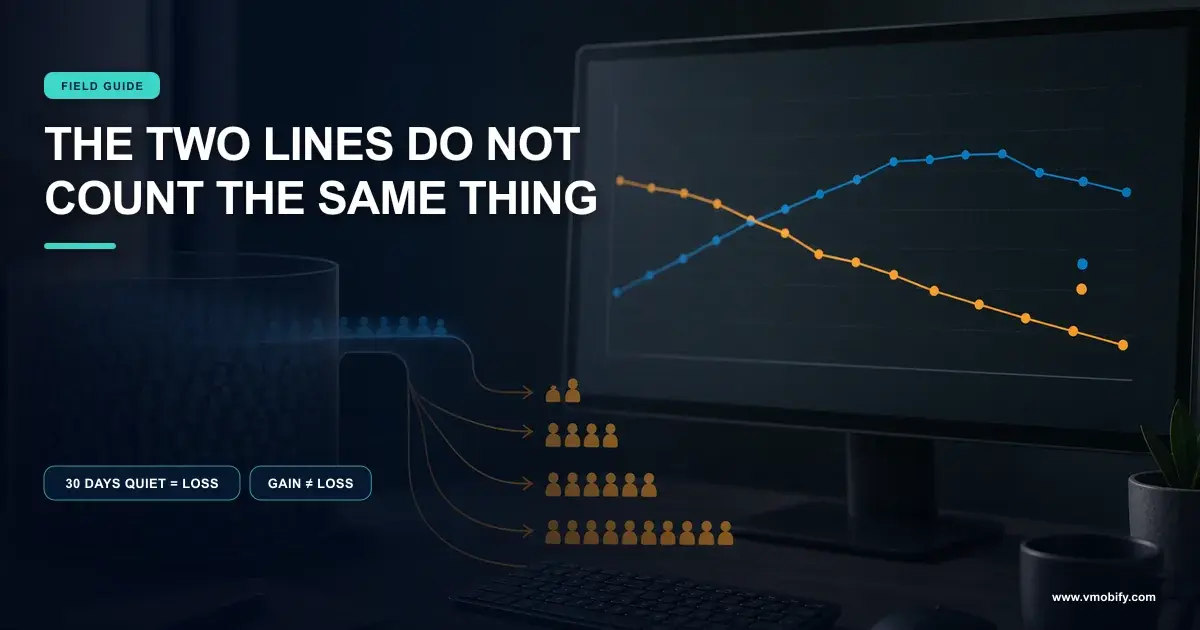
Crashes, ANRs and App Size: The Technical Reasons Users Uninstall
Your retention curve is falling and none of your product experiments move it. That is often because the churn is not a product problem at all — it is a crash concentrated on one handset, an ANR nobody reports, a cold start over five seconds, or a download too large to finish. Google documents thresholds for all four, and they are stricter than most teams assume.
On this page
- Which uninstalls are technical rather than product?
- What crash rate does Google treat as bad?
- Why do ANRs cost more than crashes?
- How slow is too slow to start?
- Does app size really cause uninstalls?
- What are the hard size limits on each store?
- Why does a single device model matter so much?
- What does technical churn look like in your data?
- How do you fix these in the right order?
- Frequently Asked Questions
Which uninstalls are technical rather than product?
The ones where the user never got far enough to form an opinion about your product. A crash on launch, a frozen screen, a five-second wait on a cold start, a download that never completed on a metered connection — in each case the app was removed before the value proposition was ever tested.
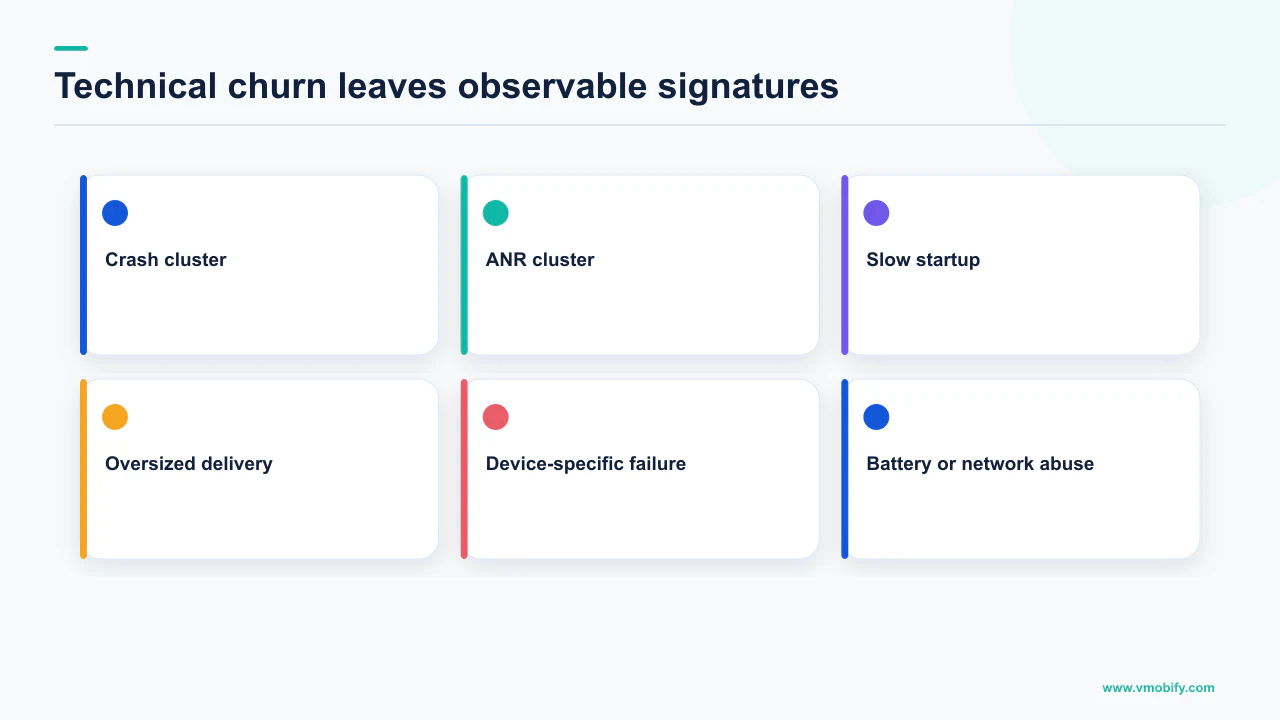
This distinction matters because it determines which team can fix the problem. A product-driven uninstall responds to onboarding changes, activation work and better messaging. A technical uninstall does not respond to any of that, which is why so many retention experiments come back flat and nobody can explain why.
Google is unusually explicit that this category exists. Its documentation on app startup time states that an app with a slow start time does not meet user expectations and can disappoint users, and that this sort of poor experience can cause a user to rate your app poorly on the Play Store or even abandon your app altogether. That is a platform owner naming abandonment as a direct consequence of a technical measurement.
There is no publishable figure for what share of uninstalls are technically caused. Neither Google nor Apple publishes one, no store-level dataset separates the two, and every percentage circulating on this topic traces back to a vendor sample rather than a platform source. We will not invent one. What is documented is the mechanism and the thresholds — and those are enough to diagnose your own app without a benchmark to compare against.
Across the 300+ apps we have managed since 2013, the pattern is consistent enough to state directionally: when a retention curve degrades suddenly rather than gradually, the cause is far more often technical than behavioural. Behaviour changes slowly. Releases change everything at once.
The rest of this article works through the four documented causes in the order Google treats them: crashes, ANRs, startup time and size. Each has a threshold, and each threshold has a distribution consequence attached to it.
What crash rate does Google treat as bad?
Google names two numbers: at least 1.09% of daily active users experiencing a user-perceived crash across all device models, and at least 8% on a single device model. Cross either and the consequence is not a warning email — it is your distribution.
The definition is narrower than the crash rate in your analytics tool. Google defines a user-perceived crash as the percentage of daily active users who experienced at least one crash while they were actively using your app, where active use means the app is displaying any activity or executing any foreground service. Background crashes are excluded. So are repeat crashes from the same user on the same day — this is a user-count metric, not an event-count metric.
The consequences are stated separately for each threshold. Exceed the overall threshold and your app is likely to be less discoverable on all devices. Exceed the per-device threshold and it is likely to be less discoverable on those devices, with a warning potentially shown on your store listing. Google's Android vitals documentation sets out both.
Read that as a compounding loss rather than a single penalty. The crash removes the user. The threshold breach then reduces how many replacement users the store sends you. And a listing warning suppresses conversion among the visitors you still receive. One defect is being charged three times, which is the argument we make in more detail in our piece on how bad vitals tax your acquisition.
The practical trap is averaging. A 0.9% overall rate looks comfortably inside the threshold and can still contain a device model sitting well above 8%. The overall figure is the one that reassures you; the segmented figure is the one that explains the churn. We cover the full threshold set in the vitals thresholds that decide distribution.
Why do ANRs cost more than crashes?
Because the threshold is roughly half as forgiving — 0.47% of daily active users against 1.09% for crashes — and because users almost never report them as a defect. An ANR is the quietest expensive problem in mobile.
Google defines the trigger conditions precisely. An ANR fires when your app has not responded to an input event such as a key press or screen touch within 5 seconds; when a service cannot finish executing its lifecycle callbacks within a few seconds; when an app that started a foreground service does not call startForeground within 5 seconds; or when a BroadcastReceiver has not finished within its allotted time, which is 5 seconds if the app has any activity in the foreground. The system then shows a dialog giving the user the opportunity to force quit.
Note what the user experiences. There is no crash report, no stack trace shown, no obvious moment of failure. There is a tap that did nothing, then a screen that stopped responding, then a system dialog offering to close the app. In a review this is written up as "slow" or "hangs" or "doesn't work" — vocabulary that reads as vague complaint and gets triaged as sentiment rather than as a defect with a five-second timer behind it.
User-perceived ANR rate is a core vital, which means it affects discoverability on Google Play exactly as the crash rate does. But its overall bad-behaviour threshold is 0.47% against 1.09% for crashes, and its per-device threshold is the same 8%. You are allowed less than half the freeze rate you are allowed crash rate — while receiving a fraction of the diagnostic signal.
The consequence for how you work is straightforward. Crashes announce themselves through your crash reporter; ANRs mostly do not, so they have to be pulled deliberately from Android vitals rather than waited for. In our portfolio, ANR regressions are the single most common cause of a retention drop that the product team cannot reproduce on their own handsets — because the main-thread work that blocks for five seconds on a mid-range device completes in under one on a flagship.
How slow is too slow to start?
Google defines excessive startup as 5 seconds or longer for a cold start, 2 seconds for a warm start and 1.5 seconds for a hot start. These are not aspirations. They are the points at which the platform's own documentation classifies your app as slow.
The measurement is Time to Initial Display. Google defines TTID as the time it takes to display the first frame of the app's UI, measuring the time an app takes to produce that first frame, including process initialisation during a cold start, activity creation during a cold or warm start, and displaying the first frame. It is deliberately a measure of when something appears, not when the app is usable — which means your real time-to-value is worse than your TTID, never better.
What TTID measures
- Time to the first frame drawn
- Process init on a cold start
- Activity creation
- Stops the clock early
What the user experiences
- Time until content is real
- Skeleton screens still count as waiting
- Spinners on first-run data fetches
- Always longer than TTID
Cold start is the one that decides uninstalls, because it is the state a new install is always in. The first launch after download is a cold start on a device that has never run your code, frequently over the same congested network that just delivered the download. If that path takes five seconds or more, Google's own documentation says the plausible outcomes include the user abandoning your app altogether.
Two failure patterns account for most of the excess we find. The first is initialisation work moved into application startup because it was convenient — SDK setup, analytics, remote config, feature-flag fetches — each individually small and collectively fatal on a mid-range handset. The second is a blocking network call on the first frame, which converts your startup time into your API's latency plus the user's connection quality, neither of which you control.
Startup time is not a core vital in the way crash and ANR rates are, so the distribution consequence is indirect. The retention consequence is not. A user who waits five seconds to see anything on first launch is deciding whether the app works at all, and our work on UX and retention covers what that first minute has to achieve.
Does app size really cause uninstalls?
Google states it directly: increasing your app's size can negatively impact install success and increase uninstalls. That sentence appears in Android's own size-reduction guidance, and it names both ends of the funnel in one clause.
The same page explains the mechanism plainly. Users often avoid downloading apps that seem too large, particularly in emerging markets where devices connect to spotty 2G and 3G networks or work on plans with data limits. Note the wording — apps that seem too large. The number on your listing does work before a single byte transfers, which makes size a store-conversion variable as much as an engineering one.
For an India-first product this stops being a footnote. A download measured in hundreds of megabytes on a metered connection is a purchase decision, and a partially completed one is worse than a refused one: it consumes the user's data, fails, and leaves nothing behind. There is no analytics event for that user, because they never reached your SDK.
Size also drives a second, slower loss that teams rarely attribute correctly. Every update repeats the download decision. An app that is uncomfortably large is an app users defer updating, then eventually remove during a storage clear-out — which surfaces in your data as an uninstall with no preceding session and no obvious trigger.
Google states the direction — larger size, worse install success, more uninstalls — but publishes no elasticity: no figure for how many installs a given number of megabytes costs. We will not manufacture one. What you can do is measure it on your own app, because size is one of the few variables you can change without changing the product, and your install-success rate by market is observable in Play Console.
The related failure mode is worth checking while you are here: when your uninstalls exceed installs in Play Console, size and stability are the first two places to look, ahead of anything in the product itself.
What are the hard size limits on each store?
Google Play enforces a compressed download size restriction of 200 MB for apps published with app bundles, and 100 MB for apps published as signed APKs. Apple's limits are structured entirely differently, which catches cross-platform teams out.
On Play, the restriction that bites is the compressed download, not the installed footprint. Google's guidance on reducing app size notes that larger sizes are possible using Play Feature Delivery and Play Asset Delivery, but immediately qualifies it: increasing your app's size can negatively impact install success and increase uninstalls, so the guidance is to reduce download size as much as possible regardless. There is a separate ceiling on the total install: Google's app bundle documentation states that when a user downloads your app, the total size of the compressed APKs required to install it must be no more than 4 GB, and that any subsequent on-demand module download must also meet the restriction.
Apple's maximum build file sizes reference works on uncompressed size and on the binary rather than the download. For apps targeting iOS 9.0 and later, the maximum uncompressed app size is 4 GB, with the total of all __TEXT sections in the binary limited to 80 MB. App Clips are constrained far more tightly — 100 MB uncompressed after app thinning for iOS 17 and later, 15 MB for iOS 16, and 10 MB before that.
These ceilings tell you what will be rejected, not what will be installed. The Play limits are the more instructive pair precisely because they are lower: they signal what the platform considers a reasonable download over a real connection. An app that has to reach for Play Asset Delivery to clear 200 MB is an app whose install-success rate is already a growth variable.
The reason to know both sets of numbers is that they lead to different engineering answers. Play rewards splitting by configuration and deferring modules; Apple rewards app thinning and keeping the binary's text sections lean. A single shared assets strategy usually optimises for neither.
Why does a single device model matter so much?
Because Google sets a per-device-model threshold of 8% for both user-perceived crashes and user-perceived ANRs, and breaching it on one handset can make you less discoverable on that handset with a warning shown on your store listing. Your aggregate can be healthy while a specific device is being actively suppressed.
The arithmetic is what makes this invisible. If a popular model accounts for a modest share of your daily active users and fails for most of them, the contribution to the overall rate may still sit under the 1.09% crash threshold. Nothing on your dashboard turns red. Meanwhile every user on that model is having a broken experience, rating you accordingly, and being served a store listing that now carries a warning.
This is the single most common diagnostic miss we see. A team looks at one overall number, finds it acceptable, and concludes the retention drop must be a product problem. The check that resolves it takes minutes:
- Open Android vitals and segment by device model for both user-perceived crash rate and user-perceived ANR rate, not the aggregate.
- Sort by rate, not by volume. The device that is failing hardest is rarely the device with the most users, which is why volume sorting hides it.
- Apply the 8% line per model, and treat anything approaching it as already costing you distribution on that device.
- Cross-check against your acquisition mix. If you recently expanded into a market where a specific handset dominates, a device-specific defect and a market expansion arrive in your data as the same curve.
- Check ratings by model too. A concentrated burst of one-stars from one device is the same defect wearing a different costume — the mechanism is in our piece on why an app rating drops.
Android's device diversity means this will keep happening. It is not a sign of a weak engineering team; it is a structural property of the platform, and the only defence is segmenting by default rather than segmenting after something goes wrong.
What does technical churn look like in your data?
Short sessions, an uninstall with no preceding engagement, a retention drop that starts on a release date, and reviews that describe speed rather than features. Technical churn has a distinct signature, and once you know it you stop misreading it as disinterest.
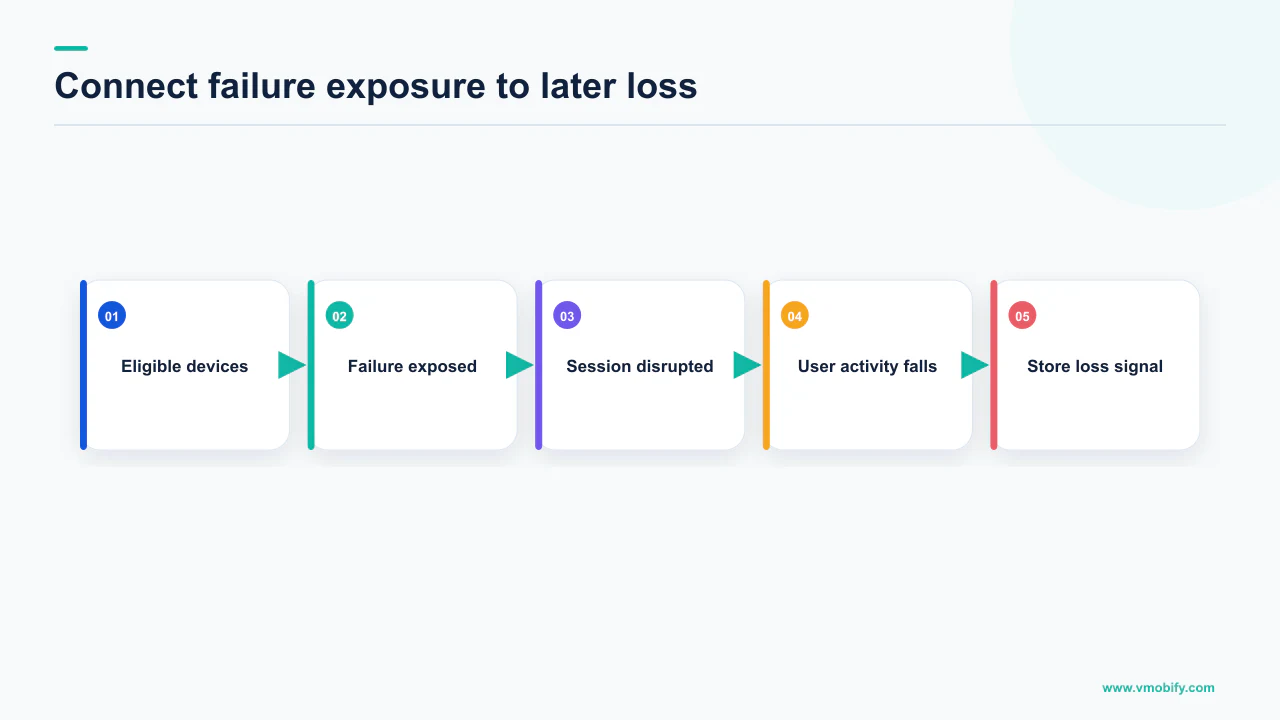
The clearest tell is timing. Product-driven churn is gradual and cohort-shaped: users try the app, do not find the value, and drift away over days. Technical churn arrives as a step change aligned to a rollout. If you can put a vertical line on your retention chart at a release date and see the curve bend, you are not looking at a positioning problem.
- Day-zero drop-off with sub-minute sessions. Users who install, open once briefly and never return did not evaluate your product. Something prevented them from reaching it.
- Uninstalls without a preceding session. These are storage clear-outs and deferred-update casualties, and they correlate with size rather than with anything you shipped.
- Reviews about speed, hanging and "not working". Vague-sounding complaints are usually ANRs and cold starts described by people without the vocabulary for them.
- A device-model or OS-version skew in the churn. Behaviour does not cluster by handset. Defects do.
- Install-success gaps by market. A market where installs start far more often than they complete is telling you about download size and connection quality, not about demand.
The instrumentation point that makes all of this legible is joining your vitals to your retention data rather than reviewing them in separate tools on separate days. Most teams have both and never put them on the same axis, which is the gap our analytics work usually closes first.
One caution on attribution. A technical fix does not recover the users it already lost — those installs are spent. What it recovers is the conversion of every future install, which is why the honest way to measure a stability fix is on new cohorts after the release, not on the aggregate curve that still contains the damaged ones. Our retention benchmarks guide covers reading cohorts properly.
How do you fix these in the right order?
Stability first, then startup, then size — because that is the order in which the platform penalises you and the order in which the fixes compound. Working in any other sequence means optimising a download for users your crash rate is already losing.
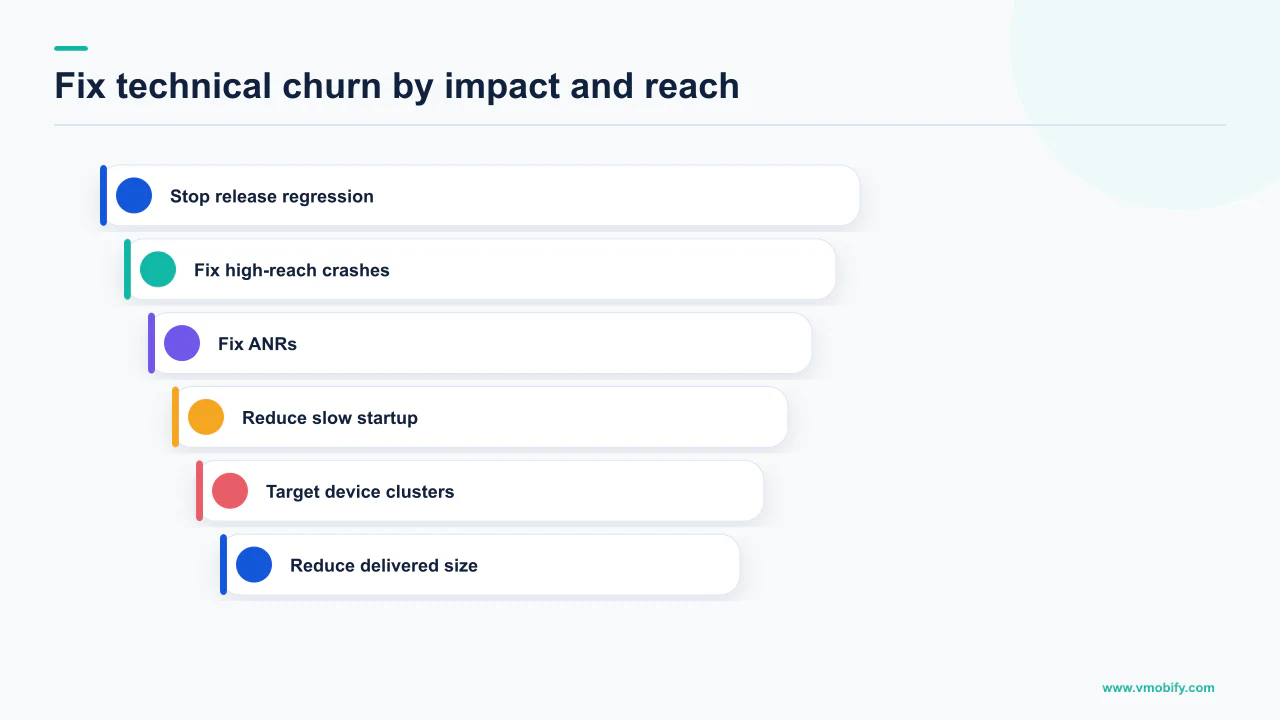
- Clear the core vitals thresholds. User-perceived crash rate under 1.09% overall and no device model near 8%; user-perceived ANR rate under 0.47% overall on the same per-device basis. These two are the only items on this list with a documented distribution penalty attached, so nothing else is worth doing while either is breached.
- Bring cold start under 5 seconds, then keep going. Five seconds is the point Google calls excessive, not a target. Move initialisation off the startup path and stop blocking the first frame on a network call.
- Measure your actual download size by market, not your build output. Configuration splits mean the number varies by device, and the number that matters is what a real user in your largest market is asked to download.
- Reduce size against install success, not against a limit. The 200 MB Play restriction is a ceiling, not a goal. Watch install-success rate in the markets where connections are worst.
- Use staged rollouts as the standing control. A regression caught at a small percentage of users costs you a handful of uninstalls; the same regression at full rollout is the step change on your retention chart.
- Re-baseline retention on post-fix cohorts only. Mixing damaged and clean cohorts hides the improvement and gets the work deprioritised at the next review.
The commercial framing that usually gets this prioritised is the double charge. Every technical uninstall wastes the acquisition cost that produced it, and a threshold breach then reduces the organic installs that would have partially offset that spend. You pay for the user twice and keep neither — which makes stability an acquisition line item, not just an engineering one.
If your retention curve moved and your product experiments cannot explain it, the fault tree in this article is usually a same-day diagnosis for someone who has run it before. Send us the vitals and the release dates, or see how we join performance data to growth data across a portfolio in our client results.
Frequently Asked Questions
What crash rate is too high for Google Play?+
Google defines two bad behaviour thresholds. At least 1.09% of daily active users experiencing a user-perceived crash across all device models, and at least 8% for a single device model. Exceed the overall threshold and your app is likely to be less discoverable on all devices; exceed the per-device threshold and it is likely to be less discoverable on those devices, with a warning potentially shown on your store listing.
Why is the ANR threshold stricter than the crash threshold?+
Google sets the overall user-perceived ANR threshold at 0.47% of daily active users against 1.09% for crashes, with the same 8% per-device threshold. Both are core vitals affecting discoverability. The practical difficulty is that an ANR produces a system dialog offering to force quit rather than a crash report, so it rarely appears in your crash tooling and has to be pulled from Android vitals deliberately.
How fast should my app start?+
Android vitals treats a cold start of 5 seconds or longer as excessive, along with 2 seconds for a warm start and 1.5 seconds for a hot start, measured as Time to Initial Display. Treat those as the failure line rather than the target, since TTID measures only the first frame drawn and your real time to usable content is always longer.
Does a large app size actually increase uninstalls?+
Google says so directly in its size reduction guidance: increasing your app size can negatively impact install success and increase uninstalls. It also notes that users often avoid downloading apps that seem too large, particularly in emerging markets with spotty 2G and 3G connections or data-limited plans. No platform source publishes a figure for how many installs a given number of megabytes costs, so measure it on your own install-success rate by market.
What is the maximum app size on Google Play and the App Store?+
Google Play enforces a compressed download size restriction of 200 MB for apps published with app bundles and 100 MB for signed APKs, with the total compressed size required to install capped at 4 GB. Apple limits an iOS 9.0 or later app to 4 GB uncompressed, with the text sections in each architecture slice limited to 80 MB. App Clips are far tighter at 100 MB uncompressed for iOS 17 and later.
What proportion of uninstalls are caused by technical problems?+
There is no publishable figure. Neither Google nor Apple separates technical from product-driven uninstalls in any store-level dataset, and the percentages circulating on this topic trace back to vendor samples rather than platform sources. What is documented is the mechanism and the thresholds, which is enough to diagnose your own app without a benchmark.
How do I tell technical churn from a product problem?+
Look at the shape and the timing. Technical churn arrives as a step change aligned to a release date, with sub-minute first sessions, uninstalls that follow no session at all, reviews complaining about speed or hanging rather than features, and a skew by device model or OS version. Behaviour does not cluster by handset; defects do.
Sources
- Google Play — Monitor your app technical quality with Android vitals — The 1.09% crash, 0.47% ANR and 8% per-device bad behaviour thresholds and their discoverability consequences.
- Android Developers — App startup time — Excessive startup at 5s cold, 2s warm and 1.5s hot, the TTID definition, and the stated link to poor ratings and abandonment.
- Android Developers — ANRs — The five-second input dispatch and foreground service timeouts, the force-quit dialog, and ANR rate as a core vital.
- Android Developers — Crashes — Definition of a user-perceived crash as active-use only, and the overall and per-device thresholds.
- Android Developers — Reduce your app size — States that increasing app size can negatively impact install success and increase uninstalls, plus the 200 MB and 100 MB download restrictions.
- Android Developers — Android App Bundle — The 4 GB cap on the total compressed APKs required to install, applying to on-demand module downloads as well.
- Apple — Maximum build file sizes — iOS 9.0 and later capped at 4 GB uncompressed with 80 MB covering the total of all __TEXT sections in the binary, and the App Clip limits.
About the author
Amol Pomane — Founder, Vmobify
Amol leads Vmobify, a mobile app growth agency that has driven 30M+ downloads and ranked 54K+ keywords across 300+ apps since 2013. He writes about ASO, paid user acquisition, retention, and the operational reality of scaling mobile apps in India and global markets.