Where Your Installs Actually Come From
Your ad platform claims one install number, Play Console shows another, and App Analytics shows a third. None of them are lying. Each store counts a different event, at a different moment, for a different population of users, and once you know which event each report is actually counting the three numbers stop contradicting each other.
On this page
- Which install did you actually count?
- What do Play’s channel names actually mean?
- Why do installs appear with no store listing visit?
- What does Apple actually tell you about sources?
- Why will Play and Apple never agree?
- What does the install referrer add?
- Is search really better than explore?
- How do you read a channel mix that moved?
- What should you build into reporting?
- Frequently Asked Questions
Which install did you actually count?
Before you argue about which channel deserves credit, establish which event each report is counting — because the three systems on your desk are counting three different things. Almost every "our numbers do not match" conversation ends here rather than in a discrepancy investigation.
There are at least four distinct events a dashboard might call an install, and they occur at different moments to different populations:
- A store listing visit. Someone saw your product page. No install has happened yet.
- A first-time install by a user who visited that listing. This is what Google Play attributes to a channel.
- A device-level install or redownload. The same person on a second device, or a returning user who had uninstalled.
- An attributed install claimed by an ad network. A click or view your measurement partner matched to a device.
Google is explicit about which of these its acquisition reporting uses. Its documentation defines store listing visitors as "the number of users that visited your Store Listing who didn't already have your app installed on any of their devices", and store listing acquisitions as "the number of users who visited your Store Listing and installed your app, who didn't have it installed on any other devices at the time".
Read that twice. Both metrics are user-level, not device-level, and both exclude anyone who already had the app anywhere. A user who reinstalls on a new phone is not a store listing acquisition. Your MMP, meanwhile, is usually counting devices. Two systems, two units, and a permanent gap that no reconciliation exercise will ever close.
Play counts users who did not already have the app on any device. Ad platforms count devices, or clicks matched to devices. These are not the same denominator and never will be. Set the expectation with your board before you set the target, or you will spend every month explaining the same variance.
Across the 300+ apps we have managed since 2013, the most expensive reporting mistake is adding channel numbers from different systems together. Pick one system as the source of truth for mix and use the others only for direction.
What do Play’s channel names actually mean?
Play Console splits acquisition into a small set of named channels, and the definitions are narrower than the names suggest. Most teams read "explore" as "browsing" and "referral" as "our marketing", and both readings are wrong in ways that change decisions.
Google's acquisition reports documentation defines them individually. Play Store search covers "unique users who found your app on Google Play from search results". Play Store explore covers "unique users who found your app on Google Play but not from search results (for example, browsing a category or similar apps cards)". Third-party referrers means "unique users who visited your app's store listing on the Play Store app from an untagged deep link to the Play Store". Tracked channels (UTM) means "unique users who visited your app's store listing on the Play Store app from a UTM-tagged link".
Play Store search
- Found you from search results
- Includes brand searches for your own name
- Responds to keyword and metadata work
- Not a pure demand signal
Play Store explore
- Found you on Play, but not via search
- Category browsing, similar apps, collections
- Driven by ranking, ratings and relevance
- The channel you influence least directly
Two consequences follow immediately. First, the difference between third-party referrers and tracked channels is not the difference between someone else's traffic and yours — it is purely whether the link carried UTM parameters. Your own untagged website button lands in third-party referrers alongside a blog post you have never heard of. If your referral bucket is a mystery, the fix is tagging discipline, not analysis.
Second, explore is not a marketing channel you can buy. It is the store deciding to show you next to something else, which makes it a lagging indicator of ranking, ratings and relevance rather than an input you control. Teams that set an explore target are setting a target on someone else's algorithm. Our guide to ASO for new apps covers what actually moves that surface.
Why do installs appear with no store listing visit?
Because Play has a documented bucket for exactly that, and it is usually the bucket that breaks a naive conversion-rate calculation. Google defines installs without store listing visit as "Unique users who installed your app without seeing your store listing or had the app pre-installed. Includes some installs directly from search results, Play Store on the web, and installs available outside of your store listing. Excludes sideloads."
The second sentence is the part that gets dropped when this definition is quoted, and it changes the reading entirely. Google names installs directly from search results and installs from Play Store on the web as routine members of this bucket. Those are ordinary discovery surfaces, not exotic ones — a user can install straight from a search result without your product page ever rendering. Sideloads are excluded outright.
The practical damage is arithmetic. If you compute conversion rate as installs divided by store listing visitors, and a meaningful share of your installs never had a visit, your conversion rate is inflated by a population that was never converted by the listing at all. Play's own store listing metrics avoid this by defining acquisitions as users who visited and installed, which is why the console's conversion figure and your spreadsheet's conversion figure diverge.
Pull the no-visit bucket as a share of total installs. If it is anything other than negligible, exclude it from every conversion calculation you present, and say so on the slide. A conversion rate that silently includes users who never saw the page is not a listing metric.
There is a growth read here too. A large no-visit bucket that you did not arrange is worth understanding rather than alarming, because Google documents ordinary surfaces inside it — installs from search results and from Play Store on the web. The question is which of those surfaces it is, not whether something uncontrolled is happening. A large no-visit bucket that you did arrange, such as a pre-install deal, needs to be reported separately from organic, because its retention curve is usually nothing like your organic curve. We look at that split in why installs drop overnight, where an unnoticed change in this bucket is a recurring cause.
What does Apple actually tell you about sources?
Apple reports acquisition by source, but publishes far less definitional detail than Google does — and the data itself comes from a subset of users. Both facts change how much weight an App Analytics source split can carry.
Apple's overview of reporting tools states that App Analytics lets you "find out which sources drive the most traffic to your app's product page" and calculate conversion rate, described as "the number of people who view your app's product page to total downloads and pre-orders of your app".
The critical caveat is on the same page. App Analytics "provides app developers with usage data collected from users who have agreed to share their diagnostics", on iOS 8 and later, macOS 11 and later, tvOS 9 and later and visionOS 1 and later. Apple also notes that "to protect user privacy, App Analytics only shows data after a certain number of data points are available", and that App Analytics does not include data from watchOS.
App Analytics is a sample of consenting users, not a census. It is excellent for comparing sources against each other and for reading trend direction. It is the wrong input for anything that needs an absolute count — use Sales and Trends for that, and never mix the two in one calculation.
Apple's custom product pages documentation describes what the Acquisition tab exposes: "product page impressions, downloads, redownloads, and conversion rates to understand how effective each page is at encouraging app downloads", alongside retention data and average proceeds per paying user per page. That is the practical shape of Apple's acquisition reporting — impressions in, downloads out, split by the page and the source that produced them.
What Apple does not publish, in documentation we could open and verify, is a formal per-source definition list of the kind Google provides. We are not going to print definitions we cannot source. Treat the App Store source labels as directional groupings, read them relative to each other, and do not build a commercial model on a definition you inferred from a chart legend.
Why will Play and Apple never agree?
Because they use different units, different populations, different time zones and different treatment of redownloads — so a cross-store comparison is a category error before it is a data problem.
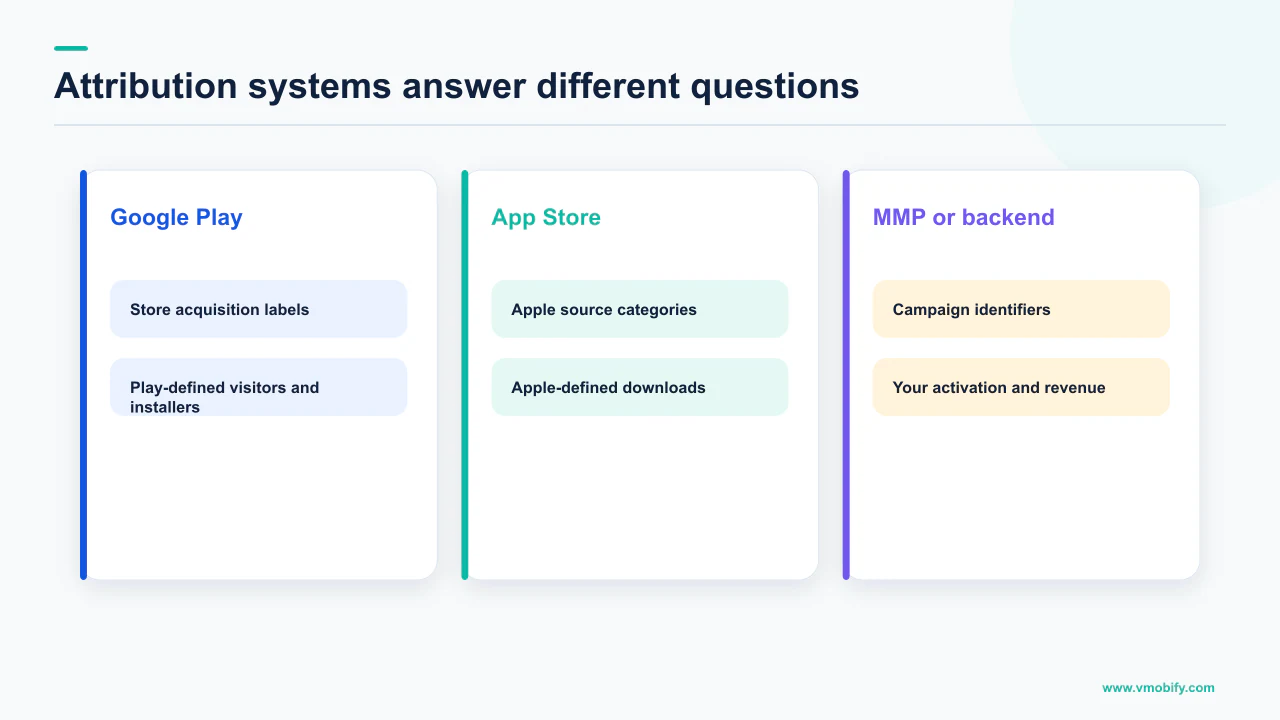
Start with population. Play's acquisition metrics count unique users who did not already have the app on any device. Apple's App Analytics counts users who agreed to share diagnostics. One is a filtered census, the other is a consenting sample. There is no adjustment factor that reconciles them, and anyone selling you one is guessing.
Then timing and definitions. Apple's comparison of its own two reporting tools shows how sharp these edges are even inside one company: "App Analytics data is based on Coordinated Universal Time (UTC). By default, Sales and Trends data is shown in UTC, but you can change the timezone to Pacific Time (PT)." It also notes that "App Analytics excludes Restores (where a user restores an app to their device from a backup) in the Redownloads metric, while Sales and Trends includes Restores in its Redownload count", excludes sales metrics from TestFlight builds, and excludes sales or redownloads on watchOS.
If Apple's two internal tools disagree on restores, TestFlight and time zones, expecting Apple and Google to agree is optimistic.
The operational rule we use in our portfolio is simple. Compare each store to itself over time, never to the other store in absolute terms. Cross-store comparisons are legitimate for direction — is search share rising on both? — and illegitimate for arithmetic. The same discipline applies to ad platform versus MMP gaps, which we unpack in why Meta and your MMP disagree.
What does the install referrer add?
On Android it gives you the referrer string on the device itself, which is the only source-of-install signal your own code can read directly rather than inheriting from a dashboard. If your channel mix is a mystery, this is where you stop guessing.
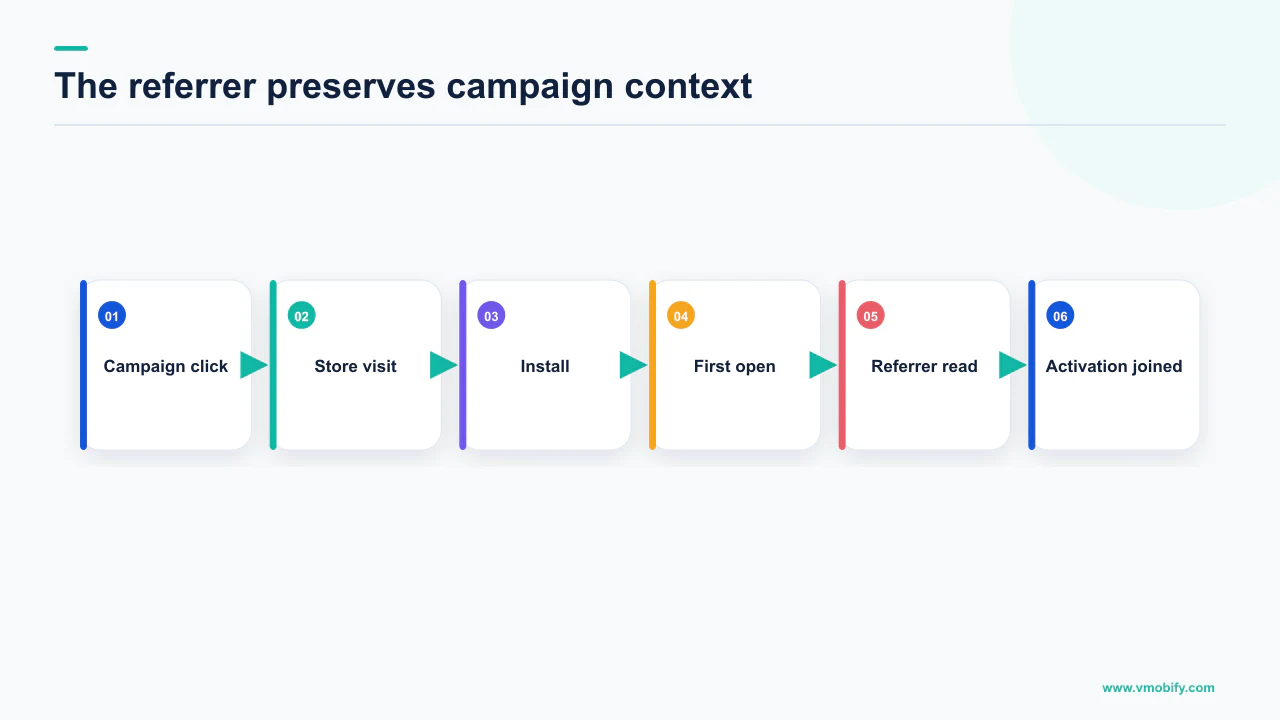
The Play Install Referrer Library returns the install referrer URL along with a referrer click timestamp, an install begin timestamp and a Google Play Instant parameter. That gives you the tagged source, the moment of the click and the moment the install began, all readable inside your app on first run.
Two constraints in Google's own words shape how you use it. The documentation cautions that "the install referrer information will be available for 90 days and won't change unless the application is reinstalled", and that "to avoid unnecessary API calls in your app, you should invoke the API only once during the first execution after install".
- Call it once, on first run, and persist the result. Not on every launch, and not lazily when a growth question comes up three months later — by then the window may have closed.
- Store the raw referrer string, not your parsed interpretation of it. Your parsing rules will change; the string will not.
- Keep both timestamps. The gap between click and install begin is one of the more honest signals you have about whether an attribution claim is plausible.
- Tag every link you control. An untagged link lands in Play's third-party referrers bucket and arrives at your app with nothing useful attached.
- Reconcile against the console monthly, not daily. Daily variance will consume your analyst and tell you nothing.
The referrer is also the cheapest fix for the most common reporting complaint we hear, which is that a large share of installs is unattributed. Frequently the traffic was never tagged in the first place — a website button, a partner link, an influencer post that someone pasted without parameters. That is a process failure, not an attribution failure, and it costs nothing to fix going forward. Our detailed walkthrough is in the Play install referrer guide; the wider measurement picture sits in our mobile attribution guide.
Is search really better than explore?
It is more controllable, which is not the same as more valuable — and the honest answer for your app is a number we cannot publish because it does not generalise. Anyone quoting you a universal search-versus-explore quality ratio is quoting a benchmark that does not exist in either store's documentation.
What is defensible is the structural difference. Search traffic arrives with intent you can partly infer, and it responds to work you control: title, metadata, category, and the ratings and reviews that feed relevance. Apple states plainly that search ranking uses text relevance and customer behaviour including downloads and the number and quality of ratings and reviews. Explore traffic arrives because an algorithm placed you next to something else, which you influence only through the same underlying quality signals, at a longer lag.
The trap is brand search. A user who searched your exact app name in the store was almost certainly sent there by something else — an ad, a video, a friend, your website. That install lands in the search bucket, and if you attribute it to your keyword work you will conclude that ASO is outperforming the channel that actually created the demand. Google's separate naming of Play Store search, Google Search (organic), Google Ads and tracked channels makes this visible, but only if you look at the split rather than the total.
Split search into brand and non-brand before you judge any ASO programme. Non-brand search is the part your metadata earned. Brand search is largely demand your other channels created and the store merely fulfilled. Reporting them as one number will over-credit ASO during a paid push and under-credit it when spend stops.
On the value side, Apple does publish one figure worth knowing, tied to page treatment rather than to source: it states that developers "see a 2.5 percentage point increase on average when referring people to a custom product page", describing this as "a 156% increase compared to the 1.6% average conversion rate on default product pages". That is Apple's own reported average across its developer base, not a promise about your app, and it is a page-relevance finding rather than a channel-quality one. We cover the mechanics in custom product pages.
The reason we will not print a search-versus-explore quality multiplier is straightforward: neither store publishes one, our own portfolio range is far too wide to average honestly, and a made-up ratio would get planted in someone's budget model. Measure it in your own retention data instead — that is the only version of the number that is true.
How do you read a channel mix that moved?
Work from the definitions outward, in a fixed order, because most sudden mix changes are reporting changes rather than demand changes. The order matters — the cheap explanations sit at the top and they are right more often than the expensive ones.
- Did the total move, or only the mix? A flat total with a redistributed mix is almost always a tagging or classification change. Check this before anything else.
- Did anyone change a link? A UTM parameter added or removed moves traffic between tracked channels and third-party referrers instantly, with no change in user behaviour whatsoever.
- Did paid spend start, stop or shift? Paid activity inflates brand search, so a spend change moves the organic search bucket in a way that looks like an ASO result and is not.
- Did the no-visit bucket change? A pre-install arrangement or a distribution deal beginning or ending shows up here, and it distorts every conversion rate downstream.
- Did explore fall while search held? That pattern points at ranking, ratings or a relevance change rather than at anything you did to your listing copy.
- Only then look for a product or store cause, such as a rejected update, a metadata change or a category move.
Give each step a date and line it up against the mix chart. A single-day step change is a configuration event. A gradual drift over a fortnight is an algorithmic or competitive one. The shape of the change tells you which family of causes to search before you read a single review.
The India-specific version deserves a mention, because we see it constantly. Where volume comes from OEM stores, pre-install deals or regional partnerships, a mix shift often reflects a commercial arrangement changing rather than user behaviour. Nobody tells the growth team when a distribution contract ends; the acquisition report notices first.
One more discipline: write down what you expected each channel to do before you make a change, then compare. Without a prior, every mix chart is readable as a success by someone motivated enough, and post-hoc channel narratives are the most reliably wrong artefacts in mobile growth.
What should you build into reporting?
A small, stable set of definitions that everyone in the company uses, plus the raw fields needed to rebuild any number from scratch. Most reporting problems are definition problems that hardened into dashboards before anyone questioned them.
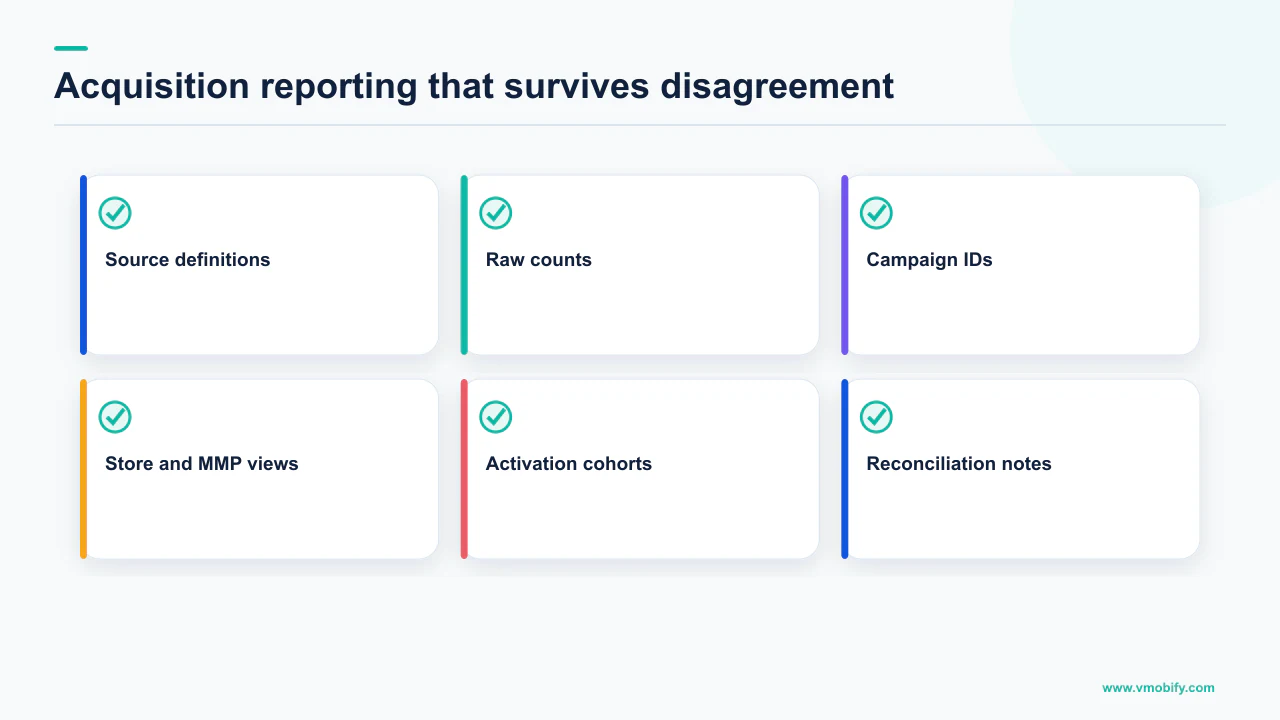
The minimum we would put in place for any app we take on:
- One named source of truth per question. Store console for channel mix, MMP for paid attribution, your own backend for retention and revenue. Written down, with the owner's name against it.
- Conversion rate defined against visitors, not total installs. Exclude the no-visit bucket explicitly and state that you have.
- Brand and non-brand search reported separately, for the reasons above.
- Raw install referrer strings stored on first run, unparsed, alongside both timestamps.
- Every owned link tagged, with a naming convention that survives the person who invented it leaving.
- Cross-store comparisons restricted to direction, never to absolute totals.
Google's store performance documentation is worth reading in full alongside this, because its channel groupings — Google Play search, Google Play explore, ads and referrals, and a not-attributed bucket for cases with insufficient information to determine the source — are the vocabulary your team should be using rather than inventing local synonyms for. Play Console also exposes programmatic exports of this data, which is what you want once the question outgrows the console UI.
Note that last category honestly. There is a bucket for traffic the store cannot classify, and it is not a defect to be eliminated. Some share of your installs will never be attributable, and a reporting culture that refuses to accept this is a reporting culture that will eventually accept a fabricated number instead.
The payoff for all of this is not tidier dashboards. It is that budget decisions stop being arguments about whose number is right. When the definitions are fixed, a mix change becomes a question with an answer rather than a debate with a winner. Once that is stable, the listing work itself is what moves the rate — see our guide to store listing conversion, or how we structure the whole programme in our ASO work.
If your channel mix moved and you cannot tell whether it was demand, tagging or a distribution change, that is usually a short diagnosis for someone who has seen the pattern before — tell us what the mix chart is doing.
Frequently Asked Questions
What is the difference between Play Store search and Play Store explore?+
Google defines Play Store search as unique users who found your app on Google Play from search results, and Play Store explore as unique users who found your app on Google Play but not from search results — for example browsing a category or similar apps cards. Search responds to metadata work; explore is largely the store placing you next to something else.
Why does Play Console show installs with no store listing visit?+
Google defines that bucket as unique users who installed your app without seeing your store listing or had the app pre-installed, and adds that it includes some installs directly from search results, Play Store on the web, and installs available outside your store listing, while excluding sideloads. Those users never saw your product page, so including them in a conversion-rate calculation inflates the result. Report the bucket separately and exclude it from listing conversion.
Why do Play Console and my ad platform disagree on installs?+
They count different units for different populations. Play counts unique users who did not already have the app on any device; ad platforms and measurement partners generally count devices or clicks matched to devices. There is no adjustment factor that makes the two equal, so pick one system as the source of truth for mix and use the other for direction.
Is App Analytics a complete count of my App Store downloads?+
No. Apple states App Analytics provides usage data collected from users who have agreed to share their diagnostics, and that to protect user privacy it only shows data after a certain number of data points are available. It also excludes watchOS data. Use it to compare sources and read trends, and use Sales and Trends when you need absolute figures.
How long is the Google Play install referrer available?+
Google states the install referrer information will be available for 90 days and will not change unless the application is reinstalled, and advises invoking the API only once during the first execution after install. Read it on first run and persist the raw string rather than fetching it later.
Is search traffic higher quality than browse traffic?+
It is more controllable, which is not the same thing. Neither store publishes a quality ratio between the two, and our own portfolio range is too wide to average honestly, so we do not print a figure. Measure it in your own retention and revenue data by source, and split brand from non-brand search before you draw any conclusion.
My channel mix changed overnight. Where do I start?+
Check whether the total moved or only the mix. A flat total with a redistributed mix is almost always a tagging or classification change — a UTM parameter added or removed moves traffic between tracked channels and third-party referrers with no change in user behaviour. Then check paid spend changes, then the no-visit bucket, and only then look for a product cause.
Sources
- Google Play Console Help — Acquisition reports — Definitions of Play Store search, explore, tracked channels (UTM), third-party referrers, Google Ads and installs without a store listing visit.
- Google Play Console Help — Understand and grow your app’s user base — Store listing visitors and acquisitions definitions, click-through rate, app install state, and the store performance channel groupings including a not-attributed bucket.
- Google Play Console Help — Download and export reports — Programmatic exports of acquisition and store performance data, including traffic source and UTM breakdowns.
- Android Developers — Play Install Referrer Library — Referrer URL, referrer click and install begin timestamps, the Instant parameter, the 90-day availability window and the call-once guidance.
- Apple — Overview of reporting tools (App Store Connect Help) — App Analytics measures which sources drive product page traffic; data comes from users who agreed to share diagnostics and is only shown above a data-point threshold.
- Apple — Differences in reporting tools (App Store Connect Help) — UTC basis for App Analytics, exclusion of restores from redownloads, TestFlight and watchOS exclusions versus Sales and Trends.
- Apple — Custom product pages — What the App Analytics Acquisition tab exposes per page, and Apple’s reported 2.5 percentage point average conversion increase against a 1.6% default product page average.
- Apple — App Store discoverability — Search, category browsing, Today tab and editorial as distinct discovery surfaces, and the stated ranking inputs for App Store search.
About the author
Amol Pomane — Founder, Vmobify
Amol leads Vmobify, a mobile app growth agency that has driven 30M+ downloads and ranked 54K+ keywords across 300+ apps since 2013. He writes about ASO, paid user acquisition, retention, and the operational reality of scaling mobile apps in India and global markets.
Check your store metadata
Run your current App Store or Play metadata through the free checker.
Open free tool