Diminishing Returns: Why CPI Rises When You Scale
You doubled the budget and the cost per install went up, so someone concluded the campaign is broken. It usually is not. Audience depth is finite, a tighter target narrows the pool you are allowed to buy from, and the edits people make in a panic cost more than the saturation they were meant to fix.
On this page
- Is a rising CPI actually a failure?
- What is actually getting more expensive?
- Why does a tighter target buy fewer installs?
- How much budget does the system need to work at all?
- Why do your own edits make the curve look worse?
- Does changing the target restart the learning period?
- Where is the extra volume supposed to come from?
- How do you tell saturation from a broken campaign?
- What should you actually do when CPI rises?
- Frequently Asked Questions
Is a rising CPI actually a failure?
Almost never. A cost per install that climbs as you spend more is the expected shape of a finite audience being bought deeper, and treating it as a defect is how teams turn a normal curve into a real problem.
The conversation always arrives the same way. Spend was ₹4 lakh a month and the CPI was comfortable. Spend is now ₹12 lakh a month and the CPI is meaningfully higher. Nobody changed the creative, the geography or the product, so somebody concludes the network is degrading, the account has been throttled, or the agency has stopped trying.
None of those is usually true. What changed is which users you are now reaching. At the smaller budget the system was buying the people most likely to install — the cheapest, most obvious matches. At three times the budget it has exhausted those and is buying progressively less obvious ones, because there is no other place for the money to go. The unit cost rises for the same reason the second half of any queue is slower to serve than the first.
Diminishing returns and breakage look identical on a CPI chart. They are separated by whether volume rose alongside cost. If you spent 3x and got 2.4x the installs at a higher CPI, the campaign is working and saturating. If you spent 3x and got 1.1x the installs, something is wrong and the rest of this article is about finding it.
Across the 300+ apps we have managed since 2013, the single most expensive mistake in this situation is not the higher CPI. It is the sequence of emergency edits that follows it — target cuts, budget reversals, exclusions — which reliably makes the next fortnight worse than the saturation ever was. The rest of this piece works through why, using the platforms' own documentation.
One honest caveat before we go further: we will not print a CPI curve, a saturation threshold, or a benchmark for how much CPI “should” rise per doubling of budget. Those figures vary by vertical, geography, creative and season, and no platform publishes them. Any number you see quoted for this is someone's sample presented as a law. We would rather give you the mechanism and let you measure your own curve.
What is actually getting more expensive?
Not the install. The marginal install — the next one, bought from a person who was less likely to install than everyone the system already reached. Averages hide this completely, which is why the reported CPI is a poor tool for the decision you are trying to make.
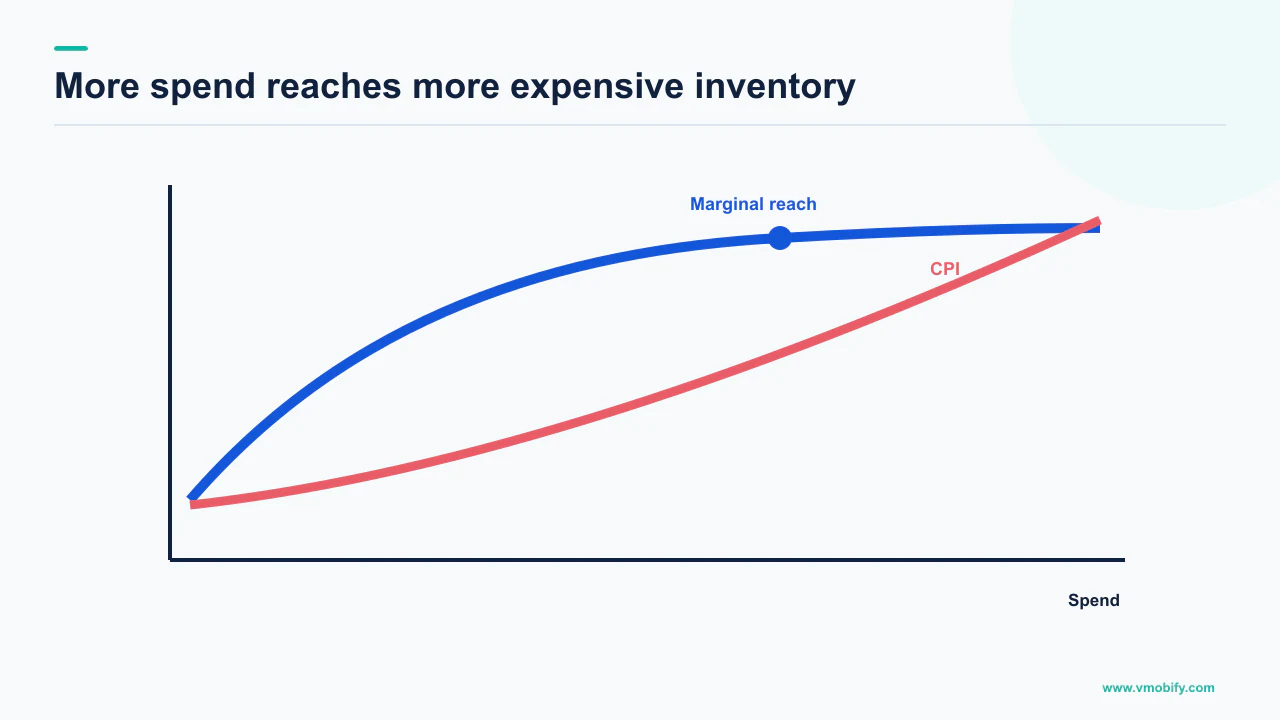
Think about what your reported CPI actually is: the blended average of every install in the period, cheap and expensive together. When you add budget, the new spend buys the expensive tail while the cheap head keeps flowing, so the blended number moves gently even when the marginal cost has moved sharply. By the time your average CPI looks alarming, the marginal install has usually been uneconomic for some time.
Average CPI
- Total spend divided by total installs
- What every dashboard reports
- Moves slowly and lags reality
- Useless for deciding whether to add the next tranche of budget
Marginal CPI
- Cost of the installs the extra budget bought
- Computed by differencing two stable periods
- Moves first and moves hard
- This is the number the scaling decision depends on
You can approximate the marginal figure without any special tooling. Take a stable period before the increase and a stable period after it, subtract the spend and subtract the installs, and divide. It is crude and it is contaminated by seasonality, and it is still far more informative than a blended average. Google's own bid, budget and target simulators exist to answer a version of this question from historical data — they estimate the clicks, cost, impressions, conversions and conversion value your ads would have received under different bids, and App campaigns are among the supported types.
The commercial consequence is that a rising average CPI is not automatically a reason to stop. It is a reason to check whether the marginal install still clears your payback requirement. Some businesses can afford a substantially worse marginal cost because the cohort still pays back inside the window; others cannot afford a slightly worse one. That test is arithmetic about your own economics, and we have written it out in how to set a UA budget against cash payback and the ROAS and CAC guide.
Why does a tighter target buy fewer installs?
Because the target is not a discount you apply to the same inventory — it defines how much of the inventory you are eligible to buy at all, and Google says so directly for the value-based case. This is the mechanism that makes the instinctive fix backfire.
Google's page on bidding in App campaigns states it plainly for target ROAS: “A higher ROAS target will narrow the pool of potential installs, whereas a lower ROAS target will typically enable the campaign to have more potential to scale.” Read that as the general shape of the trade. Tighter economics, smaller pool. Looser economics, more room to scale.
The same page describes what a bid means in the first place: “When you set your bid, you're telling Google Ads the average amount you'd like to spend each time someone installs your app.” An average, not a ceiling.
Google is equally direct about the failure mode on the cost-per-action side. Its guidance on fixing low traffic for Target CPA bidding notes that if your target CPA is significantly below your historical average CPA, the target “may not be attainable while maintaining reasonable levels of traffic”, and that where the target is too low you should consider raising it.
CPI rises, so the target is cut to force it back down. The tighter target narrows the eligible pool, so volume falls. Falling volume is read as further evidence the campaign is broken, so the target is cut again. Three weeks later the campaign is delivering a fraction of its former volume at a CPI that never actually improved, and the cause is entirely self-inflicted.
None of this means a target cut is always wrong. It means a target cut is a decision to buy less, priced in volume, and it should be taken deliberately rather than as a reflex to a chart. If the marginal install genuinely does not pay back, buying less is correct — just be honest that reduced volume is the intended outcome, not a side effect to be fixed later.
How much budget does the system need to work at all?
Google publishes a specific ratio for App campaigns: set your average daily budget at 50 times your target CPI, or 10 times your target CPA. Campaigns funded below that line behave badly in ways that are easily mistaken for saturation.
That figure comes from Google's tips for maximising your App campaign, which also advises ensuring you have enough budget allocated to allow your campaign to grow. It is worth working out what it implies before you diagnose anything else.
The practical reading is that the multiplier is smaller for event optimisation than for install optimisation — 10 times the target CPA against 50 times the target CPI — so per unit of target, an event-optimised campaign is asked for less budget, not more. What does not shrink is the number of conversions the system needs to learn from, which is why an event campaign can clear the budget ratio and still starve. Because the event is rarer and the system needs a workable number of them each day to learn from. Teams that switch a campaign from install optimisation to event optimisation without revisiting the budget are, by Google's own ratio, underfunding it — and the resulting thin, erratic delivery gets filed as saturation when it is starvation.
The same page is explicit about the other half of the setup: “Avoid restricting your campaign's audience by excluding too many locations, placements, mobile categories, or by using other targeting options.” Every exclusion is a piece of the pool removed, and a heavily excluded campaign hits its ceiling earlier than the market required it to. This is the most common self-inflicted saturation we find in accounts we inherit — the campaign is not out of audience, it is out of permitted audience.
If your campaign is underfunded rather than saturated, the symptom set is different and worth ruling out separately. We cover it in why a Google App campaign is not spending its budget.
Why do your own edits make the curve look worse?
Because Google asks you not to move budget or CPI by more than 20% at a time, and because bid strategy changes put the campaign into a learning period that can run up to three weeks or one to two conversion cycles. A fortnight of panic edits guarantees you never observe a stable state.
The wording on the App campaign tips page is direct: “Try not to make drastic changes to your campaign, for example, changing the budget by >20%, or changing your CPI by >20%.” The same page notes that App campaigns can take a few days to start gathering information, and that in the first few days — or even weeks — of a campaign, the CPI may be inflated, so an early high CPI should be read with conversion delays in mind.
The learning period itself is documented separately. Google's page on the duration of the learning period states: “It can take up to 3 weeks or 1-2 conversion cycles for the bid strategy to calibrate to the new objective, although it can be faster depending on the amount of conversion data present.” It lists what puts a bid strategy into the Learning status, including a bid strategy that was recently created or reactivated, a setting for the bid strategy being changed, and campaigns, ad groups or keywords being added or removed. The factors affecting how long it lasts are the number of conversions obtained, the length of the conversion cycle from click to conversion, and the bid strategy type.
Other platforms describe the same phenomenon in their own terms. TikTok's documentation on the learning phase says that “Throughout this phase, campaign performance may fluctuate as the system explores and adapts to the campaign settings”, and that “Typically, volatility starts to decline after about 25 campaign results or 7 days from when the campaign enters the learning phase.” Note the condition on that figure: it is TikTok's stated threshold for volatility beginning to decline, not a guarantee of stability, and it is TikTok's number rather than a cross-platform rule.
Decide in advance how often you are permitted to change budget and target, keep each change inside the 20% guidance Google gives, and write the change and its date somewhere you will read later. In our portfolio, the accounts that scale most predictably are the ones where nobody is allowed to make an unscheduled edit in response to a single bad day.
Does changing the target restart the learning period?
No — Google states that adjusting your CPA or ROAS targets will not trigger a “Learning” status and will not reset what Smart Bidding has already learned. That is a genuinely useful distinction, and it is not the same as saying target changes are free.
The page on how Google's bidding algorithms learn is the source. It describes the system as reacting immediately to a target change by adjusting bids, while retaining what it has already learned. It also describes adaptive historical weighting — relying more heavily on recent data when adjusting bids, while accounting for the length of your conversion cycle — and advises allowing at least one conversion cycle before evaluating results.
So the two documented facts sit side by side, and both are true:
- A target change does not put the bid strategy into Learning. The model is not retrained from scratch, and you are not paying a three-week calibration tax for adjusting a number.
- A target change still changes what you buy, immediately. Bids move, the eligible pool moves with them, and the results you see afterwards are drawn from a different population than the ones before.
- Structural changes are the expensive ones. A new or reactivated bid strategy, a changed bid strategy setting, or campaigns and ad groups being added or removed are what Google lists as triggering the Learning status.
The operational consequence is that you should be far more careful about restructuring than about tuning. Teams routinely have this backwards: they will nudge the target four times a week without recording it, then rebuild the campaign structure wholesale when results disappoint, which is the change that actually costs three weeks. If you are going to restructure, do it once, deliberately, and then leave it alone long enough for the documented calibration window to elapse.
And whichever you change, evaluate it against at least one conversion cycle. Judging a target change on three days of data, when your click-to-install-to-event cycle is longer than three days, is judging a number that has not finished arriving.
Where is the extra volume supposed to come from?
From a wider pool, a looser target, or better creative — and only one of those three is free. If the audience you are allowed to buy is fixed and your target is fixed, more budget has nowhere to go but deeper into the same pool, which is the definition of the problem.
Work through the levers honestly:
- Remove restrictions you added. Google advises against excluding too many locations, placements or mobile categories. Every exclusion made in the name of quality is a piece of pool you no longer have when you need to scale. Audit them before concluding the market is exhausted.
- Add genuinely new inventory. New geographies, new languages, new platforms. This resets the depth problem because it is a different pool, but it also resets your learning on that pool and usually your creative relevance with it.
- Loosen the target, knowingly. Google's own framing is that a lower value target gives the campaign more potential to scale. That is a purchase of volume with margin, and it is legitimate if the marginal cohort still pays back.
- Improve the creative. The only lever that can move the whole curve rather than trading along it, because it raises the conversion rate of the audience you already reach. It is also the slowest and the one nobody wants to hear about during a scaling emergency.
- Improve the store listing. Every install is bought traffic converting on a page. A listing that converts better lowers the effective cost of every source at once, which is the same class of gain as better creative and is frequently cheaper to get.
Notice what is not on that list: finding a cheaper network. Substituting sources changes the mix of who you reach, but it does not create audience that was not there. Teams that respond to saturation by adding networks usually end up buying the same users through more intermediaries. Our note on incrementality testing covers how to tell whether a new source is adding users or re-buying them, and the mass acquisition playbook covers the sequencing when you genuinely do need more surface area.
How do you tell saturation from a broken campaign?
Saturation raises cost and volume together; breakage raises cost while volume stalls or falls. That single test resolves most cases, and the ones it does not resolve have a short list of usual causes.
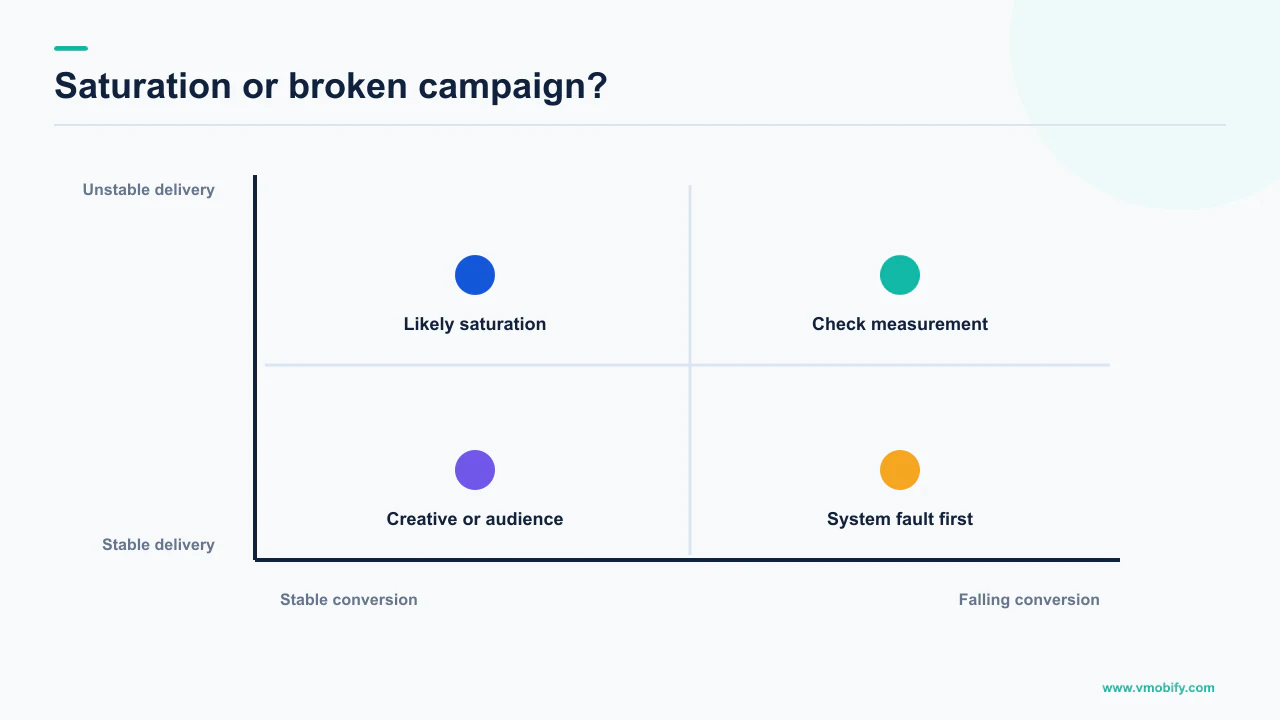
Run the comparison on two stable periods, not on a rolling chart, and make sure neither period contains one of your own edits. Then check, in order:
- Did installs rise at all? If spend rose 60% and installs rose 45%, you are on the curve. If installs rose 5%, you are not looking at depth, you are looking at a delivery constraint.
- Are you inside a learning window of your own making? A bid strategy change, a restructure or an added or removed campaign puts you into Learning, and Google's stated window is up to three weeks or one to two conversion cycles. If you edited inside that window, the data is not yet a measurement of anything.
- Is the budget above Google's stated ratio? 50 times target CPI, or 10 times target CPA. Below it, erratic delivery is expected and is not evidence of an exhausted market.
- Has the target been cut recently? A tighter target narrows the pool. If someone cut it in response to the CPI rise, the subsequent volume drop is caused by the fix, not by the market.
- Has the creative been running long enough to fatigue? Falling conversion rate on stable impressions is a creative signal, not a depth signal, and it responds to different treatment.
- Did the measurement change? An SDK update, an attribution window change or a conversion event redefinition can move reported CPI without anything in the market moving at all.
That last one is worth more attention than it gets. Depth costs money slowly; broken measurement costs money all at once. If your chart has a step in it rather than a slope, look at your instrumentation before you look at the market.
What should you actually do when CPI rises?
Establish whether the marginal install still pays back, then either accept the higher cost or buy less deliberately — and in both cases stop editing long enough to observe a result. There is no third option where the same audience becomes cheap again because you asked firmly.
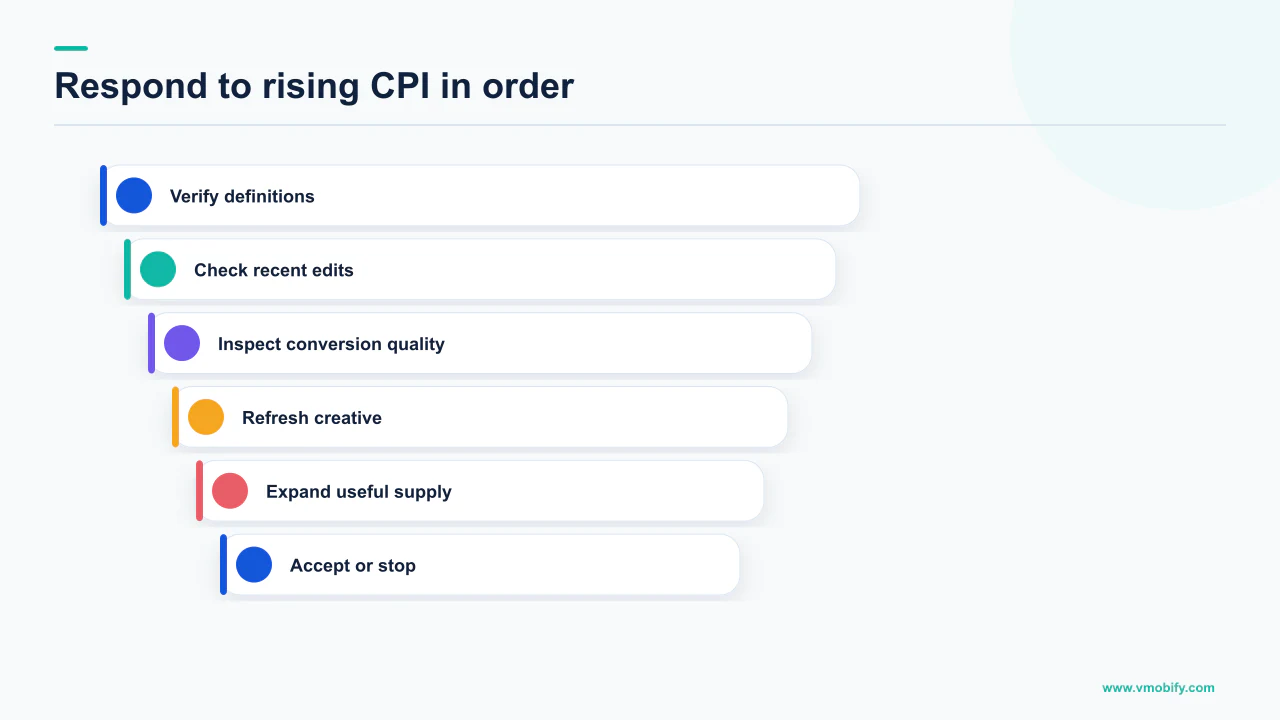
- Difference two stable periods to get a marginal cost per install, rather than reacting to the blended average your dashboard reports.
- Test that marginal cost against your payback window, not against last quarter's CPI. Last quarter's CPI was the price of a shallower buy and is not available at this budget.
- If it pays back, hold the target and let the campaign run. Accepting a higher CPI at higher volume is a legitimate and frequently correct outcome.
- If it does not, reduce budget rather than crushing the target. Both reduce volume; reducing budget keeps the eligible pool intact, whereas cutting the target narrows what you can buy for as long as it stays cut.
- Keep every change within Google's 20% guidance, and change one thing at a time so the next fortnight is interpretable.
- Wait at least one conversion cycle before judging, which is what Google advises, and longer if you touched the bid strategy or the structure.
- Work the levers that move the whole curve — creative and store conversion — in parallel, because they are the only ones that make the same audience cheaper rather than trading volume against margin.
The underlying point is that scaling has a price and the price is visible in the CPI. A campaign that costs more per install at three times the spend is not misbehaving; it is telling you, accurately, what the next tranche of users costs. The failure is not the rising number. The failure is refusing to price it, and instead running a fortnight of edits that leave you with less volume, a narrower pool, an unfinished learning period and the same CPI you started with.
If you cannot tell which of these you are in, that is a short diagnosis for someone who has seen the pattern before. Send us the spend and install series for the two periods, or look at how we structure scaling work in our user acquisition practice and how we model the payback side in the LTV to CAC calculator.
Frequently Asked Questions
Why does my CPI go up when I increase the budget?+
Because the extra budget buys users who were less likely to install than the ones already being reached. At a smaller budget the system buys the cheapest, most obvious matches first; at a larger budget it has to go deeper into the same pool. The unit cost of the marginal install rises even though nothing about the campaign has broken.
Should I lower my target CPI to bring the cost back down?+
Only if you intend to buy less. Google states that a higher ROAS target narrows the pool of potential installs while a lower target gives the campaign more potential to scale, and its guidance on low traffic with Target CPA notes that a target significantly below your historical average CPA may not be attainable while maintaining reasonable levels of traffic. A tighter target reduces what you are eligible to buy rather than discounting it.
How much budget does a Google App campaign need?+
Google advises setting your average daily budget at 50 times your target CPI, or 10 times your target CPA, and ensuring you have enough budget allocated to allow the campaign to grow. Note the multiplier is smaller for event optimisation, not larger: 10 times the target CPA against 50 times the target CPI. What does not shrink is the volume of conversions the system needs to learn from, so an event campaign can clear the ratio and still be starved of signal.
How large a change is too large?+
Google advises against drastic changes and gives its own examples: changing the budget by more than 20%, or changing your CPI by more than 20%. Keeping each change inside that guidance, and changing one thing at a time, is what makes the following period interpretable.
How long is the learning period?+
Google states it can take up to 3 weeks or 1 to 2 conversion cycles for the bid strategy to calibrate to the new objective, although it can be faster depending on the amount of conversion data present. Duration depends on the number of conversions obtained, the length of the conversion cycle, and the bid strategy type.
Does changing my target reset the learning period?+
No. Google states that adjusting CPA or ROAS targets will not trigger a Learning status and will not reset what Smart Bidding has already learned; the system reacts immediately by adjusting bids. What Google does list as triggering Learning is a recently created or reactivated bid strategy, a changed bid strategy setting, or campaigns, ad groups or keywords being added or removed.
Is there a benchmark for how much CPI should rise per doubling of budget?+
Not one we would print. No platform publishes such a curve, and it varies by vertical, geography, creative and season, so any figure quoted for it is a single sample presented as a law. Measure your own curve by differencing two stable periods that contain none of your own edits, and compare the marginal cost against your payback window.
Sources
- Tips for maximizing your App campaign — The 50x target CPI and 10x target CPA budget ratio, the guidance against changes greater than 20%, and the advice not to over-restrict audience.
- Duration of the learning period for campaigns and what affects it — Up to 3 weeks or 1-2 conversion cycles to calibrate, what triggers the Learning status, and the factors affecting duration.
- How our bidding algorithms learn — Target changes do not trigger a Learning status or reset prior learning; advises at least one conversion cycle before evaluating.
- About bidding in App campaigns — A higher ROAS target narrows the pool of potential installs; a lower one gives more potential to scale. Bids are an average amount per install.
- Fix low traffic or conversion rate for Target CPA bidding — A target CPA significantly below historical average CPA may not be attainable while maintaining reasonable traffic levels.
- Estimate your results with bid, budget, and target simulators — Simulators estimate clicks, cost, impressions, conversions and conversion value under different bids; App campaigns are supported.
- About Learning Phase | TikTok Ads Manager — Performance may fluctuate during the phase; TikTok states volatility typically starts to decline after about 25 campaign results or 7 days.
- Fix "Limited by budget" status — Describes the budget-limited campaign status and Google’s recommendation to apply the recommended average daily budget.
About the author
Amol Pomane — Founder, Vmobify
Amol leads Vmobify, a mobile app growth agency that has driven 30M+ downloads and ranked 54K+ keywords across 300+ apps since 2013. He writes about ASO, paid user acquisition, retention, and the operational reality of scaling mobile apps in India and global markets.
Model an install budget
Turn CPI and activation assumptions into acquisition scenarios.
Open free tool