Ecommerce App Marketing: How to Drive Installs That Convert to Buyers
Most ecommerce app marketing fails because teams optimise for installs instead of first purchase. Here is the install-to-buyer playbook that scales repeat revenue.
Why is ecommerce app marketing different from web ecommerce?
Web ecommerce and app ecommerce look similar on the surface but operate on completely different economic math — and the teams that treat their app as a mobile version of their website consistently underperform teams that treat it as a CRM channel. The web is a transaction layer: drive traffic, optimise conversion, repeat. The app is a relationship layer: install once, monetise repeatedly over months or years.
This distinction reshapes three foundational decisions:
- First-purchase economics dominate, not click-to-buy. An install is just a license to nurture — it has zero standalone value. CAC must be calculated on first-purchase converters, never on raw installs. Teams that report "₹40 CPI" without reporting their install-to-buyer rate are reporting a vanity number.
- Push notifications replace email as the primary engagement channel. Push has 8-15x higher open rates than email per AppsFlyer's State of App Marketing data — but only when used sparingly and with intent. Apps that push more than 4-5 times per week see a sharp uninstall spike that wipes out the engagement gain.
- Repeat purchase rate is the LTV multiplier. An app with a 35% 90-day repeat purchase rate is worth roughly 3x an identical app at 10% repeat — even at identical first-purchase CAC. The entire post-install playbook should be designed around lifting that number.
In our portfolio across 300+ apps, the ecommerce apps that scale profitably without exception treat their app the way a bank treats a current-account holder: as an owned audience to be nurtured, not as a stream of transactions to be optimised one-by-one. That mental model is the foundation of everything else in this playbook.
Most D2C teams arriving from web-first backgrounds make the same predictable mistake: they import their Google Shopping CAC mental model wholesale into app marketing, conclude the unit economics do not work, and either underspend or abandon the app channel entirely. The unit economics absolutely work — but only when measured across the 90-day repeat window, not the first transaction.
There is also a structural advantage that web ecommerce can never match: the app is a permanent piece of real estate on the user's home screen. Every push notification you earn the right to send is a zero-cost re-acquisition event. Every loyalty point accrued in-app is switching-cost the user cannot transfer to a competitor. Across our portfolio the apps that internalise these advantages early outscale their web-equivalent peers by a factor of 2-4x on contribution margin within 18 months.
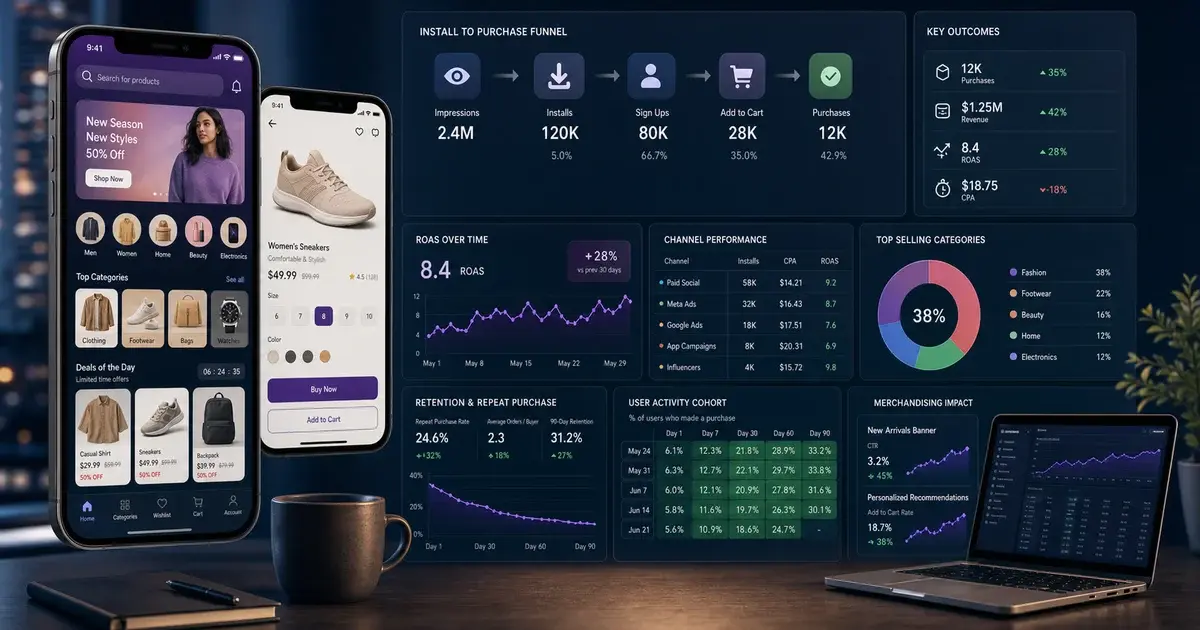
What does the install-to-buyer funnel look like at each stage?
The ecommerce app funnel has four measurable stages, and each has a published benchmark you can hold your team to. Optimising any one stage in isolation is far less effective than identifying which stage has the largest leak and concentrating effort there.
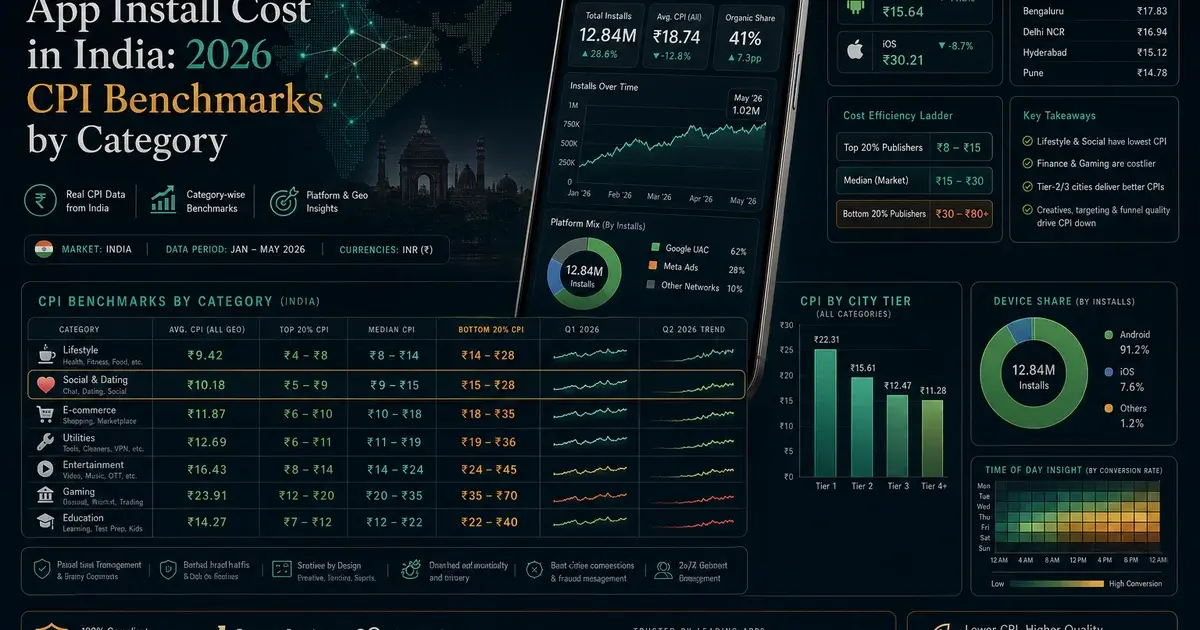
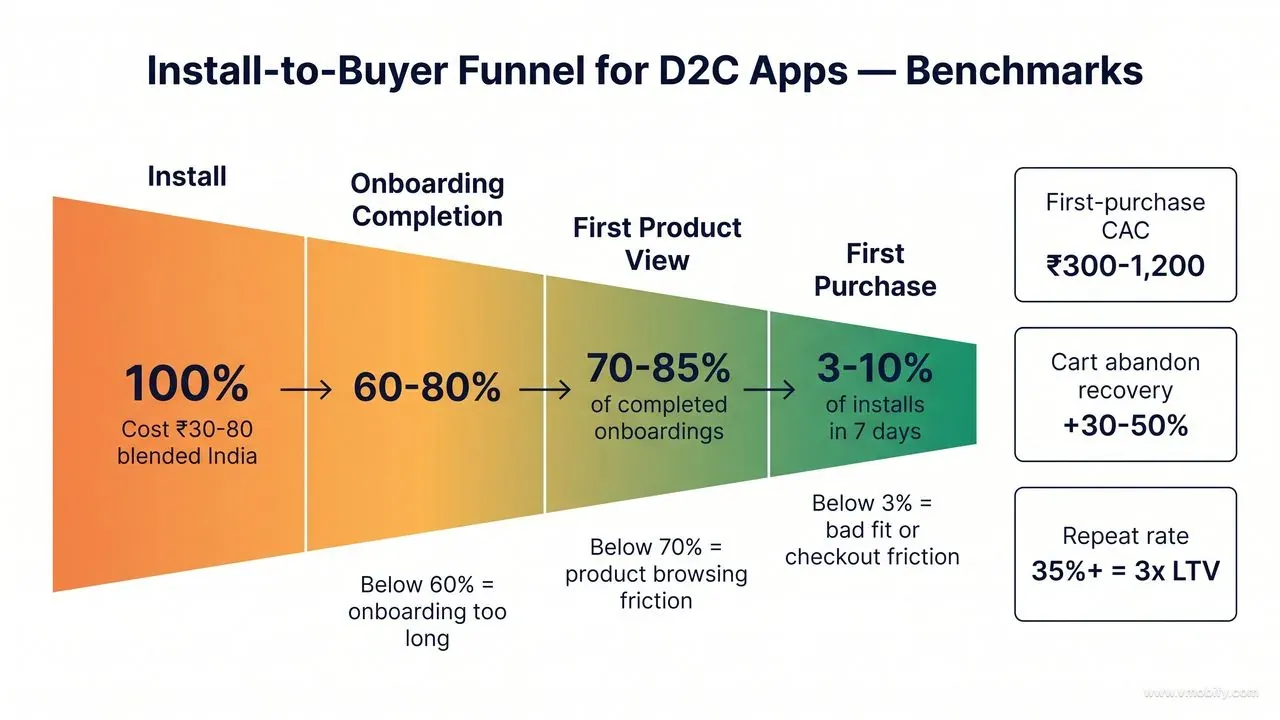
- Install: Cost ₹30-80 blended in India for D2C apps, $2-6 in Western markets. Measured by attributed installs via MMP. This is the entry price for the relationship, not a metric to optimise in isolation.
- Onboarding completion: 60-80% of installs should complete onboarding (account creation, location, basic preferences). Below 60% means onboarding is too long, asks too much personal data, or forces friction (mandatory signup, OTP loops) before the user has seen any value.
- First product view within session 1: Should hit 70-85% of completed onboardings. If users complete onboarding but never view a product in the same session, your home feed is failing — either the personalisation has no signal yet or the feed lacks compelling visual hook.
- First purchase within 7 days: 3-10% of installs become first-time buyers within a week depending on category. Fashion sits around 4-7%, beauty 5-9%, electronics 2-4%, home/grocery 6-12%. Below 3% almost always signals product-fit mismatch with the acquired audience, not a checkout problem.
The biggest leverage in this funnel is almost never at acquisition — it is at onboarding completion to first-product-view. Across our portfolio, fixing this transition typically moves blended first-purchase rate by 30-50% with zero additional acquisition spend. Adjust's mobile app benchmarks consistently show ecommerce onboarding drop-off as the single largest stage-loss in the category.
Track every stage explicitly in your UA stack. Apps that report only CPI and ROAS are flying blind on the two intermediate stages where most of the diagnostic value sits.
One diagnostic shortcut we run on every new portfolio app: pull the funnel for the last 30 days, identify the largest single percentage-point drop, and concentrate 80% of the next sprint's product and CRM effort against just that stage. Apps that try to optimise all four stages simultaneously rarely move any of them; apps that pick the worst stage and attack it ruthlessly typically lift end-to-end first-purchase rate 25-40% in a single sprint.
What is the right channel mix for ecommerce apps?
For most Indian D2C apps spending ₹10-50L per month on user acquisition, the optimal channel mix in 2026 looks roughly like this:
- Meta Advantage+ App Campaigns — 35-45% of paid budget. Best for visual product discovery, lookalike modelling from your existing buyer base, and Reels-format creative. Meta's Advantage+ documentation stresses broad targeting plus high creative volume — both critical for ecommerce where product variety means audience variety.
- Google App Campaigns (UAC) — 25-35%. Strong on branded search defence, category search ("shoes app," "kurti shopping"), and Google Shopping inventory. Combine with web-to-app deep links so your existing Google Shopping spend funnels mobile users into the app rather than mobile web.
- Apple Search Ads (iOS) — 10-15%. Highest-intent traffic on iOS, captures bottom-funnel users actively searching the store for your category. Routinely under-invested by Indian D2C brands despite iOS users having 2-4x higher AOV than Android in most categories. See Apple Search Ads documentation for setup.
- TikTok / Instagram Reels — 10-15%. Top-of-funnel discovery channel with the best CPMs for unbranded reach. Works only with UGC-style product demos; polished studio creative consistently underperforms native short-form on these surfaces.
- Influencer + UGC creator partnerships — 5-10%. Especially valuable for category extensions, festive launches, and new product drops. Pairs well with your CPI burst infrastructure for coordinated launch moments.
- Owned channels (email + push re-engagement) — separate from paid budget but critical to repeat-purchase economics. The marginal cost is essentially zero; the marginal LTV impact is enormous.
The mix shifts by stage. New apps under 100K installs should weight Meta heavier (50-55%) until the algorithm has enough conversion data to feed Google UAC efficiently. Mature apps over 1M installs typically rebalance toward Google as branded search volume grows.
A common mistake we see across new entrants: chasing TikTok or Reels heavily before product-market fit is established. Short-form discovery channels are excellent at filling the top of the funnel, but they bring browsers, not buyers. Until your install-to-first-purchase rate is at category benchmark, every additional unit of top-funnel traffic dilutes your blended CAC math. Fix the funnel first, then scale top-of-funnel discovery — not the other way around.
Which creative formats convert browsers into installers?
Ecommerce app creative has a small set of repeatable winning formats — and a much larger set of "looks good in the brand deck" formats that consistently underperform. The formats that move install rate across our portfolio:
- App-exclusive offer hooks: "Only on app — flat ₹500 off" or "App-only price — 60% off" lifts install rate 20-40% versus identical product creatives without the exclusivity line. Indian shoppers in particular respond strongly to channel-specific incentives.
- Product carousels: 5-8 products in a swipeable Meta carousel format. Especially effective for fashion, beauty, and home decor where variety is part of the value proposition. Single-product creatives win for hero SKUs; carousels win for category exploration.
- UGC unboxing or try-on: Authentic creator content outperforms studio creative by 30-60% in most D2C categories per our internal aggregation. The "amateur production quality" actually helps — it reads as honest review rather than ad.
- Social proof + ratings overlay: "4.7★ — 50K+ reviews" baked into the first frame of every video. Social proof in the opening 2 seconds materially lifts hook completion rate.
- Limited-time scarcity: Sale countdown timers, "ends tonight," "only 23 left." Works extraordinarily well in Indian fashion and beauty during festive windows.
The single biggest creative lever is volume of variants. Apps running 4-6 creatives in their Meta campaigns consistently lose to apps running 10-15 — the algorithm needs inventory to test against. We see this pattern in our portfolio every quarter without exception. For deeper Meta-specific creative protocols see our Meta App Install Campaigns playbook.
One additional creative pattern worth testing: split-screen "before / after" or "with-app / without-app" formats. These outperform single-narrative creatives in beauty, fashion, and home categories because the comparison frame does the persuasion work without needing voiceover or text. Cheap to produce, easy to iterate, and they translate well across both Meta and TikTok placements.
How do you engineer the first purchase?
First-purchase conversion is where most ecommerce apps leak the most money — and where the highest-ROI interventions sit. Each percentage point of first-purchase rate is typically worth more than 5-10% reduction in CPI because the lift applies to your entire install volume, not just the marginal install.
- First-app-open offer: A meaningful discount (15-25%, not 5%) displayed within the first session, ideally within the first 30 seconds. Higher conversion than COD-only models, and trains users to expect the app as a value channel.
- One-tap checkout: Saved address, saved payment method (UPI default in India), single-click order confirmation. Each additional checkout step drops conversion approximately 10%. Apple Pay and Google Pay integration on iOS/Android respectively are no longer optional.
- Cart-abandonment push within 1 hour: Cuts abandonment 30-50% when combined with a small incremental incentive (free shipping, additional 5% off). Beyond 24 hours the recovery rate collapses; the first hour is where almost all the recoverable revenue lives.
- Free shipping threshold: Visible everywhere — cart, product page, home banner. Indian shoppers respond very strongly to "free shipping above ₹499" framing, with AOV typically rising 15-25% to meet the threshold.
- Trust signals at checkout: COD option (still 40-60% of Indian D2C orders per Statista's India digital commerce data), secure payment badges, easy returns promise. Removes the last objections before tap-to-pay.
One pattern we see consistently across our portfolio: apps that show the discount before the product look promotional; apps that show the product before the discount look premium. Order of operations on the first screen matters as much as the discount value itself.
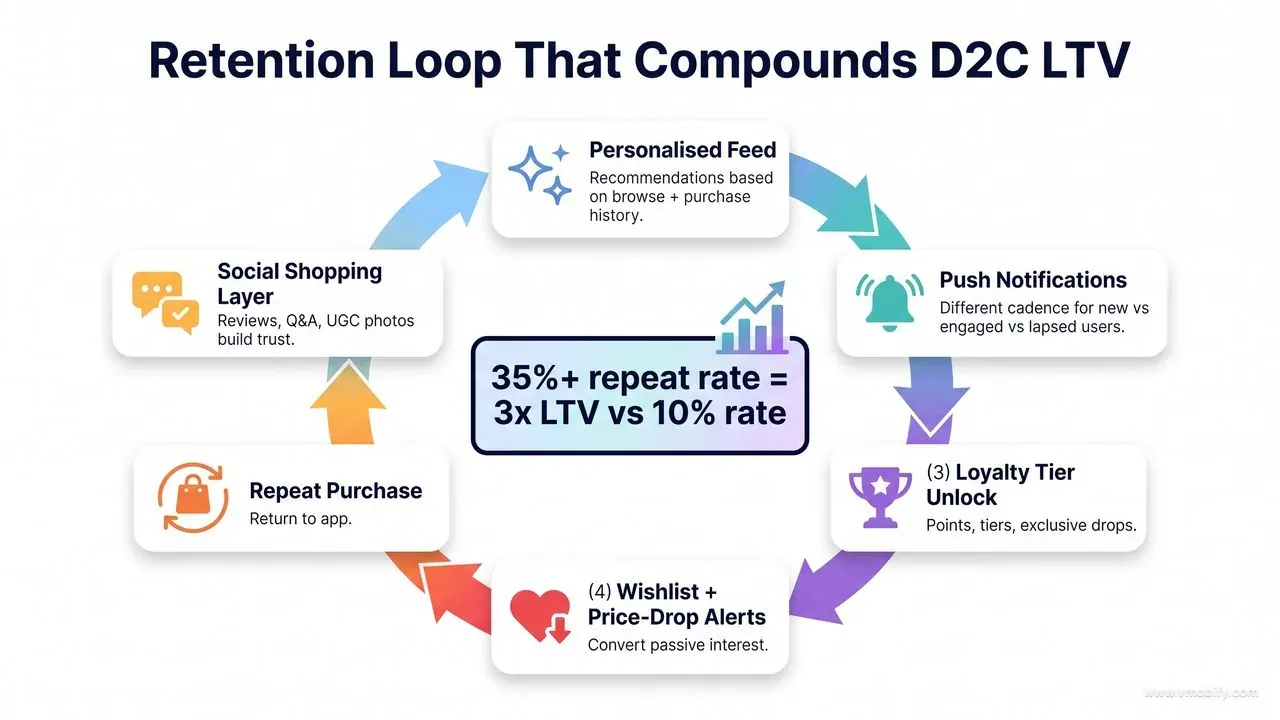
Which retention loops compound LTV over time?
The repeat-purchase rate gap between top-quartile and median ecommerce apps is enormous — and it is driven almost entirely by post-install product and CRM mechanics, not by acquisition quality. What top apps do that median apps do not:
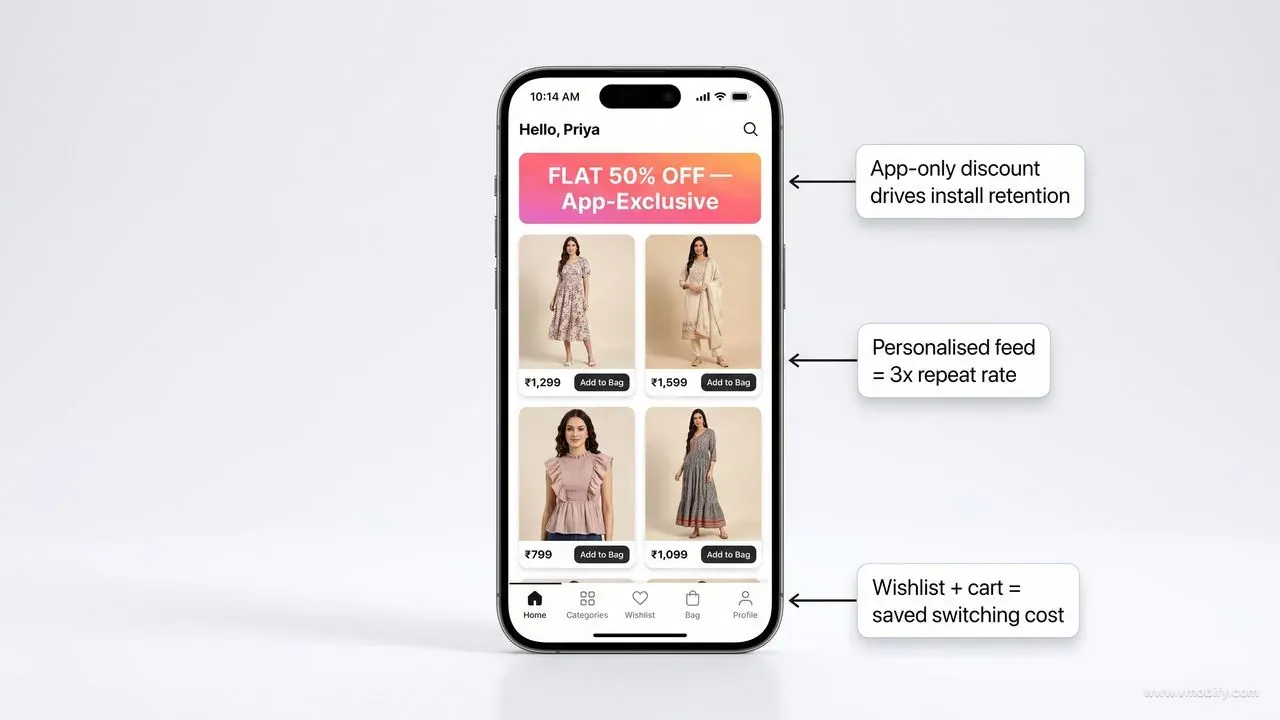
- Personalised home feed driven by browsing + purchase history, surfacing new arrivals in categories the user has engaged with. Compounds engagement on every return visit. A static home feed forces the user to navigate; a personalised feed sells before they decide to look.
- Push notification cohort strategy: Different push cadence for new users (welcome series, 4-5 touches in week 1), engaged buyers (new arrivals, restock alerts, 2-3 per week), and lapsed users (win-back offers, escalating discounts at 14/30/60 days). Blanket-blast push schedules destroy engagement.
- Loyalty programme tied to app-only behaviour: Points for purchases, tier benefits for cumulative spend, exclusive drops for high-tier members. Designed to give users a reason to open the app even without immediate intent to buy. Myntra Insider and Nykaa Prive are the reference implementations in the Indian market.
- Wishlist + price-drop alerts: Converts passive interest into active conversion at the moment of price change. One of the highest-ROI push notifications in the entire ecommerce playbook — users opted in by adding to wishlist, intent already established, only the price was blocking.
- Community + social shopping: Reviews with photos, Q&A threads, user-uploaded outfits. Builds session length and trust simultaneously. Meesho's social-commerce loop is the canonical example of this compounding.
For full retention architecture see our app retention strategy guide. The short version: retention is engineered into product, not bolted on with discount emails.
How does ASO work for ecommerce apps?
Ecommerce ASO is a quiet workhorse — typically 25-40% of installs for established D2C apps come from organic store traffic, often at zero marginal cost. The specifics that matter for ecommerce versus other categories:
- Category and long-tail vernacular keywords: "fashion app," "online shopping," "kurti shopping," "kids clothes," "ethnic wear" — Indian vernacular long-tail keywords drive surprisingly large install volume. Our ASO team consistently finds 20-30 high-intent regional keywords competitors have not optimised for.
- Screenshots showing breadth + offers: First screenshot = best-selling category visual + "Up to 60% off" overlay. Second = product variety grid (8-12 products visible). Third = trust badges (free shipping, easy returns, COD available). Fourth = social proof / ratings.
- Reviews highlighting delivery and quality: Address the two biggest Indian shopper anxieties prominently in your store-listing-visible reviews. SplitMetrics conversion research shows that visible review themes affect install rate even when overall rating is held constant.
- Icon refresh during major sales: Updating the app icon for Diwali, End of Season Sale, or festive seasons lifts discovery during high-intent shopping windows. Both stores reward updated visuals; users respond to seasonal freshness.
- In-App Events (iOS) and Promotional Content (Android): Surface time-bound sale moments directly on the store listing. Apple In-App Events are particularly under-used by Indian D2C brands and can drive 10-30% incremental installs during the event window.
See our complete ASO guide for the deeper category-agnostic playbook and our case study results in our portfolio for ecommerce-specific outcomes.
How is quick-commerce marketing different?
Quick-commerce (10-30 minute delivery) is its own marketing animal — the playbook overlaps with traditional D2C but diverges sharply on geo-targeting, creative timing, and CPI economics. The four differences that matter:
- Hyper-local targeting to dark-store catchment areas: Quick-commerce only works within a 2-3 km radius of the dark store. Spending acquisition budget outside that radius produces installs that cannot transact. Geo-targeting precision matters more than in any other ecommerce vertical.
- Time-of-day creative and bidding: Grocery peaks at 7-10am and 6-9pm. Snacks peak at 4-6pm and 9-11pm. Bidding flat across the day overpays for non-converting hours and underpays for peak intent windows. Dayparting is mandatory.
- CPI economics run higher: ₹80-200 in India versus ₹25-80 for traditional D2C, driven by intense competition (Blinkit, Zepto, Instamart, BigBasket, Swiggy Instamart) pushing auction prices up. Quick-commerce CAC is justified by extremely high purchase frequency — 4-8 orders per month for active users versus 1-2 for traditional D2C.
- Category-defending creative posture: Most quick-commerce creative is competitive (faster delivery, better prices, wider catalogue) rather than category-building. Users already know the category exists; the marketing job is brand preference within an established habit.
The retention loops are also tighter. Quick-commerce apps that fail to drive a second order within 14 days of the first essentially lose the user permanently to whichever competitor delivered on time. Push cadence, delivery reliability, and price competitiveness must all hold simultaneously — none alone is enough.
One under-appreciated quick-commerce mechanic is the "default app" lock-in effect. Households tend to standardise on one quick-commerce app for routine grocery and another for late-night snacks; the second-choice app rarely sees more than 20% of the first-choice app's order volume even at price parity. Acquisition spend that fails to capture default-app status within the first 30 days of a user's tenure is largely wasted regardless of how many initial orders it drove.
For benchmarks on CPI by category and geography see our India CPI benchmark guide. If you are scaling an ecommerce or quick-commerce app and want a managed acquisition + retention programme, talk to our team.
Frequently Asked Questions
What is a healthy install-to-first-purchase conversion rate?+
For Indian D2C apps: 5-10% within 7 days is healthy. 10%+ is excellent. Below 3% indicates either bad product fit or excessive friction in onboarding/checkout. Track the funnel stage by stage, not just the end-to-end rate.
How important is repeat purchase for ecommerce app marketing?+
Critical. A 35% 90-day repeat purchase rate roughly triples LTV vs a 10% rate at the same CAC. Most marketing wins compound through repeat rate, not through more first-time buyers. Budget retention investment proportional to its LTV impact.
Should I run app-only offers?+
Yes. App-exclusive pricing or features incentivise installs and discourage uninstalls. Most successful Indian D2C brands (Myntra, Meesho, Nykaa) run material app-only economics — typically 5-15% better pricing or exclusive product drops on the app channel.
How does ecommerce CPI compare to other verticals?+
D2C / ecommerce CPI in India runs ₹25-80 — middle of the pack. CAC (cost per first-purchase) typically 5-15x CPI depending on funnel quality. Quick-commerce runs higher at ₹80-200 because of competitive auction pressure between major players.
Do quick-commerce apps need different marketing than traditional D2C?+
Yes. Quick-commerce optimises for hyper-local dark-store targeting, time-of-day dayparting, and competitive category defence. CPIs are higher but order frequency is 4-8x traditional D2C, which makes the unit economics work despite the elevated acquisition cost.
How much should I budget for retention versus acquisition?+
For ecommerce apps past the first 100K installs, roughly 60-70% paid acquisition, 30-40% retention infrastructure (CRM, push tooling, personalisation, loyalty programme). New apps should weight acquisition heavier until they have a buyer base to retain against.
Which MMP is best for ecommerce app attribution?+
AppsFlyer, Adjust, and Singular all have mature ecommerce SDKs. AppsFlyer has the largest publisher integration footprint in India; Adjust has cleaner privacy-first attribution post-ATT; Singular has the best cost-and-revenue blending for ROAS reporting. All three work — pick on team familiarity and pricing.
Sources
- AppsFlyer — State of App Marketing — Push notification open-rate benchmarks vs email and engagement data by vertical
- AppsFlyer Performance Index — Quarterly retention and install-quality benchmarks by category and geography
- Adjust — Mobile App Resources — Ecommerce funnel benchmarks and onboarding drop-off data
- Meta — Advantage+ App Campaigns — Official guidance on broad targeting and creative volume for app install campaigns
- Apple Search Ads — iOS bottom-funnel acquisition documentation and bidding setup
- Apple — In-App Events — Surfacing time-bound sale moments on the App Store listing
- SplitMetrics — First Screenshot Conversion Data — Store-listing screenshot impact on install conversion rate
- Statista — Mobile Internet Usage in India — India digital commerce data including COD share and mobile shopping behaviour
About the author
Amol Pomane — Founder, Vmobify
Amol leads Vmobify, a mobile app growth agency that has driven 30M+ downloads and ranked 54K+ keywords across 300+ apps since 2013. He writes about ASO, paid user acquisition, retention, and the operational reality of scaling mobile apps in India and global markets.
Free Growth Audit
See exactly how to scale your app with 13+ years of expertise behind you.
Get My Strategy