Real Estate App Marketing: Driving Buyer Intent Installs
Real estate is the highest-LTV install in mobile but the hardest to attribute. Here is the buyer-intent playbook for property apps and broker platforms.
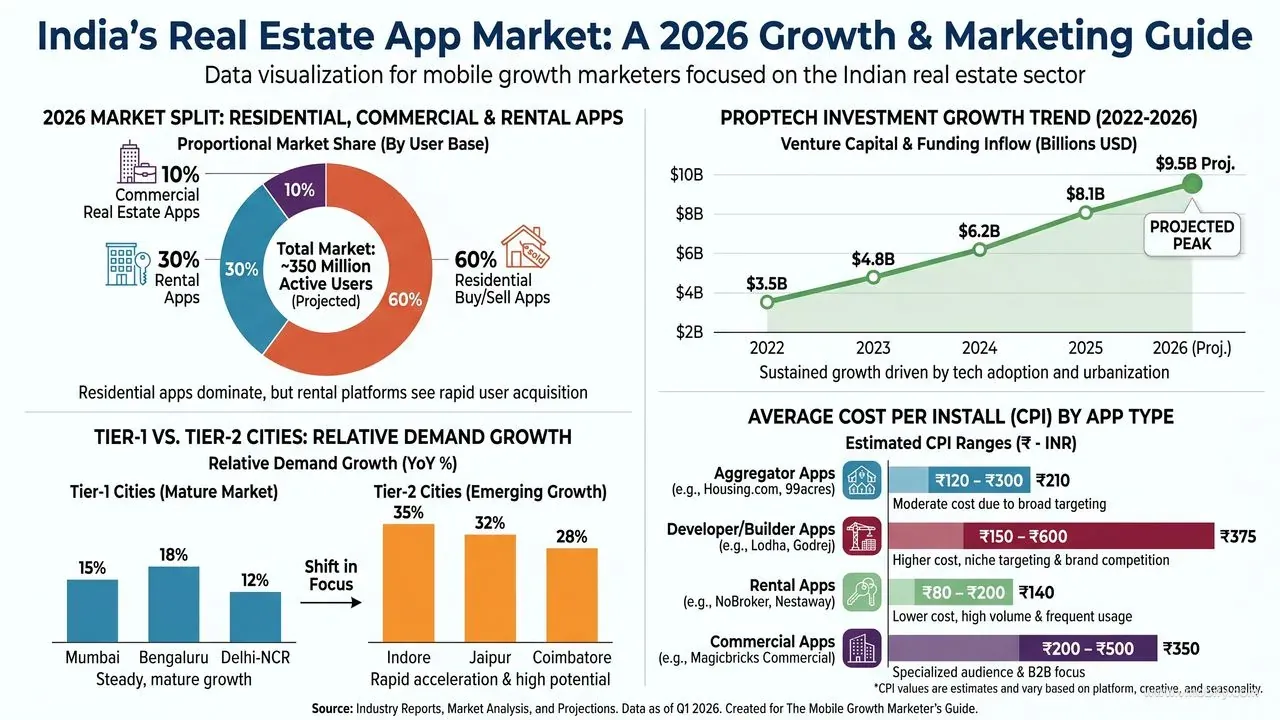
What is shaping the Indian real estate app market in 2026?
Indian real estate is one of the largest and most fragmented app categories on the subcontinent — and 2026 is the year the category economics finally split apart along clear lines rather than every player chasing every buyer. Magicbricks, 99acres, Housing.com, NoBroker, and Square Yards each move billions in property value through their apps, but the marketing playbooks that worked in 2022 produce expensive useless installs in 2026.
Four structural dynamics are reshaping the category right now:
- NoBroker's broker-free rental model has matured into a dominant rental category force, pulling rental search behaviour away from broker-led incumbents and forcing every rental app to either match the zero-commission proposition or differentiate sharply on inventory depth.
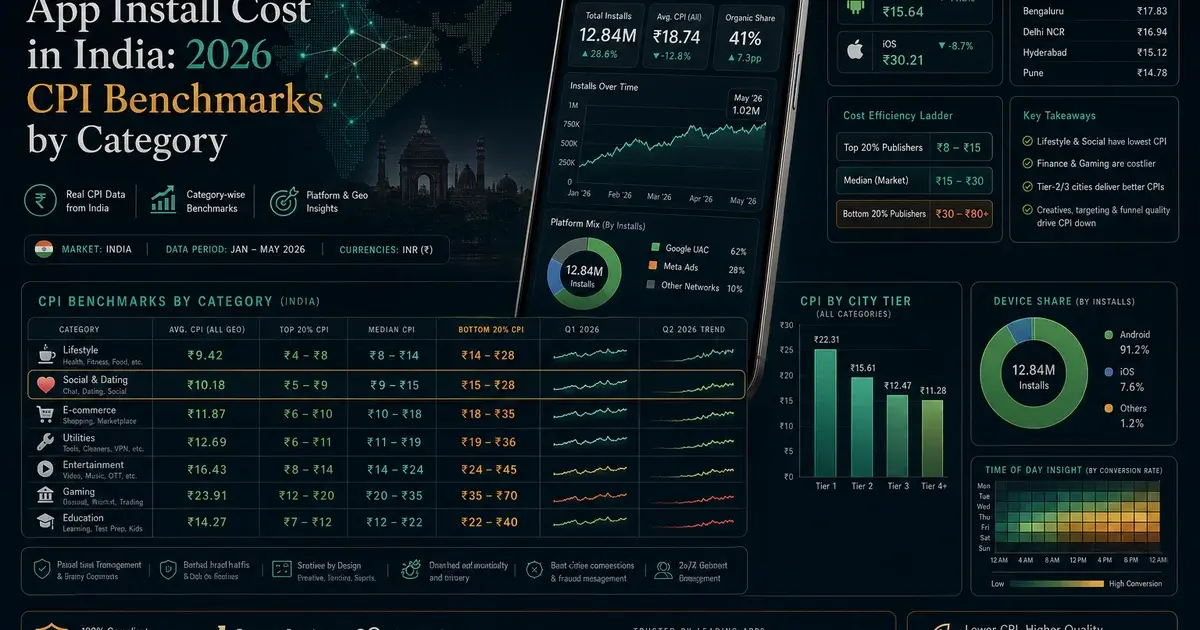
- Tier-2 cities (Indore, Coimbatore, Lucknow, Jaipur, Surat) are now the fastest-growing markets — both for supply and for app installs — with CPIs 40-60% below metro auctions and meaningfully higher organic install share thanks to lower competitor saturation.
- Commercial real estate apps are emerging as a separate vertical with their own buyer profile (founders, SMB operators, retail tenants) and dramatically different economics — higher CPIs but transaction values 5-20x residential.
- Builder-owned single-project apps are taking share in premium residential, where developers control the entire funnel from ad to site visit to booking, cutting out aggregator commissions of 1-2% per closed transaction.
In our portfolio across 300+ apps managed since 2013, real estate has the widest gap of any vertical between install volume and revenue contribution. The teams that win in 2026 stop optimising on installs entirely and rebuild their measurement stack around qualified leads and site visits booked. Statista's India mobile usage data confirms the audience is here at scale — the bottleneck is funnel discipline, not reach.
One more structural shift worth flagging: WhatsApp has become the de-facto first-contact channel for property leads, displacing both phone calls and in-app chat for the majority of buyer-broker conversations. Apps that route leads to WhatsApp natively (with consent and template-message compliance) see 2-3x higher first-response rates and materially better sales conversion than apps still routing through legacy phone-call dispatch. This single integration is one of the highest-leverage product changes a property app can ship in 2026.
What are the category models and unit economics?
Real estate apps split into four distinct sub-categories with wildly different CPI, lead-cost, and closed-CAC profiles — and confusing them is the fastest way to misallocate budget. Benchmarks for the Indian market in 2026:
- Buy / sell residential: CPI ₹120-300. Cost per qualified lead ₹400-1,500. Closed-deal CAC ₹15,000-₹80,000. Long cycle, high LTV, requires sales team to convert.
- Rental: CPI ₹80-200. Cost per qualified lead ₹150-500. Closed CAC ₹2,000-₹8,000. Faster cycle, lower per-transaction revenue, higher transaction frequency.
- Commercial real estate: CPI ₹200-500. Cost per qualified lead ₹2,000-₹10,000. Closed CAC ₹30,000-₹2,00,000. Long cycle, very high LTV, niche audience.
- Single-project builder apps: CPI varies by project value (₹150-₹600). Lead funnel optimised exclusively for site visit bookings; everything upstream is supporting.
The gap between CPI and closed-deal CAC is the structural margin pressure of real estate marketing. An app paying ₹200 per install but ₹40,000 per closed deal is losing 199 of every 200 installs along the funnel — every step between has to be instrumented, attributed, and ruthlessly optimised. AppsFlyer's State of App Marketing shows real estate consistently in the top three verticals by event-tracking complexity for exactly this reason.
Within each sub-category, premium and budget segments diverge sharply too. A ₹4cr-6cr residential buyer behaves nothing like a ₹40L buyer in their app usage, channel responsiveness, or sales cycle — premium buyers tend to spend longer in research, engage more with video and walkthrough content, and convert through fewer but higher-value site visits. Budget buyers move faster, react to price-drop alerts more strongly, and tolerate higher push-notification frequency. Segmenting campaigns by price band inside each sub-category is the second-order optimisation that separates mature operators from scale-up apps.
One critical implication: rental and residential buy/sell should almost never share campaigns. The audiences look similar on paper but convert on completely different signals. We have rebuilt account structures for property apps where the single highest-impact change was forcing campaign separation between rental and sale intent — blended CPL dropped 35% within four weeks once the bidding algorithms could optimise each cohort independently. Our user acquisition team treats category separation as the first audit step on every real estate engagement.
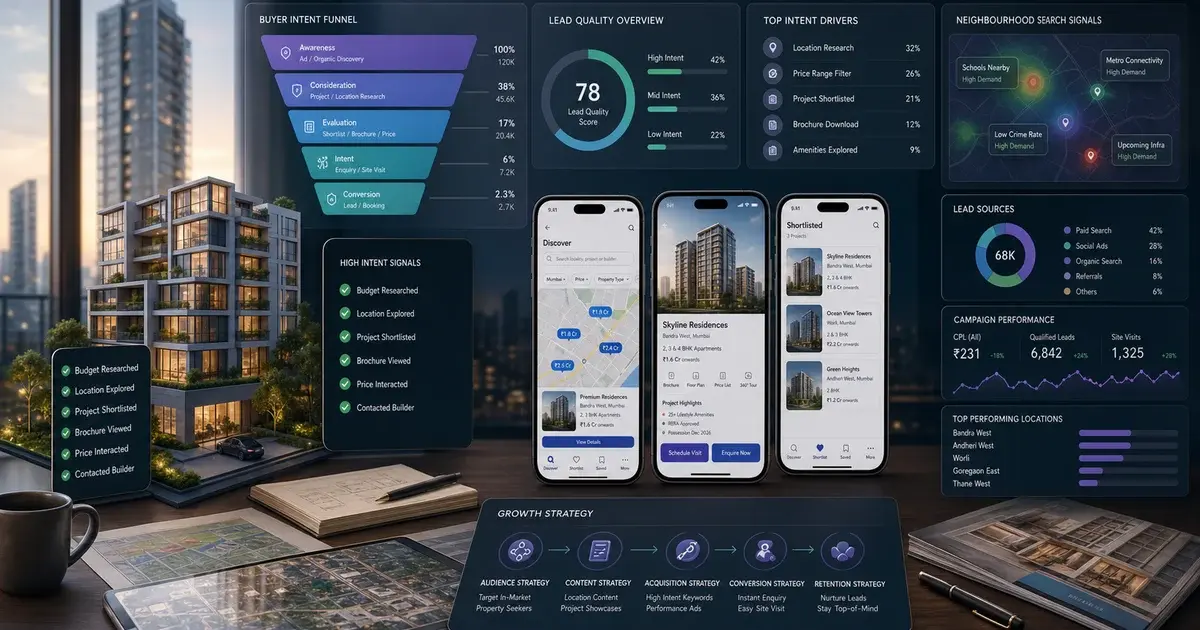
How does the buyer intent funnel actually work?
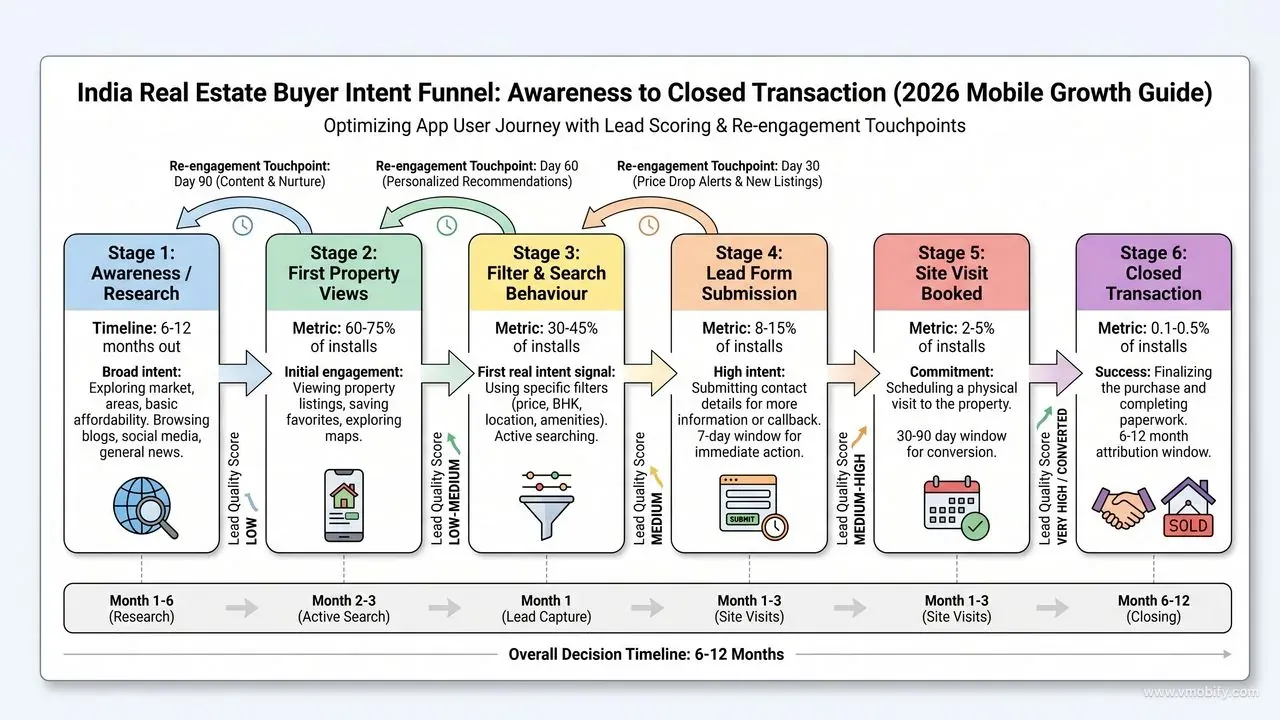
The real estate buyer funnel has six distinct stages and each one cuts the audience by roughly half — optimising paid spend on install is optimising on the noisiest signal in the entire funnel. Realistic conversion rates for an Indian residential property app:
- Install: Cheap noise. Most installs are passive browsers, curious renters who actually want to buy, or competitor agents researching listings.
- First property view: Mildly positive intent. 60-75% of installs reach this step within day 1.
- Filter / search behaviour: Stronger signal. 30-45% of installs filter by city + budget within their first session — this is the first real intent marker worth optimising bidding against.
- Contact / lead form submission: Real intent. 8-15% of installs convert to a lead within 7 days.
- Site visit booked: Highest-value pre-transaction action. 2-5% of installs reach this step over a 30-90 day window.
- Closed transaction: 0.1-0.5% of installs over a 6-12 month attribution window.
Optimise paid campaigns on at minimum "filter behaviour" — preferably "site visit booked." Google's UAC documentation is explicit that the platform optimises against whatever event you configure as the conversion goal. Configure install, get installs. Configure site visit booked, get installs that convert to site visits.
The catch is data volume: tROAS bidding needs roughly 30+ conversion events per week per campaign to optimise properly. For low-frequency events like site visit booked, this often means consolidating campaigns geographically or running a hybrid model — optimise on filter behaviour for the first 4-6 weeks while accumulating site-visit volume, then shift the goal once the data is there. Across our property app portfolio this hybrid approach consistently outperforms either pure-install or pure-site-visit optimisation in the first 90 days.
Attribution windows also matter more in real estate than in any other vertical. The default 7-day post-install attribution window misses 70-80% of true conversions because the buyer cycle is so long. Configure your MMP and ad platforms with 30-day install-to-event and 90-day re-engagement windows at minimum; without this, you are systematically under-crediting your highest-performing campaigns and over-investing in cheap, fast-converting noise.
The other instrumentation trap is treating all property views equally. A view of a ₹3cr property by a user who filtered for ₹2.5cr-3.5cr is a strong intent signal; a view of the same property by a user who filtered for ₹40L rentals is a misclick. Event payloads should include the property price band and the user's filter context — without that metadata the conversion event is unattributable to genuine intent and bidding algorithms train on noise.
Which channel mix performs best for property apps?
Real estate is one of the few app verticals where Google (UAC + Search) dominates over Meta — buyer intent is overwhelmingly search-led, and high-value queries like "3BHK Whitefield Bangalore under 1.5cr" are some of the most commercially valuable keywords on the Indian internet. Recommended 2026 channel allocation for a property app at ₹50L+ monthly UA budget:
- Google UAC + Search (40-50%): Locality + property-type queries convert at 3-5x the rate of any other channel. Run Search separately from UAC where the platform supports it to capture pure-intent queries at lower CPC.
- Meta (25-35%): Demographic targeting on income proxies (job titles, education, location radius around premium clusters) plus lookalikes built from verified site-visitors and closed customers. Avoid lookalikes built from raw install cohorts — they replicate the noise, not the intent.
- YouTube (10-15%): Property walkthrough videos, builder testimonials, and city-discovery content. YouTube performs disproportionately well for premium residential where buyers want to see the property before contacting.
- OOH + offline (5-15% where budget allows): Hoardings near high-density residential clusters and metro stations work for brand reinforcement; difficult to attribute but show up in branded search volume within 2-4 weeks.
- Performance affiliate (5-10%): Lead-aggregator networks for Tier-3 fills and rental volume. Quality varies wildly — vet every source via our publisher network rather than buying directly.
One channel decision matters more than the others: separate Tier-1 and Tier-2 city campaigns at the account-structure level. Bengaluru, Mumbai, Delhi-NCR auctions are 2-3x more expensive than Indore, Coimbatore, Lucknow for equivalent intent. Meta's Advantage+ guidance argues for broad targeting, but real estate is the exception — the geographic cost asymmetry is too large to let the algorithm blend.
ASO carries more weight in real estate than in most categories because the buyer research cycle drives repeat branded search. A property app climbing in category rankings captures durable organic install share that compounds for months. See our ASO services for category-specific listing optimisation playbooks.
A note on YouTube specifically: long-form property walkthroughs (5-10 minutes) outperform short ad cuts for high-ticket residential. Buyers spending ₹2cr+ on a flat want to see kitchen layout, balcony view, common-area amenities, and natural light before committing to a site visit. Run these as TrueView in-stream with skippable formats and conversion-optimised CTAs; the CPM is higher but the cost-per-site-visit-booked is consistently the lowest of any video channel we run for premium residential clients.
Why does lead quality beat lead volume in real estate?
Real estate marketing fails at the seams between marketing and sales — teams obsess over lead volume, sales reps burn out chasing tyre-kickers, and CAC explodes while reported "lead cost" looks healthy. The fix is a four-layer lead quality system, not a bigger sales team:
- Qualifying questions in the lead form: Budget range, timeline (next 3 months / 6 months / 12 months+), location preference, current accommodation status (renting, owning, NRI). Two extra fields cost you 15-20% of lead volume and improve sales-team close rate by 40-60%.
- Automatic rejection of low-intent leads: No-budget, no-timeline, no-location leads should never reach the sales team. Route them into a nurture sequence (saved searches, weekly digest emails) until they re-engage with stronger signals.
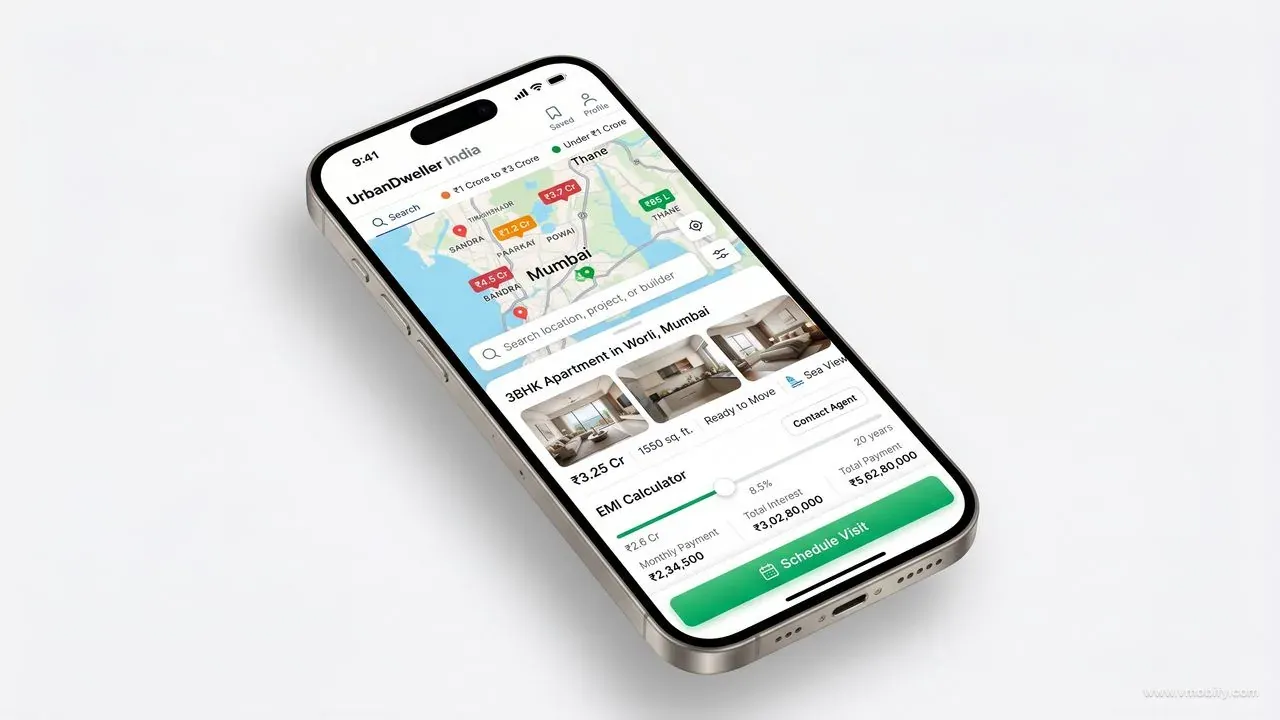
- App-behaviour scoring: Multiple property views in a session, repeat visits across days, EMI calculator usage, favourites added, and locality filter depth all signal real intent. A lead with 8 property views and 3 EMI calculations converts 4-6x better than a lead with 1 property view — sales prioritisation should reflect that.
- Sales team feedback loop: Sales reps rank lead cohorts weekly on a simple 1-5 scale. Bad cohorts trace back to specific campaigns, creatives, or geographies — those get paused or rebuilt within the same week. Without this loop, marketing optimises on a metric (leads delivered) that does not correlate with revenue.
The hardest part is cultural, not technical: marketing teams resist cutting lead volume because their dashboards reward it, and sales teams resist documenting cohort quality because it feels like extra work. Adjust's mobile measurement research consistently shows real estate as the vertical with the largest gap between top-funnel KPIs and revenue KPIs — closing that gap is largely an organisational problem, not an algorithmic one.
In our portfolio, the single biggest CAC reduction we have delivered for a property app — 47% drop in cost-per-site-visit-booked over 90 days — came from implementing qualifying questions and the sales feedback loop alone. Zero changes to bidding, creative, or channel mix. The leverage is in the funnel discipline.
One often-overlooked source of low-quality leads is competitor agents and broker researchers who install your app to scrape inventory. These users look identical to genuine buyers in top-funnel metrics but never convert. Identify them via behavioural signatures — rapid sequential property views without filter use, lead submissions on properties spanning incompatible budget ranges, repeated installs across devices — and exclude them from optimisation audiences. We typically find 5-10% of an Indian property app's "lead" volume falls into this competitor-research bucket; excluding it improves model training and reduces wasted sales-team capacity.
Lead-routing speed is the other under-engineered lever. A lead contacted within 5 minutes of submission converts to a site visit at 3-5x the rate of a lead contacted after 24 hours. Real estate apps with mature lead operations route leads to sales reps via push notification with auto-escalation if the first rep does not respond within 10 minutes. This is a product investment, not a marketing one — but it directly determines whether the marketing spend translates into revenue.
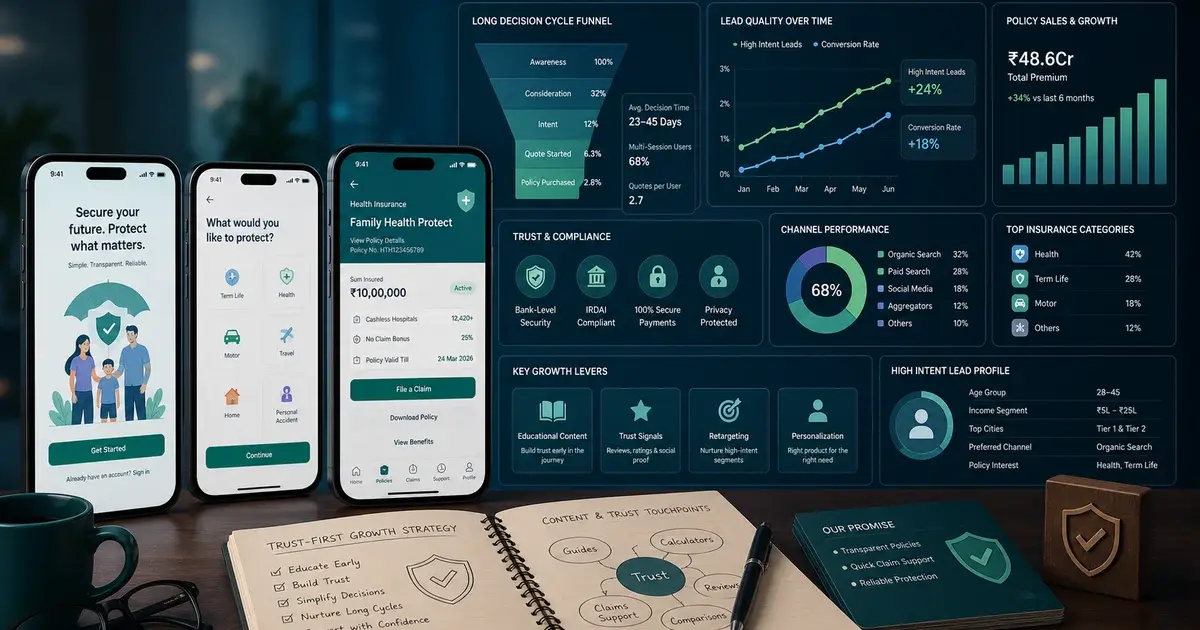
How do you retain users through a 6-12 month decision cycle?
Real estate buying takes 3-12 months from first install to transaction — sometimes longer — and an app that cannot hold attention through that cycle effectively pays CAC twice for every closed deal. Retention strategy in property apps is not a nice-to-have layer; it is the entire economic model.
The six retention mechanics that consistently move LTV in our property app portfolio:
- Saved searches with price-drop and new-listing alerts: Push notifications when matching properties are listed or repriced. This is the single highest-engagement retention surface for buy/sell — users actively want these alerts and tolerate higher push frequency than any other category.
- EMI calculator and affordability tools: Reasons to return that are not purely transactional. Users planning a 6-month purchase will run EMI calculations 10-20 times across the decision cycle. Each return visit is an opportunity to surface new inventory.
- Locality and neighbourhood content: Schools nearby, commute times, market trends, livability scores. Content keeps the app top-of-mind during the long research phase where buyers are not actively contacting sellers.
- Saved favourites and side-by-side comparison tools: Build switching cost as users construct their shortlist. A buyer with 12 saved properties on your app is materially less likely to defect to a competitor — the curation work is sunk cost.
- Re-engagement push series at decision-cycle milestones: 30, 60, and 90 days post-install. Each touch surfaces new inventory matching their saved searches, market updates for their target locality, and EMI rate changes if relevant.
- Email + WhatsApp as parallel channels: Push notification opt-in rates degrade after 60 days; email and WhatsApp catch users who have muted in-app notifications but still want updates. Real estate is one of the few categories where multi-channel retention beats push-only.
Match your retention investment to the decision cycle. An app spending 70% of marketing budget on acquisition and 30% on retention will struggle in real estate. Mature property apps in our portfolio run closer to 50/50 once they are past the initial scale-up phase — the retention spend is what converts the long-cycle pipeline that paid acquisition fills.
For category-adjacent retention playbooks see our app retention strategy guide and the insurance app marketing playbook — insurance shares the long-cycle, high-LTV, low-frequency profile of real estate and many retention mechanics transfer directly. For India CPI benchmarks across categories see our India CPI benchmark guide.
Talk to our team if you are running a property, rental, commercial, or single-project builder app and want a measurement and retention audit before scaling paid spend.
Frequently Asked Questions
Is install count the right metric for real estate apps?+
No — qualified leads and site visits booked are the right metrics. Install volume correlates poorly with revenue in real estate because the funnel is so long; optimising on install produces expensive, useless install cohorts that never convert to transactions.
What is a realistic cost per qualified lead in Indian real estate?+
₹400-1,500 for residential buy/sell in metros, ₹150-500 for rentals, ₹2,000-10,000 for commercial. Tier-2 cities run 30-50% cheaper than metros across all sub-categories.
Should real estate apps allow free posting by owners?+
Yes. Free posting drives the supply side of the marketplace, paid premium listings drive monetisation. The successful pattern in 2026: free for individuals, tiered paid plans for brokers and builders with verified-listing and lead-routing perks.
Are Tier-2 cities profitable for real estate apps?+
Increasingly yes. Lower CPIs, less competitor saturation, and growing affluence have made Tier-2 RoAS routinely better than metro RoAS in 2026 for most operators. The catch is sales-team and inventory operations have to scale to match.
How important is offline activation for real estate apps?+
For premium residential and commercial — important. Site visits, hoardings near target clusters, and broker partnerships still drive material volume and brand recall. Pure digital plays cap out faster in the high-ticket residential and commercial segments.
How should builder single-project apps differ from aggregators?+
Single-project apps should optimise the entire funnel around site visit booking as the primary conversion event. Aggregators need broader engagement metrics because their value is inventory breadth; builders need depth on one project and tight conversion to physical visit.
What is the right marketing-to-retention budget split for a mature property app?+
Closer to 50/50 once past the initial scale-up phase. Real estate decision cycles of 3-12 months mean retention spend is what converts the paid-acquisition pipeline into actual closed deals — under-investing in retention wastes the acquisition spend.
Sources
- AppsFlyer State of App Marketing — Real estate ranks top three verticals for event-tracking complexity and funnel depth
- Google Ads — App Campaigns Help — UAC conversion event configuration and tROAS bidding requirements
- Meta — Advantage+ App Campaigns — Broad-targeting guidance and the geographic-segmentation exception for real estate
- AppsFlyer Performance Index — Quarterly category benchmarks including real estate retention curves
- Adjust Mobile App Trends — Long-cycle vertical analysis showing real estate KPI-to-revenue gap
- Statista — India Mobile Internet Usage — Indian mobile audience scale and Tier-2/3 city expansion data
- Google Play Launch Best Practices — Official guidance on conversion event setup and ranking signals
About the author
Amol Pomane — Founder, Vmobify
Amol leads Vmobify, a mobile app growth agency that has driven 30M+ downloads and ranked 54K+ keywords across 300+ apps since 2013. He writes about ASO, paid user acquisition, retention, and the operational reality of scaling mobile apps in India and global markets.
Free Growth Audit
See exactly how to scale your app with 13+ years of expertise behind you.
Get My Strategy