India App Install Trends 2026: Annual State of Mobile Report
Our annual look at the Indian mobile marketing landscape — install trends, CPI movements, channel shifts, category dynamics, and what we expect next.

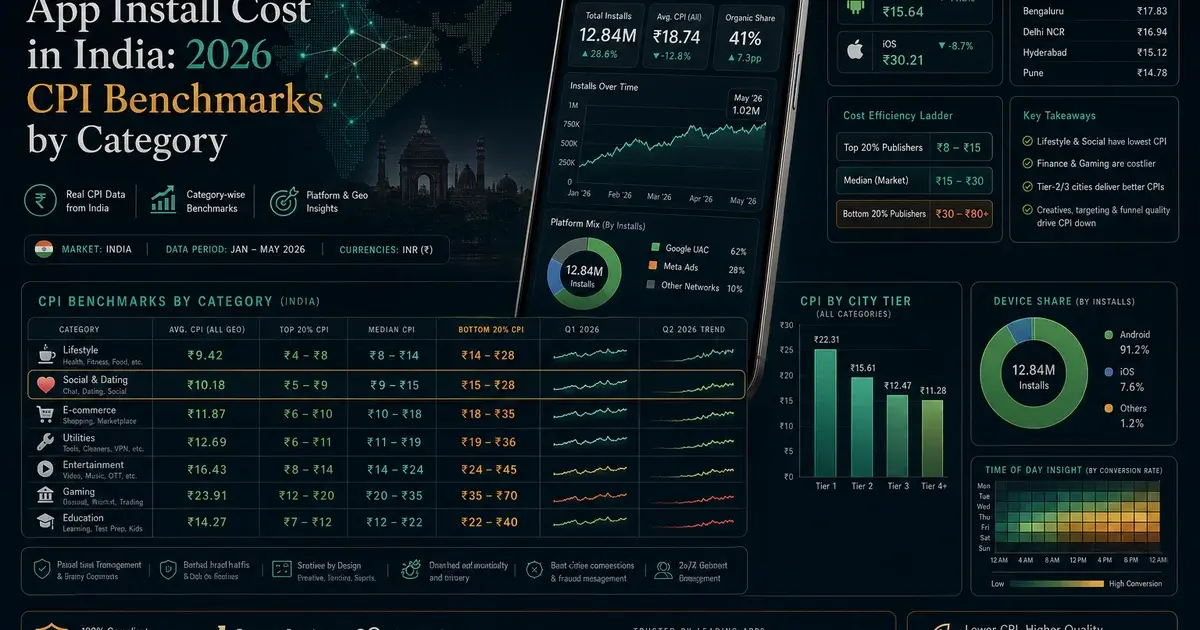
What are the 2026 headline numbers for India?
India crossed 880M smartphone users in early 2026, generated roughly 32B Play + App Store installs in calendar 2025, and is on track for 36-38B installs in 2026 — making it the largest app install market on the planet by absolute volume. No other country comes close on raw install count.
- 880M smartphone users in India — up from 850M at end-2025 per Statista's India smartphone forecast.
- ~32B app installs across Play Store + App Store in calendar 2025. Projected 36-38B in 2026.
- 97% Android share of installs by volume. iOS commands ~3% of installs but ~25% of in-app revenue.
- Average Indian user has 88 apps installed and actively uses 22 monthly.
- Median session length: 4.7 minutes. Median sessions per user per day: 12.
The retention-attention asymmetry is the most important number on this list. Users install far more apps than they actually use — 88 installed, 22 active — which means the war is not for the install. It is for the post-install slot in the user's working set of 22 apps. Apps that win the install but lose the second week churn out of consideration entirely, and reacquisition is 3-5x more expensive than first acquisition. We see this play out across our portfolio of 300+ apps under management: the spread between top-quartile and median D30 retention is the single biggest predictor of LTV, well ahead of CPI.
The 97% Android figure also deserves a footnote. Volume is Android. Revenue is split very differently — iOS users in India spend 3-5x more per active user on subscriptions, premium ecommerce and in-app purchases than Android users, consistent with the global pattern data.ai's State of Mobile has reported for years. Any monetisation-led app needs both platforms; any volume-led app can defensibly start Android-only.
One more headline worth flagging: median session length of 4.7 minutes hides a bimodal distribution. Utility, fintech and quick-commerce sessions cluster around 90-120 seconds — task-oriented, in-and-out. Gaming, OTT and social cluster between 8 and 25 minutes. The "average user" does not exist; your category sits firmly on one side of that split, and your retention, monetisation and creative strategy should be calibrated for the actual session shape your category produces, not for the blended national median.
How are install volumes shifting across categories?
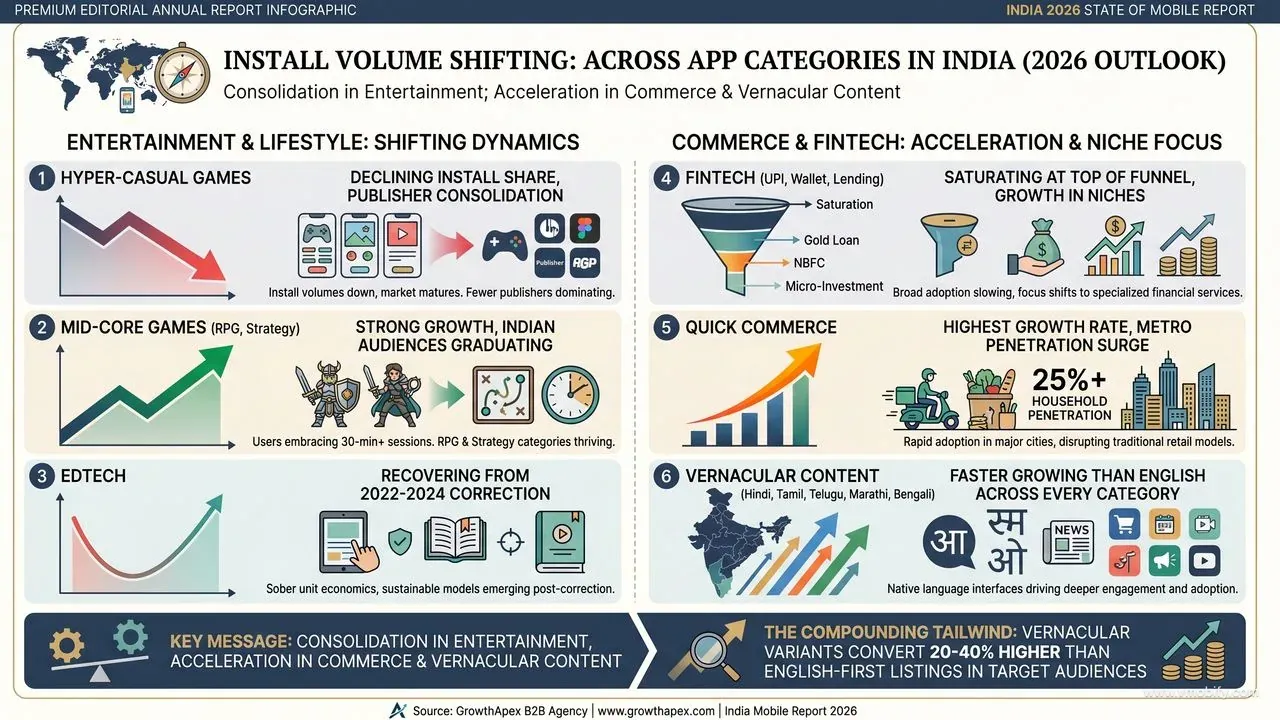
The headline trend is consolidation in entertainment categories and acceleration in commerce, vernacular content, and mid-core gaming. Hyper-casual gaming, the install-volume king of 2020-2023, has peaked and is now declining in share. Quick commerce, almost invisible in 2022, is now the single fastest-growing install category in India.
- Hyper-casual and casual games: Declining install share as competition consolidates and the publisher economics tighten. Many smaller studios have exited; the remaining publishers concentrate spend on fewer, higher-quality titles.
- Mid-core games: Strong growth, especially RPG and strategy. Indian audiences are graduating from 5-minute time-killers to 30-minute sessions with deeper monetisation, mirroring what Southeast Asia saw three years earlier.
- Fintech apps (UPI, wallet, lending): Saturating at the top of the funnel. New installs increasingly driven by niche segments — gold loan, NBFC personal loan, micro-investment, gig-worker earnings — rather than the generalist UPI players.
- Quick commerce: Highest growth rate of any category. Blinkit, Zepto and Instamart now have 25%+ household penetration in metros and are expanding aggressively into Tier-2.
- EdTech: Recovering from the 2022-2024 correction. K-12, test-prep, and skill-based learning are growing again, though with sober unit economics this time.
- Vernacular content (Hindi, Tamil, Telugu, Marathi, Bengali): Faster growing than English-medium across nearly every category — content, EdTech, fintech, even productivity.
For founders planning category entry, the strategic read is straightforward. Generalist plays in saturated categories (UPI, English K-12, hyper-casual single-title gaming) require capital outlays we would not advise. Niche plays in saturated categories (NBFC lending, vernacular test-prep, mid-core RPG) are completely defensible. The compounding tailwind across the entire chart is regional language — every category we serve in our ASO portfolio shows vernacular variants converting 20-40% higher than English-first listings in the audiences they target.
How have CPIs moved year-over-year by category?
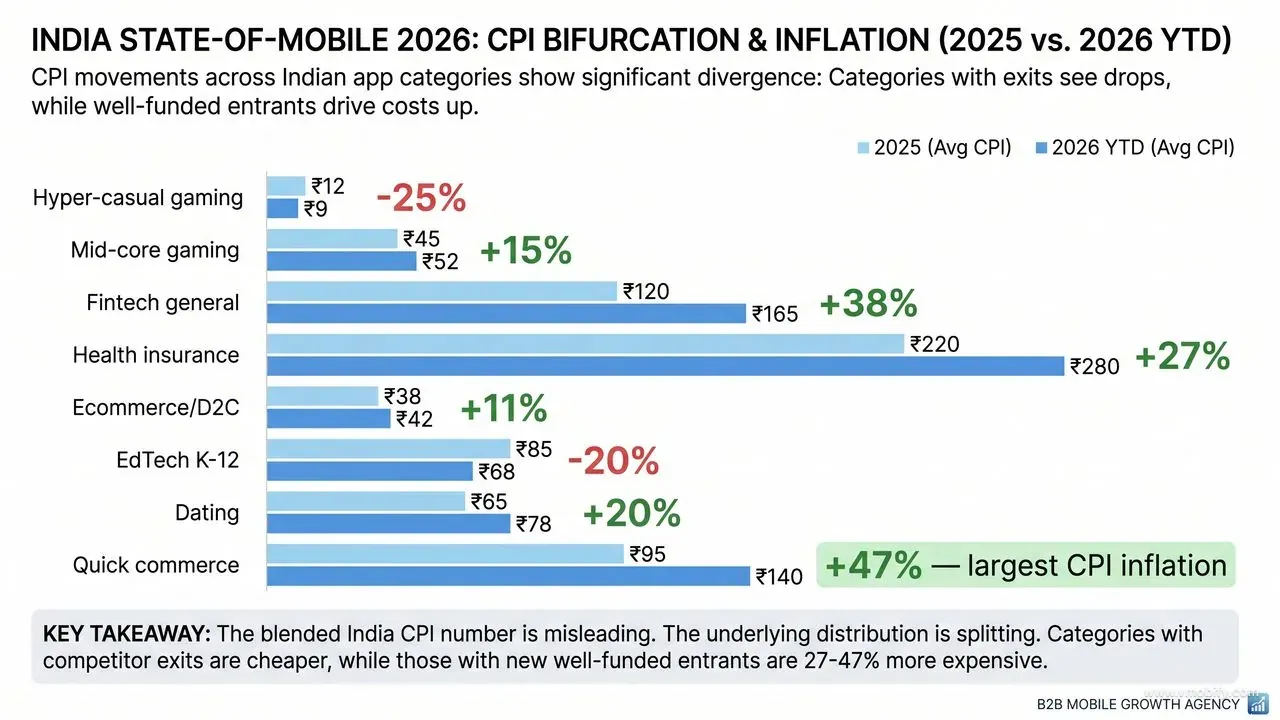
CPIs are bifurcating in 2026. Categories where competitors have exited (hyper-casual, post-correction EdTech) are 20-25% cheaper YoY. Categories where well-funded competitors are entering (quick commerce, fintech, health insurance) are 27-47% more expensive. The blended India CPI number is misleading because the underlying distribution is splitting.
Year-over-year CPI movements observed across our 300+ app portfolio (2025 to 2026 YTD):
- Hyper-casual gaming: ₹12 → ₹9 (-25%). Competition exit plus cheaper TikTok inventory in geographies where it operates.
- Mid-core gaming: ₹45 → ₹52 (+15%). More mid-core entrants competing for the same graduating audience.
- Fintech (general): ₹120 → ₹165 (+38%). Auction density up from new entrants in lending and investment. AppsFlyer's State of App Marketing shows the same pattern globally — fintech CPI inflation is structural, not cyclical.
- Health insurance: ₹220 → ₹280 (+27%). Continued well-funded competitor entry under IRDAI's expanding digital insurance framework.
- Ecommerce / D2C: ₹38 → ₹42 (+11%). Stable, slight inflation in line with general media cost increases.
- EdTech (K-12): ₹85 → ₹68 (-20%). Post-correction price stabilisation as overheated bidders exited.
- Dating: ₹65 → ₹78 (+20%). Bumble, Tinder and Hinge are bidding aggressively as US growth flattens.
- Quick commerce: ₹95 → ₹140 (+47%). Largest CPI inflation of any category — and rising further into 2026 H2.
The strategic implication for budget allocation: if you are in an inflating category, your paid acquisition mix needs to skew harder toward owned and earned channels — ASO, referral, lifecycle, content — because every quarter you fund growth purely through paid, your blended CPI compounds upward. If you are in a deflating category, this is your window to grab share at unusually cheap unit economics. For benchmark CPI bands and historical context, see our India CPI benchmark guide.
Where is install growth actually coming from geographically?
The single biggest geographic story of 2026 is that Tier-2 cities have overtaken metros as the install-growth engine of India. Tier-1 install growth has plateaued in most categories at or near saturation; Tier-2 is growing 25%+ YoY across Indore, Jaipur, Lucknow, Coimbatore, Visakhapatnam, Chandigarh and Surat. Tier-3 is following the same arc 12-18 months behind.
- Metros saturating. Tier-1 install rate growth has plateaued. Most major categories are at or near user-base saturation in Bengaluru, Mumbai, Delhi NCR, Hyderabad, Chennai, Kolkata and Pune.
- Tier-2 cities are the fastest-growing install markets: Indore, Jaipur, Lucknow, Coimbatore, Visakhapatnam, Chandigarh and Surat are all showing 25%+ install growth YoY.
- Tier-3 emerging: Patna, Ranchi, Madurai, Jodhpur — growth from a low base but compounding fast as cheaper smartphones penetrate and 5G coverage expands per TRAI's rural connectivity data.
- Northeast India: Long-underserved, growing rapidly post-better-connectivity. Apps building Northeast-specific content are seeing strong returns from very low competition.
- Maharashtra, Karnataka, Tamil Nadu, Andhra/Telangana: Together account for roughly 55% of India's smartphone install volume.
The practical UA implication is that geo-splitting your campaigns is no longer optional. Running a single India-wide ad group masks 2-3x cost differences between metros and Tier-2/3. In our portfolio, separating metro from non-metro in Google UAC and Meta Advantage+ ad groups routinely cuts blended CPI by 20-35% within two weeks because the algorithm can bid each tier at its true clearing price. Vernacular creative is the second half of the same lever — a Hindi creative running in Indore at a metro bid is paying a 30% premium for inventory that could be 30% cheaper at the right targeting setup.
Across our results portfolio, the apps growing fastest in 2026 are the ones that treated India as 8-10 distinct markets in 2024 and built creative, pricing and onboarding for each, rather than treating the country as one homogeneous block.
How is the paid channel mix evolving in 2026?
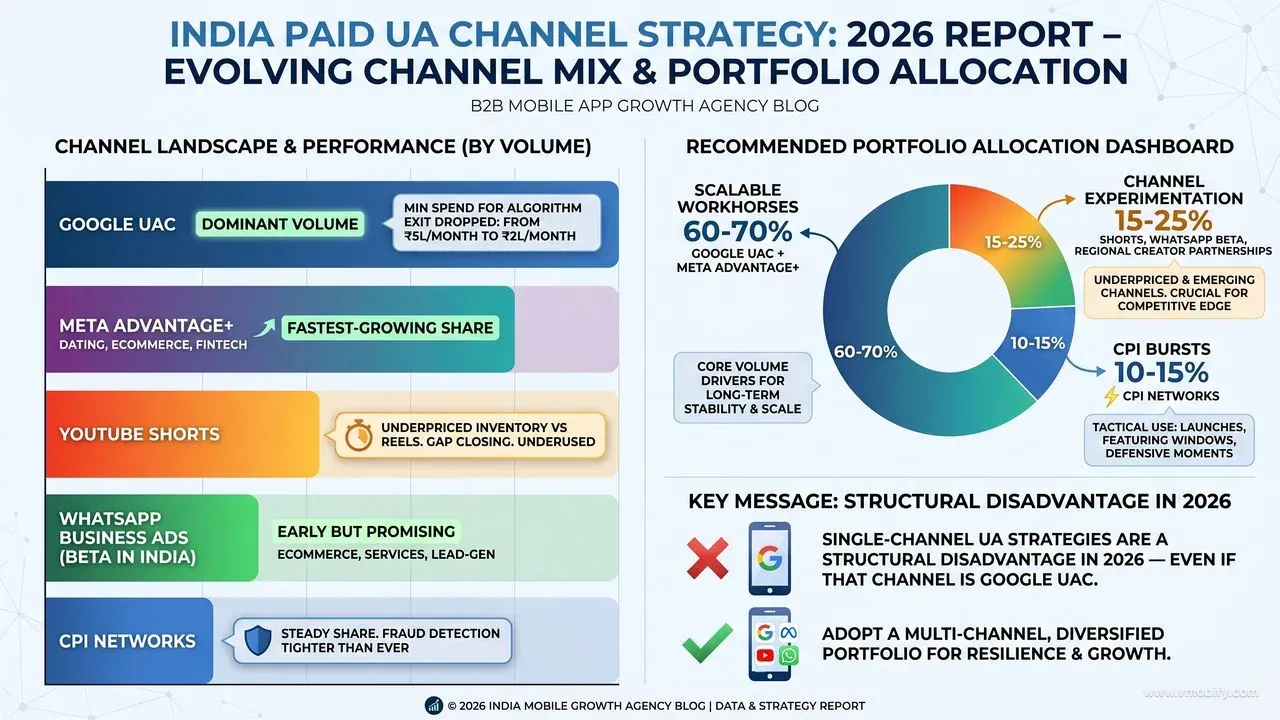
Google UAC remains dominant by volume, but the most interesting share gains in 2026 are happening on Meta Advantage+, YouTube Shorts and the WhatsApp Business ads beta. The mix is fragmenting in a way that rewards advertisers who can run 4-5 channels in parallel and punishes those still treating UAC as their only meaningful lever.
- Google UAC: Still the dominant channel by volume. Algorithm improvements in 2025 made it materially more accessible to mid-budget advertisers — the minimum spend to get the algorithm out of cold-start has dropped from ~₹5L/month to ~₹2L/month.
- Meta Advantage+: Growing share rapidly, especially in dating, ecommerce and fintech. Indian creative quality has caught up with US and EU benchmarks per Meta's own Advantage+ case material, and the algorithm rewards that creative depth.
- TikTok Ads (where active): Strong growth in gaming, ecommerce, and beauty in markets where it operates. The big variable remains the ongoing India policy environment.
- YouTube Shorts ad inventory: Consistently cheaper than Reels for most categories; underused. The CPM gap will close as more advertisers discover it.
- WhatsApp Business ads (beta in India): Early but very promising for ecommerce, services and lead-gen verticals where messaging is a natural conversion path.
- CPI Networks: Steady share. Quality vetting matters more than ever — fraud detection at AppsFlyer, Adjust and Singular has tightened, and incentivised traffic disguised as non-incent gets flagged faster than ever. Our own vetted publisher set is structured around this reality.
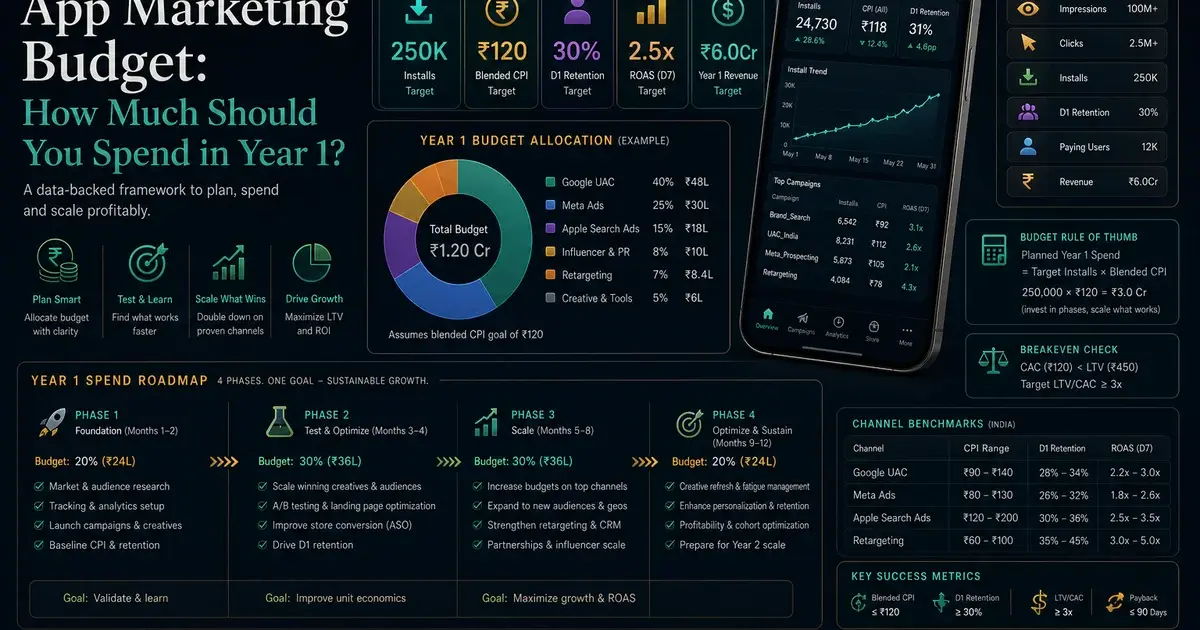
What we are advising portfolio teams in 2026: protect 60-70% of spend in UAC plus Meta Advantage+ (your scalable workhorses), allocate 15-25% to channel experimentation (YouTube Shorts, WhatsApp Business beta, regional creator partnerships), and keep 10-15% in legitimate CPI bursts timed around launches, featuring windows, or competitive defence moments. Single-channel UA strategies — even if the channel is Google UAC — are a structural disadvantage in 2026.
Which categories are winning and losing this year?
The cleanest 2026 winners combine genuine install growth with sustainable unit economics. The losers are mostly categories where competition has consolidated around 2-3 well-capitalised incumbents, leaving no oxygen for new entrants.
Winners (growth plus sustainable economics):
- Quick commerce — fastest growth, expensive CPIs but strong post-install monetisation.
- Mid-core RPG and strategy gaming — graduating Indian gamer audience with depth to monetise.
- Vernacular EdTech (Hindi and regional languages) — re-emerging post-correction with sober economics.
- D2C beauty and fashion — strong UGC-driven creative economics on Meta.
- Mental health and wellness — destigmatising rapidly, especially in Tier-1 and Tier-2.
- Vernacular OTT and regional content streaming — under-served audience, low competition.
Losers (saturation, consolidation, or regulatory pressure):
- Single-title hyper-casual gaming — economics broken for new entrants.
- Generic English-medium K-12 EdTech — losing share to vernacular and skill-based alternatives.
- Generalist news apps — specialised niche news outlets are growing in their place.
- Crypto exchange apps — regulatory pressure persists, CPI economics underwater.
A nuance the headline winners/losers framing misses: "losing" categories can still be reasonable bets if you have a defensible niche position. We have seen a hyper-casual studio focused on a single sub-genre (cooking sims, idle tycoon) outperform multi-title generalist publishers by 3-4x on retained-user economics. Saturated does not mean closed. It means the generalist play is closed; the specialist play often remains wide open. For an example of how niche positioning compounds, see our mass user acquisition strategy guide.
What should you expect over the next 24 months?
Six structural shifts will define India app marketing through 2027. Plan for them now; they will be table stakes by 2027 H2.
- AI features in app stores — both Apple Intelligence and Google's AI features are starting to surface app actions and content directly in OS-level UI. This is a brand new discovery surface to optimise for, and the early movers will lock in significant share. App Store Connect is already exposing some of the metadata fields these surfaces will read.
- Tier-2/3 install growth continues outpacing metros for the next 24-36 months. Treat geo-splitting as default, not advanced.
- Vernacular content investment becomes table stakes for any India-focused app aspiring to scale beyond metros. Apps without serious regional-language strategy in 2026 will lose share to vernacular-first competitors.
- iOS share will slowly grow from ~3% to ~5% by end-2027 based on premium device adoption trends. Worth investing for high-LTV categories now; still Android-first for volume categories.
- Quick commerce and instant categories remain the most expensive UA environments in India — plan for further CPI inflation through 2027.
- Government-driven categories (financial inclusion, EdTech for state boards, healthcare for rural, gig-worker platforms) likely to grow from PLI, Digital India and adjacent initiatives. IAMAI's policy reports are the cleanest source on direction here.
The meta-trend underneath all six: India is no longer one market. It is fragmenting into 8-15 distinct sub-markets by geography, language, income tier, and platform. The agencies, publishers and app teams who treat that fragmentation as a strategic asset — pricing, creative, onboarding and channel mix tuned per sub-market — will compound advantage through 2027. Teams still running single-creative, single-bid, single-region campaigns will see their effective CPIs deteriorate quarter over quarter even as the headline market grows.
Get a portfolio-specific outlook based on these trends, or read our companion first-year app marketing budget guide for the operational layer.
Frequently Asked Questions
Where do these numbers come from?+
A combination of our internal portfolio (300+ apps under management since 2013), public reports from data.ai / Sensor Tower / AppMagic, and AppsFlyer / Adjust India market data, cross-referenced with TRAI and IAMAI connectivity data.
Are CPIs going up or down overall?+
Bifurcating. Up in most categories due to auction density (fintech, health insurance, quick commerce, dating). Down in a few categories where competition has exited (hyper-casual, EdTech post-correction). The blended India CPI number masks both extremes.
Is iOS worth investing in for India?+
For high-LTV verticals (fintech, premium ecommerce, productivity SaaS) yes — iOS users in India over-index on willingness to pay 3-5x. For volume-driven verticals, Android-first remains the correct call until iOS share crosses ~5% projected for end-2027.
How fast is quick commerce growing?+
Install volume up 60-80% YoY in 2025. CPIs inflated correspondingly (+47% YoY to ₹140). Highest growth category by both metrics — and the most expensive UA environment in India in 2026.
Should new apps avoid saturated categories?+
Not necessarily — saturated does not mean closed. New entrants with strong niche positioning still win consistently. But avoid head-on generalist competition with well-funded category leaders; the specialist play is almost always the better risk-adjusted bet.
How much should we invest in vernacular content?+
Treat it as table stakes for any India-focused app targeting beyond Tier-1 metros. At minimum: Hindi store listing and creative variants. For scale: localised onboarding, in-app copy, and 2-3 regional languages relevant to your target geography.
Which channel should we add first if we are only on Google UAC today?+
Meta Advantage+ for almost any consumer category. The setup overhead is low, creative requirements overlap with UAC, and it is the fastest-growing scalable channel in India after UAC itself. YouTube Shorts is a strong second add if your category indexes on video.
Sources
- Statista — India Smartphone Users Forecast — Source for 880M smartphone user base and growth trajectory through 2027
- data.ai — State of Mobile — Global mobile usage benchmarks and India platform revenue distribution
- AppsFlyer — State of App Marketing — Vertical CPI trend data and global category benchmarks
- AppsFlyer Performance Index — Quarterly benchmarks for install velocity, retention, and channel quality
- Meta — Advantage+ App Campaigns — Official Meta documentation on Advantage+ setup and case material
- TRAI — Telecom Regulatory Authority of India — Connectivity, 5G coverage and rural broadband expansion data
- IAMAI — Internet and Mobile Association of India — Policy direction and digital economy reports for India
- IRDAI — Insurance Regulatory and Development Authority — Digital insurance framework driving health insurance category growth
About the author
Amol Pomane — Founder, Vmobify
Amol leads Vmobify, a mobile app growth agency that has driven 30M+ downloads and ranked 54K+ keywords across 300+ apps since 2013. He writes about ASO, paid user acquisition, retention, and the operational reality of scaling mobile apps in India and global markets.
Free Growth Audit
See exactly how to scale your app with 13+ years of expertise behind you.
Get My Strategy