Buy Android App Installs: Channels, Pricing and Scale in 2026
Android installs are structurally cheaper than iOS, but only if you know which channels to use, how to protect quality, and how to time a burst that actually moves Google Play rankings. This is the complete 2026 playbook.
On this page
- Why do app marketers prioritise buying Android installs first?
- Which channels can you use to buy Android app installs?
- Is Google App Campaigns the most cost-effective Android install channel?
- How does Meta Advantage+ deliver Android app installs?
- How do CPI networks work for bulk Android app installs?
- How do you run a bulk Android install campaign without violating policy?
- What does it cost to buy Android app installs in 2026?
- How does Vmobify run Android install campaigns at scale?
- How do you measure quality after buying Android app installs?
- Frequently Asked Questions
Why do app marketers prioritise buying Android installs first?
Android commands roughly 72% of the global smartphone install base, and its open ecosystem makes it structurally cheaper and faster to acquire installs than on iOS — which is why Android is the first scaling market for the majority of apps we manage. The combination of larger addressable audience, lower CPI floors, and a more permissive attribution environment means that a given media budget consistently delivers 40–60% more retained users on Android than the same budget deployed on iOS.
There are three structural reasons Android CPIs are lower. First, advertiser competition is thinner: large Western brands historically skew toward iOS, leaving Android auctions — particularly in emerging markets — with less bidding pressure. Second, Android's install flow requires fewer taps: users tap an ad, land on the Play Store, tap "Install," and the app downloads in the background. iOS adds an App Tracking Transparency prompt that interrupts the funnel and depresses measured conversion rates. Third, India — the world's largest Android market by device count — has hundreds of millions of active users and CPIs that still start at ₹5 for broad hyper-casual categories.
Across our 300+ apps managed since 2013, Android has been the launch platform of choice for the majority of clients with budget constraints or aggressive volume targets. The unit economics are simply more forgiving, and the Google Play ranking algorithm is explicit that install velocity in the launch window is a primary signal — meaning purchased installs that pass quality thresholds directly translate into organic ranking lift.
The other underappreciated factor: Android's fragmented device landscape means your app is reachable on phones costing ₹5,000 and phones costing ₹1,00,000. That breadth is the foundation of India's Tier-2/3 opportunity — hundreds of millions of users on mid-range Android devices, under-targeted by most advertisers, reachable at CPIs that Western markets cannot match. Understanding which Android channels, markets, and strategies produce retained installs at scale is what this guide covers in full.
Which channels can you use to buy Android app installs?
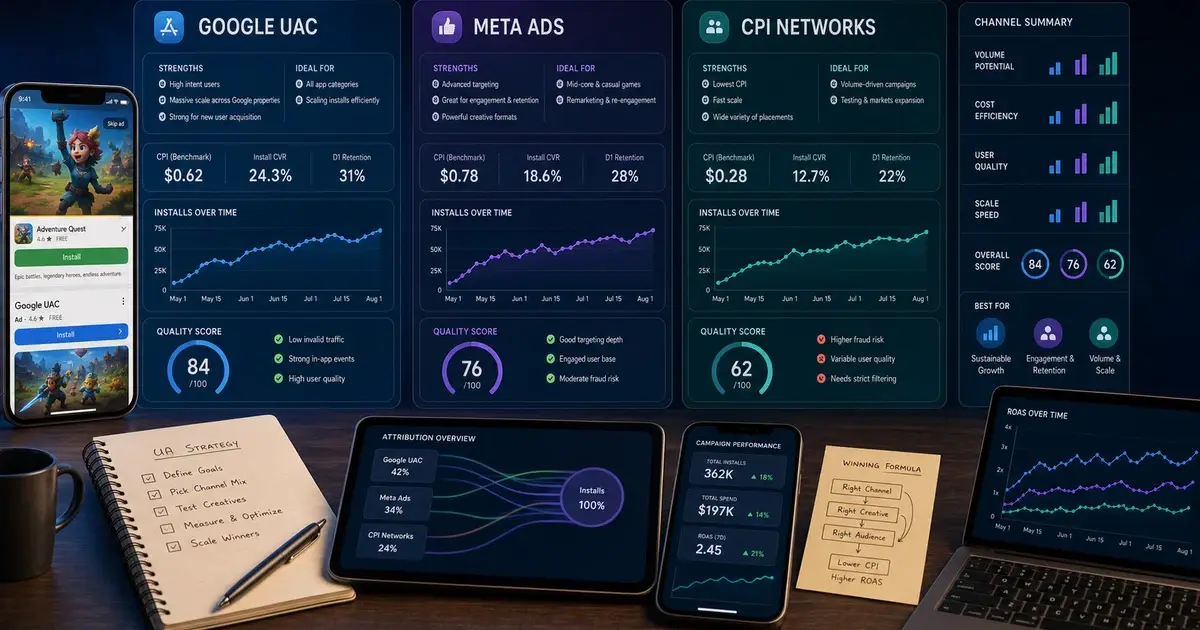
There are five primary channels for buying Android app installs in 2026: Google App Campaigns (UAC), Meta Advantage+ App Campaigns, managed CPI networks, programmatic DSPs, and influencer-led install pushes — each with different cost floors, quality profiles, and scaling ceilings.
The decision of which channel to lead with depends on your objective. If you need maximum volume at the lowest possible CPI and have a broad demographic app, Google UAC and a CPI network combination is the default playbook. If you need high-value users who make in-app purchases, Meta Advantage+ with value-optimised bidding outperforms the others. If you need a ranking burst in 5–7 days, a coordinated stack of all three is the answer.
- Google App Campaigns (UAC): The widest-reach Android install channel. Machine learning places your ads across Search, Play, YouTube, Discover, and Display from a single campaign. Unmatched for scale at controlled CPA. Covered in full in the next section.
- Meta Advantage+ App Campaigns: Strongest for consumer apps with broad demographic appeal. Advantage+'s automated audience system consistently outperforms manual interest targeting for Android installs. Best combined with in-app event tracking to unlock value optimisation.
- CPI networks: Non-incentivised publisher inventory managed by networks like ironSource, AppLovin, and our own vetted CPI publisher set. Ideal for burst volume — you can commission 10,000 installs in a 72-hour window. Quality is only as good as the network's fraud filtering.
- Programmatic DSPs: DV360, The Trade Desk, InMobi, and regional DSPs like Moengage Inform. Useful for precise audience targeting at scale when you have first-party data to upload as custom audiences. CPIs are higher than UAC but user quality is typically excellent.
- Influencer-led installs: Indian creators on Instagram Reels and YouTube Shorts deliver effective CPIs under ₹15 for category-matched audiences. The install spike is harder to time precisely but drives very high-quality users because intent is organic.
Our detailed channel comparison guide covers the trade-offs across UAC, Meta, and CPI networks with benchmark data from our Android portfolio. For a full overview of what managed user acquisition looks like across these channels, see our UA services page.
Is Google App Campaigns the most cost-effective Android install channel?
For most Android app categories, yes — Google App Campaigns is the single most cost-effective channel for buying installs at scale, because it combines the widest reach with machine-learning optimisation that improves efficiency the longer it runs. Google's official UAC documentation describes how the system places ads across Search, Google Play, YouTube, Discover, and the Display Network from a single campaign — meaning you are buying from every major Android touchpoint simultaneously without managing separate campaigns for each.
The reason UAC is structurally efficient for Android specifically: Google owns the Play Store. When a user is actively browsing Google Play search results, UAC can serve your app directly into that search results page at the moment of highest intent. That Play Store inventory alone delivers CPIs 20–40% lower than equivalent inventory on third-party networks, in our Android portfolio's experience.
How to set up UAC for maximum Android install efficiency:
- Bidding strategy: Start with target-CPI bidding for the first 50–100 conversions. The system needs a calibration period — underbidding early starves it of signal and slows the learning phase. Once you have 100 conversions at a stable CPI, switch to target-ROAS if your app has monetisation events to optimise toward.
- Creative inputs: Upload at minimum 5 text assets, 5 image assets, and 5 video assets per ad group. UAC auto-assembles combinations and tests them; more creative inventory means the algorithm has more signal to learn from. Apps with fewer than 5 assets per type consistently underperform apps with 10+.
- In-app conversion events: Register post-install events in Google Ads — registration, first purchase, subscription start, level completion. UAC optimises toward the events you tell it to track. If you only pass "install" as a conversion, you will get cheap installs that do not engage. If you pass "subscription start," you will pay more per install but those installs will be worth far more.
- Geographic segmentation: Split India Tier-1 cities from Tier-2/3 in separate campaigns. Metro auctions run 2–3x more expensive than Tier-2/3 for identical verticals. Separating them lets you scale both at their natural price point rather than blending budgets inefficiently.
Realistic UAC ramp timeline: days 1–7 are the learning phase — CPIs are volatile and often above target. Days 7–14 see the algorithm stabilise and CPIs drop toward target. Days 14–30 are when you can begin scaling budgets. We have seen UAC campaigns scale from ₹2L to ₹20L weekly spend inside 30 days once the learning phase completes — provided creative inventory and MMP tracking are set up correctly before launch.
How does Meta Advantage+ deliver Android app installs?
Meta Advantage+ App Campaigns automate audience selection, placement, creative testing, and budget allocation across Facebook, Instagram, Audience Network, and Messenger — making them the fastest "start spending and let the system learn" option for Android install campaigns. Meta's official Advantage+ documentation confirms the product replaces manual audience setup with a single broad signal: your app category, your target geography, and your age band.
For Android specifically, Advantage+ works especially well in two scenarios. First, apps with a broad demographic audience — utilities, entertainment, social, finance — where Meta's behaviour-graph can find users across a wide audience pool. Second, apps with strong creative assets, because Advantage+ creative testing is aggressive: it will rotate through all uploaded variants and concentrate spend on winners within 48–72 hours of launch.
The settings that determine Android Advantage+ performance:
- Audience inputs: Country plus age band only. No interest layering, no detailed demographic overlays. Meta's internal research consistently shows broad targeting outperforms narrow audiences for Advantage+ campaigns because the algorithm has more data points to work with at scale.
- Optimisation event: Week 1 — optimise for app install. Week 2 onwards — switch to a deeper in-app event (first purchase, subscription, registration completion) once you have 30+ post-install conversions tracked. Jumping straight to value optimisation before hitting that conversion volume produces under-trained models and unstable CPIs.
- Creative volume: Launch with at minimum 8 creatives. Mix: 3 UGC-style video hooks, 3 motion-graphic benefit demonstrations, 2 static benefit callouts. Pause anything below your top-quartile CPI after 72 hours. Meta creative fatigues faster than Google UAC creative — plan a fresh creative rotation every 10–14 days.
- Budget floor: Advantage+ needs a minimum ₹3,000–₹5,000 daily budget per campaign to exit the learning phase in a reasonable timeframe. Below that floor, the system under-samples and produces noisy CPI data.
In our Android portfolio, Meta Advantage+ typically delivers CPIs of ₹40–₹90 for utility apps and ₹80–₹200 for fintech apps in India. South-East Asian markets run $0.40–$1.20 per install. US markets run $2–$6 per install. These ranges assume a working creative rotation — apps with only 1–2 creatives consistently sit at the top of these ranges. For a complete Meta install campaign structure covering Android and iOS, see our user acquisition service page.
How do CPI networks work for bulk Android app installs?
CPI networks are the fastest mechanism for adding bulk Android installs in a compressed window: a quality network can deliver 5,000–50,000 real installs in 72 hours by distributing your campaign across a publisher inventory of apps, rewarded video placements, and interstitial ad units. The cost-per-install model means you pay only for completed installs — not for clicks or impressions — which makes CPI networks the most predictable budget channel when you need a precise volume target.
How the mechanics work: a CPI network aggregates publisher apps (games, utilities, content apps) that carry ad inventory. When a user completes an action in one of those publisher apps — watches a rewarded video, taps an interstitial — they see your install ad. A tap takes them to the Google Play Store page, where they install your app. The network's tracking SDK attributes the install back to the publisher and charges you the agreed CPI.
The quality differentiation that matters most:
- Non-incentivised vs incentivised traffic: Non-incentivised traffic (the user sees your ad without a reward for installing) produces organic-quality retention. Incentivised traffic (the user earns in-game currency for installing) produces D1 retention of 5–15% — far below category benchmarks. Always specify non-incentivised traffic when commissioning a CPI burst. Google Play's Developer Policy explicitly prohibits incentivised installs designed to manipulate rankings.
- Device-level fraud filtering: The difference between a quality CPI network and a fraudulent one is the fraud-filtering layer. Quality networks run real-time device fingerprinting, install-velocity anomaly detection, and cross-reference with MMP rejection lists. Our own CPI network integrates with AppsFlyer and Adjust reject signals — any install flagged by those MMPs is not charged.
- Publisher category matching: A finance app buying installs through gaming publisher inventory will see poor D7 retention because the audience is wrong. Quality networks allow publisher category targeting — gaming installs from gaming publishers, finance installs from news and utility publishers.
- Geographic granularity: India Tier-2/3 CPI inventory is abundant and cheap — ₹5–₹15 for non-incentivised installs in smaller cities. Tier-1 (Mumbai, Bangalore, Delhi) runs ₹18–₹40. Separating geography in your brief avoids overpaying for Tier-1 volume when your target audience is Tier-2/3.
AppsFlyer's Performance Index consistently ranks the top CPI networks by post-install retention quality — this is the best independent benchmark for evaluating which networks produce real users versus inflated install counts. Our CPI network service runs exclusively non-incentivised, MMP-verified inventory with a D7 retention guarantee on qualifying verticals.
How do you run a bulk Android install campaign without violating policy?
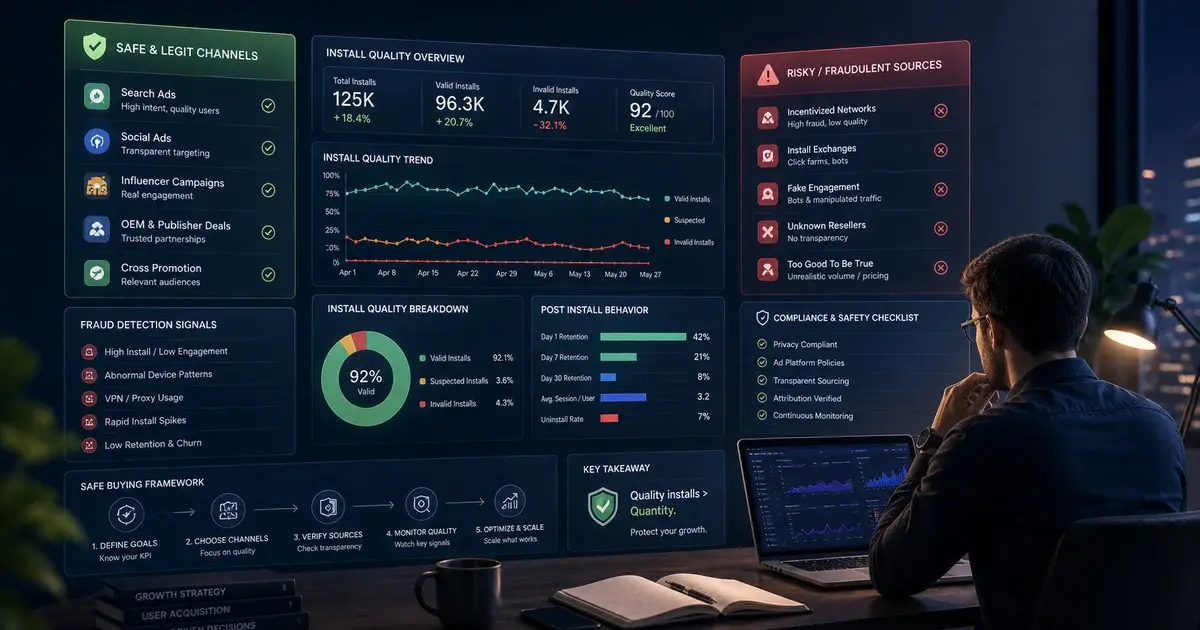
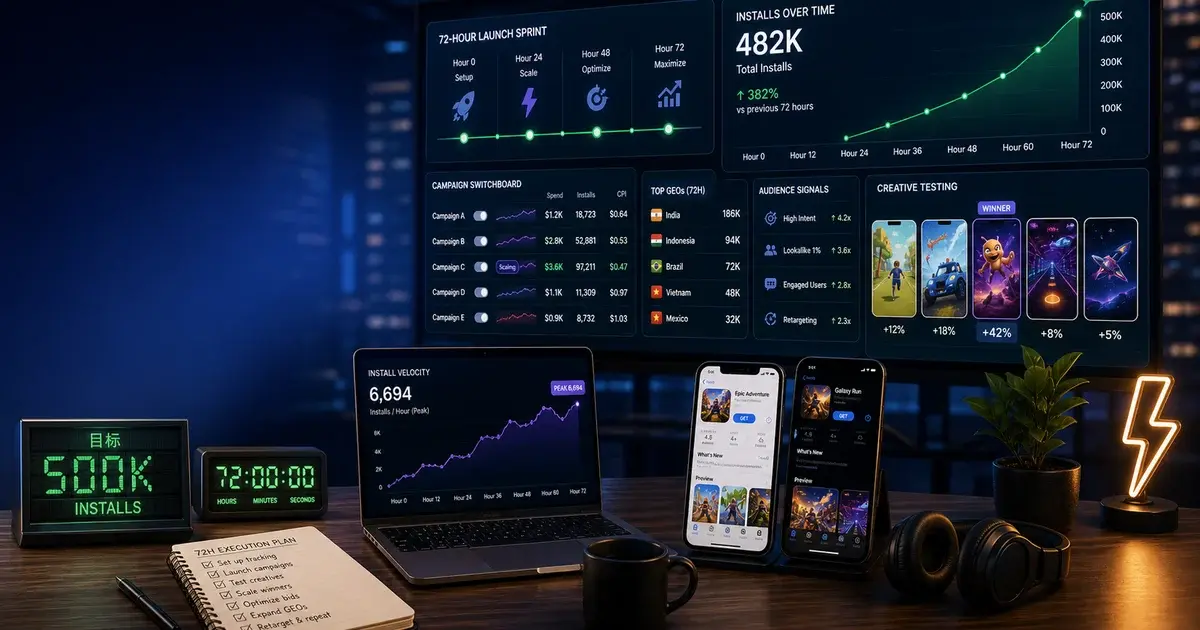
Every Android scaling story in our portfolio has the same structure: a coordinated 5–7 day burst across Google UAC, Meta Advantage+, and a non-incentivised CPI network, timed to create install velocity that looks exactly like what a genuinely popular app would generate — because it is genuinely popular demand, just accelerated. The critical distinction between a legitimate bulk campaign and a policy violation is the traffic source: real users from real devices responding to real ads, versus bot farms, install farms, or incentivised manipulations.
Google Play's Developer Content Policy prohibits actions that artificially inflate install counts through automated means, bots, or incentivised schemes where the user has no genuine interest in the app. It does not prohibit — and explicitly supports — buying advertising across legitimate channels. The distinction matters enormously: advertising spend is encouraged; install manipulation is a bannable offence.
The 5–7 day burst playbook that we use across our Android portfolio:
- Day 0 (pre-burst): MMP configured and verified. Google Play listing optimised — title, short description, screenshots, and icon all converted and A/B tested. All paid campaigns built, creatives uploaded, campaigns in "draft pending launch" status.
- Day 1: Launch Google UAC and Meta Advantage+ simultaneously. Set UAC to volume bidding (target-CPI at 1.2x your goal CPI to ensure the algorithm can spend freely). Activate CPI network burst order for 10,000–30,000 installs over 5 days.
- Days 2–4: Monitor MMP dashboard hourly. Flag any geographic anomalies — a sudden spike from an unexpected country usually signals fraud from a CPI sub-publisher. Pause that sub-source immediately and demand credit from the network. Rotate UAC creative; pause any creative with CPI more than 40% above your top performer.
- Day 5–7: The burst completes. Install volume is concentrated — Google Play's algorithm reads this as a genuine viral moment. Category ranking typically climbs 5–20 positions in this window.
- Day 8–30: Shift from burst mode to sustained acquisition at your target CPA. Organic install rate should now be running at 1.5–3x pre-burst baseline from the ranking lift — which reduces your blended CPI as organic installs carry zero media cost.
One safeguard that every bulk campaign must include: an ASO-optimised store listing. Paid traffic driving to a weak listing wastes the burst, because your Play Store conversion rate amplifies or undermines everything. If your listing converts at 30% and your competitor's converts at 60%, they are effectively buying installs at half your cost. Our ASO service runs the store listing optimisation in parallel with any UA campaign to ensure the two compound each other.
What does it cost to buy Android app installs in 2026?
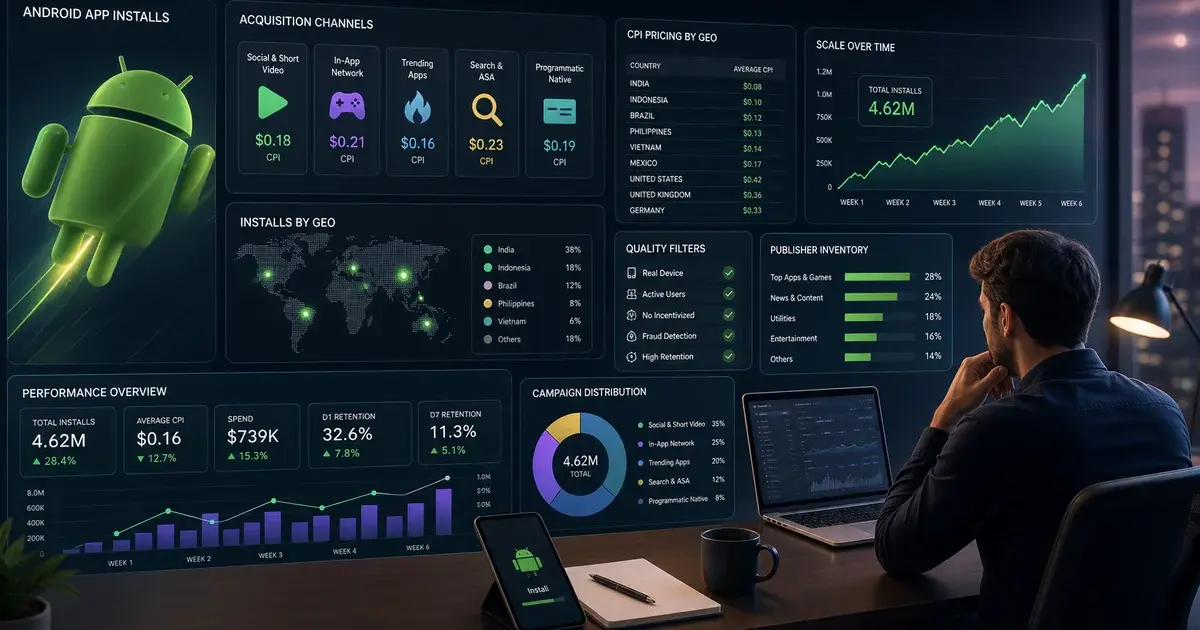
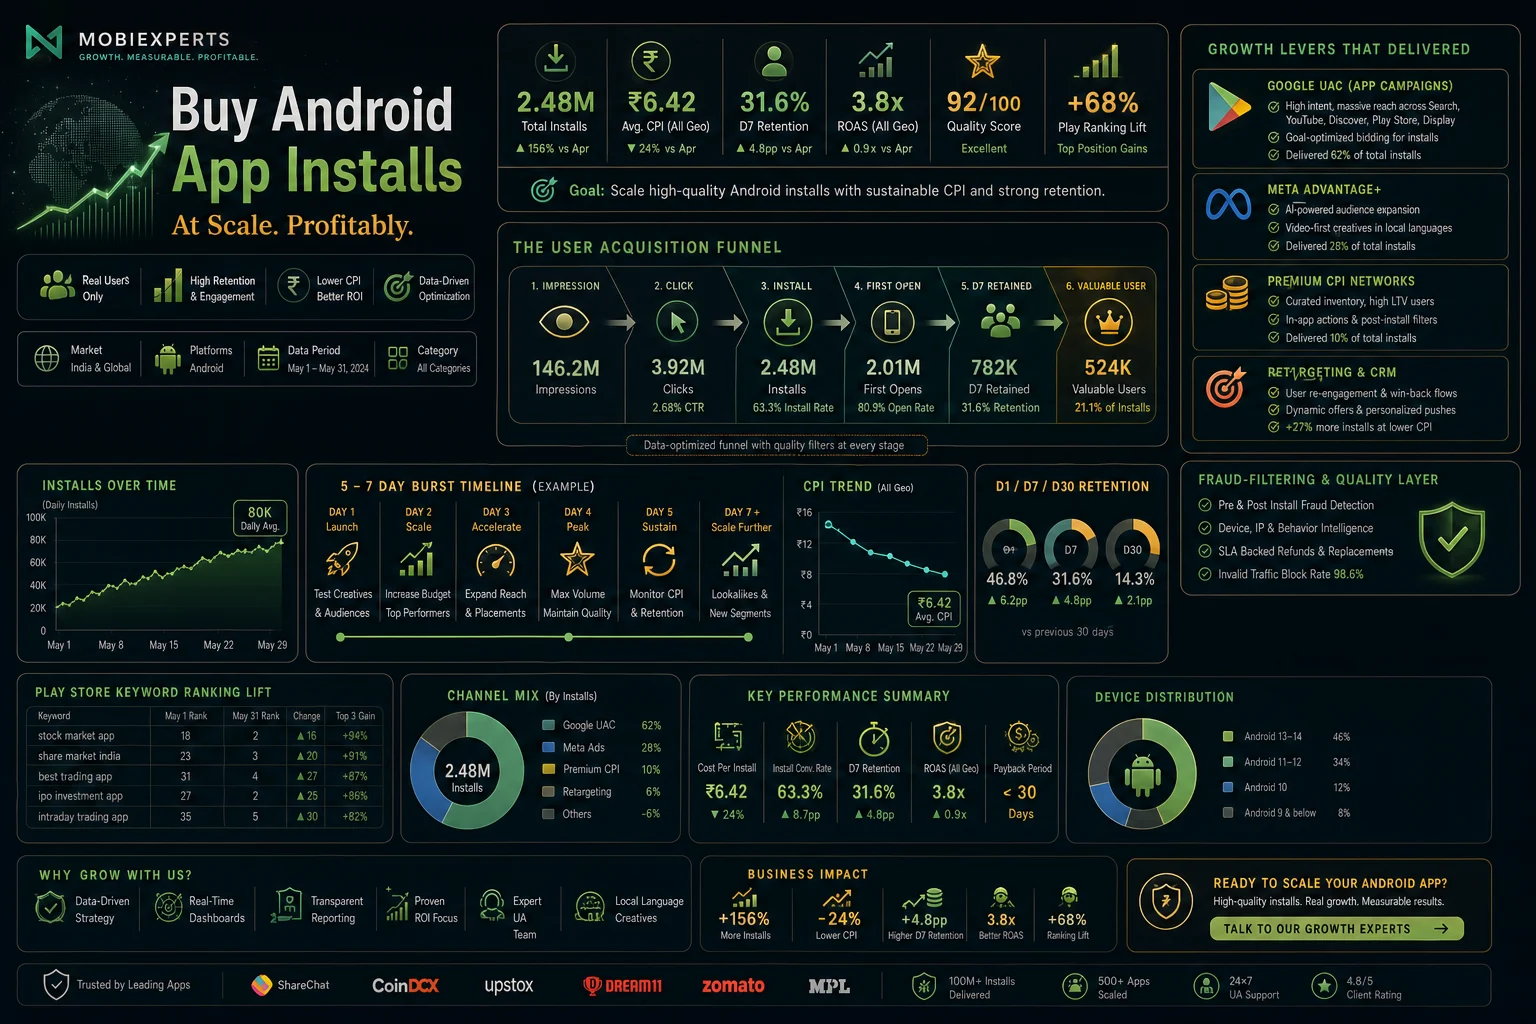
Android CPI benchmarks in 2026 vary by market, vertical, and channel — but the headline figure is that Android installs are consistently 40–60% cheaper than iOS installs for equivalent user quality, in every geography we operate. The pricing below reflects real campaign data from our Android portfolio, not media kit estimates.
India market CPIs (non-incentivised, real-user traffic)
- Tier-2/3 cities (hyper-casual games): ₹5–₹15 CPI via CPI networks; ₹8–₹20 via Google UAC
- Tier-2/3 cities (utility / productivity): ₹12–₹25 CPI via CPI networks; ₹18–₹40 via Meta Advantage+
- Tier-1 cities (Mumbai, Bangalore, Delhi) — fintech / BFSI: ₹40–₹120 via UAC; ₹80–₹200 via Meta
- Tier-1 cities — e-commerce / D2C: ₹35–₹90 via UAC; ₹50–₹120 via Meta
South-East Asia CPIs (non-incentivised)
- Indonesia, Vietnam, Philippines — gaming: $0.15–$0.35 via CPI networks; $0.30–$0.60 via UAC
- Singapore, Malaysia — fintech / utility: $0.80–$2.00 via UAC; $1.20–$3.00 via Meta
US / Western markets — Android CPIs
- Gaming: $1.00–$2.50 via UAC; $1.50–$4.00 via Meta
- Finance / BFSI: $3.00–$8.00 via UAC; $4.00–$12.00 via Meta
- E-commerce: $1.50–$5.00 via UAC; $2.00–$6.00 via Meta
Three factors that move you toward the bottom of these ranges: a high-quality store listing (better conversion rate means your ad spend buys more installs per rupee/dollar), strong creative assets (UAC and Meta both lower effective CPIs when their algorithms find high-performing creatives), and a broad geographic target that includes Tier-2/3 markets even for apps that eventually monetise in Tier-1. Starting with cheaper traffic to build retention data is a standard playbook — you then use that cohort data to bid more aggressively for high-LTV Tier-1 users.
For a detailed breakdown of how these CPIs compare to iOS equivalents and which verticals see the biggest cross-platform gap, see our guide to buying app installs safely. For budget planning and campaign design, speak to our team — we scope Android campaigns to specific volume and CPI targets rather than open-ended retainers.
How does Vmobify run Android install campaigns at scale?
Vmobify's Android install service combines managed Google UAC, Meta Advantage+, and our own vetted CPI publisher network into a single coordinated campaign — with device-level fraud filtering via AppsFlyer and Adjust, and a D7 retention guarantee on qualifying verticals. We do not sell raw install volume: we manage outcomes, and every campaign is measured against retention benchmarks, not just install counts.
In our Android portfolio, we have run scaling campaigns for apps across gaming, fintech, edtech, health, e-commerce, and utilities — and the operating model is consistent across all of them. Before a single rupee is spent on media, we run a pre-campaign audit covering store listing conversion rate, MMP configuration, and in-app event mapping. Campaigns that skip this audit consistently underperform because they are feeding ad spend into a system without measurement infrastructure.
The four layers of our Android install operation:
- MMP-first measurement: Every campaign integrates with the client's AppsFlyer, Adjust, or Singular account before launch. We configure install attribution, in-app event postbacks to Google Ads and Meta, and fraud-rejection rules. This is mandatory — without it, UAC's machine learning cannot optimise toward in-app events, and you are flying blind on quality.
- Non-incentivised CPI publisher network: Our publisher set covers 2,000+ Android publisher apps across India, South-East Asia, MENA, and Western markets. Every publisher is manually reviewed and categorised. Sub-publishers flagged by AppsFlyer or Adjust are removed from rotation in real time. India Tier-2/3 publisher inventory in our network runs at ₹5–₹20 CPI — among the cheapest quality non-incentivised Android inventory available.
- Google UAC management: We manage UAC campaigns across every Android-relevant Google property. Campaign structure follows a proven segmentation: geography tiers separated, creative ad groups split by format (video / image / HTML5), and bidding transitions from tCPI to tROAS as the algorithm accumulates conversion data. Average CPI improvement of 25–40% from campaign launch to 30-day mark across our managed portfolio.
- D7 retention guarantee: On qualifying verticals (gaming, utility, lifestyle), we guarantee that D7 retention meets category benchmarks — games at 15%+, utilities at 12%+. If the cohort falls below benchmark, we replace installs at no charge. This guarantee exists because our fraud-filtering and publisher selection is tight enough to underwrite it.
Our Android campaigns are scoped to specific objectives: a ranking push for a new launch, a competitive defence for an incumbent, or sustained monthly acquisition at a CPA target. Every scope is costed transparently. For more on how we approach user acquisition at scale — including how ASO compounds paid UA results — see our services pages. To discuss a specific Android campaign, contact our team directly.

How do you measure quality after buying Android app installs?
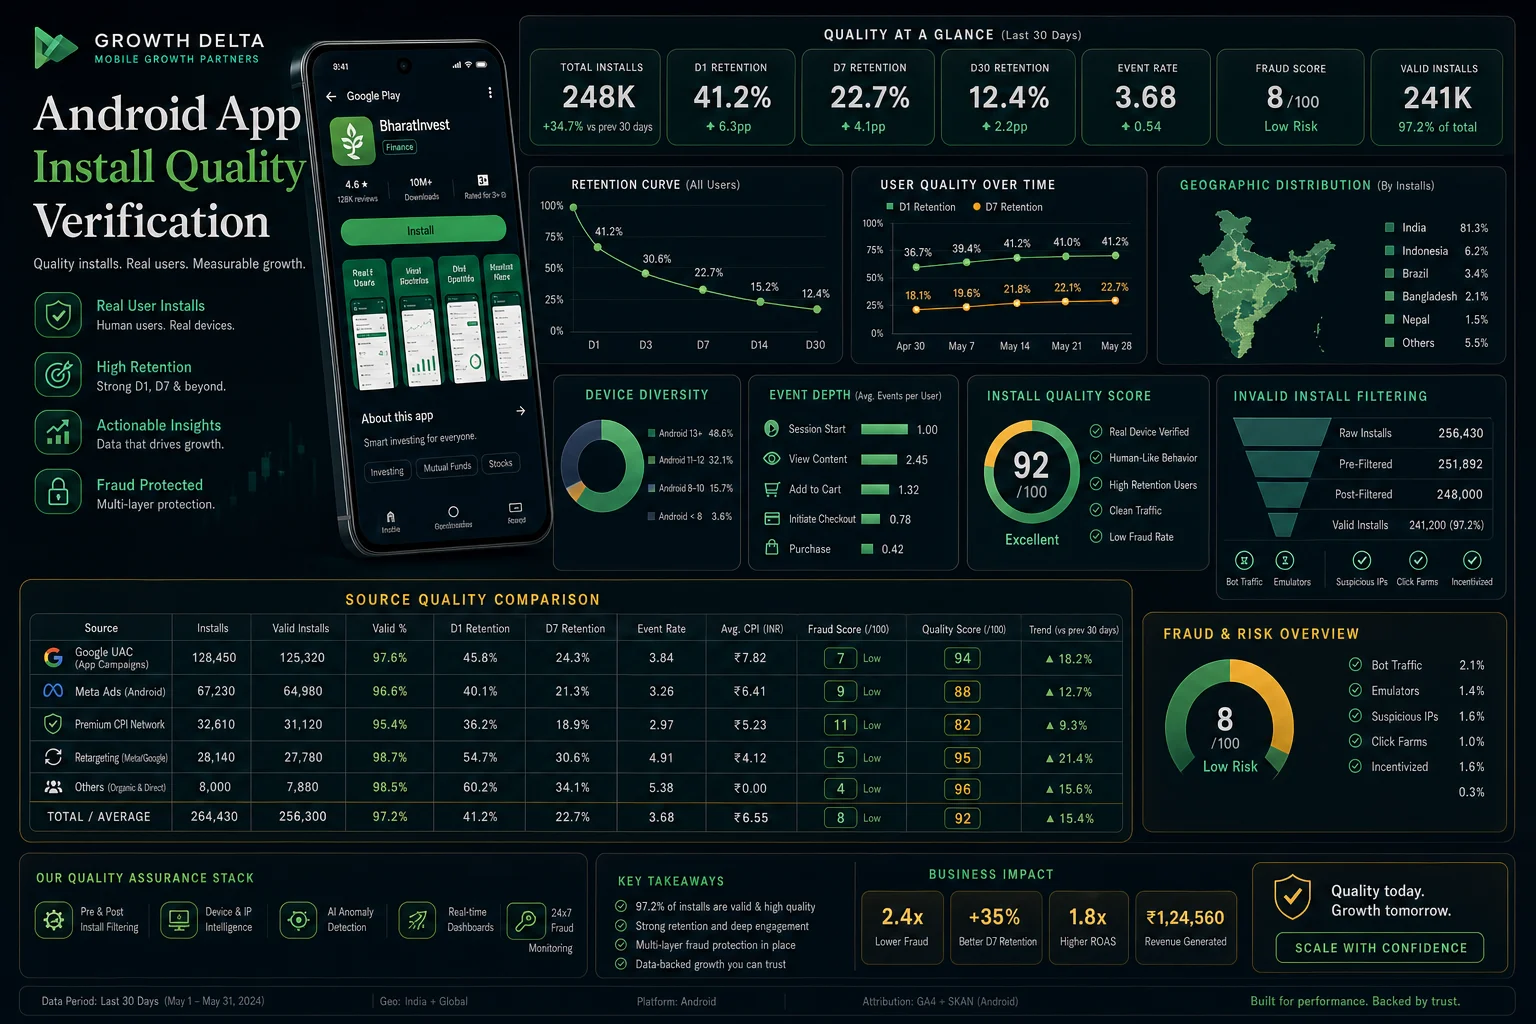
Buying Android installs is only half the job — measuring whether those installs are real, retained users requires a specific set of quality signals that must be tracked from day one. In our experience, teams that buy Android installs without a measurement framework in place cannot distinguish good traffic from bad, cannot optimise toward what works, and end up paying for installs that damage their Play Store ranking rather than improving it.
The four quality signals that matter most, in priority order:
- D1 retention vs category benchmark: Day 1 retention is the fastest signal that tells you whether an install cohort is real. Category benchmarks per AppsFlyer's Performance Index: casual games 25–40%, mid-core and strategy games 15–25%, utilities and productivity 15–30%, fintech 20–35%. A cohort arriving at 5–8% D1 retention is almost certainly incentivised or fraudulent traffic and should be disputed with the network immediately.
- Install velocity pattern: A legitimate paid campaign produces a smooth install curve — installs ramp up as the algorithm learns, plateau at campaign capacity, and taper off when the campaign ends. A fraud signal is an instant vertical spike followed by zero installs: this is the device-farm pattern where hundreds of installs arrive within minutes. Your MMP's install timeline chart makes this immediately visible. Google Play's algorithm is also sensitive to this pattern — an unnatural spike can trigger a ranking penalty rather than a boost.
- Geographic distribution: If you commissioned a campaign targeting India Tier-2/3 and 40% of installs are arriving from Indonesia or Pakistan, a CPI sub-publisher is cheating. Legitimate Tier-2/3 India traffic should show install density in states like Uttar Pradesh, Bihar, Rajasthan, Madhya Pradesh, and Maharashtra — not concentrated in metros, not in unexpected countries.
- MMP fraud-flag rate: AppsFlyer and Adjust run real-time fraud-detection and flag installs that match bot, farm, or click-injection patterns. A quality Android install campaign should show a fraud-flag rate under 5%. Rates above 10% indicate a bad sub-publisher or network and require immediate escalation. Any flagged install should be rejected and not charged — this is standard in any reputable CPI network contract.
Beyond these four primary signals, track D7 retention (the deepest leading indicator of LTV), session length and depth (bots install but never open), and in-app event completion rate (registration, tutorial completion, first purchase). Apps that sustain these signals above category benchmarks see continued organic ranking improvement well beyond the burst window. For a complete framework covering MMP setup, fraud rules, and post-install event configuration, see how our user acquisition service structures measurement from day one — and how ASO work runs in parallel to make every install count more.
Frequently Asked Questions
Which country or market gives the cheapest Android installs?+
India Tier-2/3 is the cheapest meaningful Android install market in the world, with non-incentivised CPIs of ₹5–₹20 for most categories. South-East Asian markets (Indonesia, Vietnam, Philippines) run $0.15–$0.35 for gaming. These markets have large, active user bases — they are not cheap because the users are low quality, but because advertiser competition is lower than in Western markets.
Does buying Android installs violate Google Play policy?+
Buying Android installs through legitimate paid advertising channels — Google UAC, Meta, or non-incentivised CPI networks — does not violate Google Play policy. What is prohibited is incentivised installs designed to manipulate rankings, bot-generated installs, and install farms. Google Play's Developer Content Policy is explicit on this. The test is simple: are real humans installing your app because they saw an ad? That is compliant. Are automated systems or paid-to-install users inflating your count? That is a violation.
Do I need an MMP before buying Android installs?+
Yes — MMP integration (AppsFlyer, Adjust, or Singular) is mandatory before any meaningful Android spend. Without it, you cannot measure install quality, attribute installs to the correct channel, suppress fraudulent traffic, or pass in-app conversion events back to Google UAC for value-based bidding. Google's own App Attribution guidelines require MMP integration for accurate in-app event reporting to the UAC algorithm. Running spend without an MMP configured is the single most common reason Android campaigns underperform.
What is the minimum budget for a Google UAC Android campaign?+
Google UAC requires a minimum budget sufficient to exit the learning phase — approximately 50 conversions in the first 7 days. At a target CPI of ₹30, that means a minimum daily budget of roughly ₹7,000–₹10,000 (about ₹50,000–₹70,000 for the first week). Below that threshold the algorithm under-samples and produces unstable CPIs. For US markets, the equivalent minimum is roughly $500–$1,000 per week. These are floors, not targets — meaningful scale starts at 3–5x these numbers.
What D7 retention benchmarks should I expect for Android installs?+
D7 retention benchmarks by category, per AppsFlyer's Performance Index: casual games 15–25%, mid-core and strategy games 10–18%, utilities and productivity 12–22%, fintech and BFSI 15–28%, health and fitness 12–20%. These are averages — top-quartile apps in each category run 30–50% above median. If your D7 retention is materially below these benchmarks for the traffic source you purchased, either the traffic quality is poor or your onboarding flow is losing users. Both need fixing before scaling spend.
How long after a burst campaign does Google Play ranking movement appear?+
In our Android portfolio, category ranking movement typically begins within 48–72 hours of a burst campaign launch and reaches its peak position within 5–7 days. Organic install rate elevation — the lasting benefit of the ranking lift — is usually visible by day 7 and sustains for 3–6 weeks post-burst before gradually normalising. The magnitude of sustained lift depends on post-install retention: bursts with strong D7 retention produce sustained organic lift of 1.5–3x baseline; bursts with poor retention produce a temporary spike that collapses by day 14.
Sources
- Google Ads App Campaigns Help — Official Google documentation on App Campaign setup and bidding
- Google Play Developer Policy — Official policy on app install incentivisation and fraud
- Google Play Launch Best Practices — Google's official guidance on launch and install velocity signals
- AppsFlyer Performance Index — Media source benchmarks across Android and iOS
- Meta Advantage+ App Campaigns — Meta's automated Android and iOS app install product
- Adjust resources — MMP measurement and fraud-detection benchmarks
- Sensor Tower blog — Google Play install trend data and store intelligence
- Sensor Tower — State of Mobile — Annual Android and iOS app download and engagement benchmarks
About the author
Amol Pomane — Founder, Vmobify
Amol leads Vmobify, a mobile app growth agency that has driven 30M+ downloads and ranked 54K+ keywords across 300+ apps since 2013. He writes about ASO, paid user acquisition, retention, and the operational reality of scaling mobile apps in India and global markets.
Model an install budget
Turn CPI and activation assumptions into acquisition scenarios.
Open free tool