Bill Payment App Case Study: 10M+ Installs in 8 Months
A newly launched Indian bill-payment, utility, and rent-payment app wanted volume and real transactions — fast, from a standing start in one of the most commoditised categories in India. In 8 months we drove 10M+ installs (6.84M through Google UAC alone at ₹5.77 CPI), a 4% install-to-payment conversion rate, and ₹100 crore-plus in payments processed. Here is the full-funnel Google + ASO + YouTube playbook that did it.

What was the brief and the starting position?
A newly launched Indian fintech app — built for utility bill payments, mobile and DTH recharges, and monthly rent payments — came to us at the hardest possible moment: day one, with no install base, no brand recall, and no transaction history, in a category already dominated by a handful of household-name super-apps. The brief was unusually concrete. They did not want "awareness". They wanted install volume at a defensible cost, and — more importantly — they wanted those installs to transact.
That second half of the brief is what made this engagement different from a standard user-acquisition push. Installs are cheap to manufacture; a paying, repeat-transacting user in a regulated payments category is not. The success metric we agreed on was never raw installs alone. It was the number of installs that reached a completed payment transaction, and the cost of acquiring each one of those.
The starting position was a blank slate. The app had just cleared its store reviews, the onboarding flow was live but untested at scale, and organic discovery was effectively zero — the listing was not yet indexed for the high-intent keywords that drive the category. There was no creative library, no in-app event taxonomy wired into the measurement stack, and no historical conversion data for any algorithm to learn from.
Against that, the ambition was large: cross the symbolic 10-million-install mark fast, build a genuinely transacting base, and do it primarily through Google's ecosystem — App Campaigns and YouTube — where the team believed the volume and intent lived. Across our 300+ apps managed since 2013, we have launched dozens of fintech and utility apps from zero, and we knew the only way to hit a number that size that quickly was a coordinated, event-optimised, full-funnel system — not a single install campaign run hot.
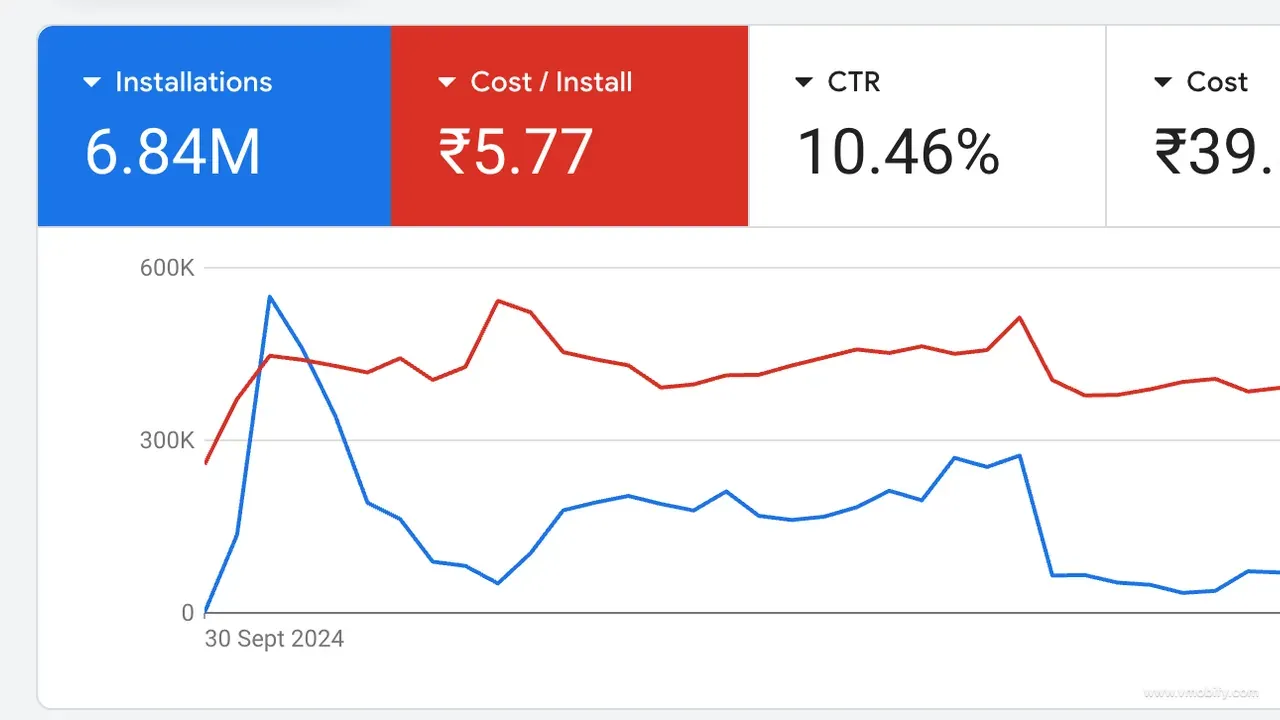
This case study documents exactly how that system came together: the Google UAC architecture, the TOFU/MOFU/BOFU funnel, the YouTube awareness layer, the ASO programme that indexed 38,000+ keywords, the daily creative engine, and the remarketing loop that turned first-time installers into repeat payers. The headline outcome — visible in the campaign dashboard further down — was 6.84 million installs through Google alone at a ₹5.77 blended cost-per-install, inside a total of 10M+ across all channels in eight months.
Why is the Indian bill-payment app market so hard to break into?
The Indian bill-payment and recharge category is brutally hard for a new entrant because the core function is commoditised, the incumbents are super-apps with near-universal distribution, and the unit economics leave almost no margin to "buy" loyalty. Five structural reasons make this one of the steepest climbs in Indian app marketing:
- The rails are shared, so the product is near-identical: Almost every bill-payment app in India settles through the same underlying infrastructure — UPI and Bharat BillPay. NPCI's own UPI statistics show billions of transactions flowing monthly across a system every app plugs into the same way. When the rails are identical, "pay your electricity bill" looks the same in every app — differentiation has to come from experience, trust, and offers, not the core function.
- Incumbents own the default habit: A handful of super-apps have spent years and enormous budgets making themselves the reflexive choice for recharges and bills. Displacing a habit is far harder than acquiring a first-time user — the new app has to be meaningfully better or cheaper at the exact moment of need.
- Trust weight is extreme: Users are warier of routing money through an unknown payments app than they are of trying a new game or utility. Review count, ratings, and brand familiarity carry disproportionate weight in the install decision, which structurally suppresses a new app's listing conversion rate until the trust signals catch up.
- Margins are thin to zero on the headline action: Bill payments and recharges are famously low-margin. That means the app cannot afford an expensive blended CPA the way a high-LTV gaming or lending app can — every rupee of acquisition cost has to be justified by downstream transaction value and repeat behaviour.
- Discovery is winner-take-most: The high-intent keyword set is small and fiercely contested, and category charts reward the apps already winning installs. A new app has no organic right to rank, so it has to manufacture both the indexing and the velocity before the algorithm will surface it.
India's digital-payments base is enormous and still growing — IAMAI's research on internet and digital-payment adoption shows hundreds of millions of users transacting digitally. That scale is the opportunity. But the same scale is why the incumbents are so entrenched. Knowing all five constraints up front shaped the entire plan: attack volume and transaction-quality at the same time, and never let the campaign optimise toward cheap installs that would never pay.
What did the full-funnel growth stack look like?
We ran six interlocking workstreams in parallel — Google App Campaigns at the core, wrapped in a TOFU/MOFU/BOFU funnel, fed by a daily creative engine, amplified by YouTube awareness and ASO, and closed out by remarketing — all measured against a single north-star event: the completed payment transaction. The mistake most teams make in a commoditised category is running one channel hot and judging it on installs. That produces a spike of cheap installs that never transact and a blended CPA that looks fine until you measure paying users.
The six layers, in execution order with heavy overlap:
- Event-optimised Google UAC — separate volume, registration, and payment-event campaigns so the algorithm could learn toward installs that transact, not just installs that land.
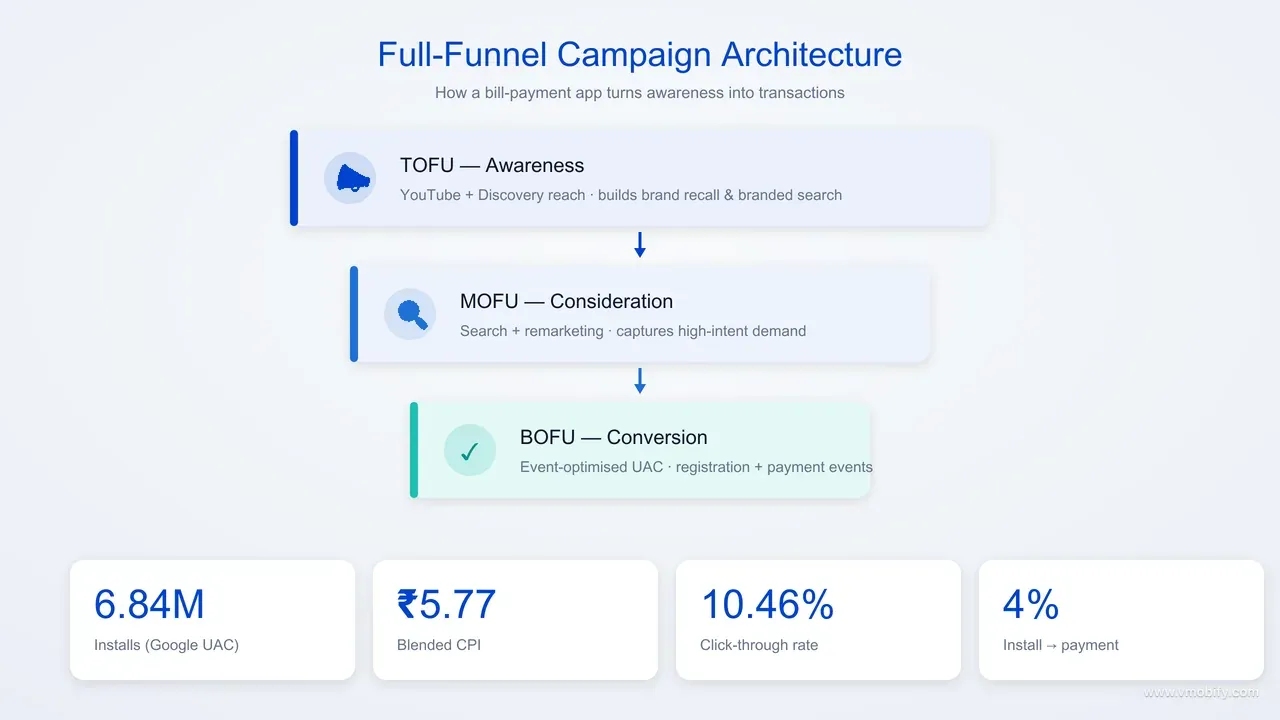
- Full-funnel segmentation — TOFU awareness, MOFU consideration, and BOFU conversion campaigns, each with its own channel mix, creative, and bid logic, so we were not paying conversion prices for awareness reach.
- YouTube awareness campaigns — top-of-funnel reach that built brand recall and branded-search volume, which fed cheaper, higher-intent demand into the lower funnel.
- ASO programme — keyword indexing, listing conversion-rate optimisation, and a category-rank push that built an organic install base to lower blended CPA as paid scaled.
- Daily creative engine — multiple new creatives shipped per day with continuous A/B testing, because creative volume — not budget — is the true ceiling on UAC scale.
- Remarketing and app-engagement campaigns — re-engaging installers who had not yet transacted, and nudging first-time payers into repeat behaviour to compound transaction value.
Each layer existed to serve the layer below it. YouTube made branded search cheaper. ASO turned that search into organic installs. The funnel made sure each rupee was spent at the right stage. And the payment-event optimisation made sure the whole machine pointed at transacting users, not vanity installs. The next sections unpack each one — what we actually executed, the settings that mattered, and which levers produced the disproportionate share of the result.
How did we structure the Google UAC campaigns for volume and events?
We split Google App Campaigns into three distinct objectives — a volume campaign for scale, a registration-event campaign for mid-funnel quality, and a payment-event campaign for the deepest signal — so the algorithm optimised toward genuinely valuable users instead of the cheapest possible install. Running a single install-only UAC would have flooded the app with users who never transacted; the multi-campaign structure is what kept the economics honest at scale.
- Volume campaign (installs): The scale engine. We started on target-CPI bidding to let Google's App Campaigns system find install-likely users across Search, YouTube, Display, Discover, and Google Play, then progressively tightened bids as data accumulated. This campaign carried the bulk of the 6.84M installs.
- App-event campaign — registration: Optimised toward account creation / first sign-in. This is the mid-funnel quality gate — it pulls the audience toward users who complete onboarding rather than installers who bounce on the first screen.
- App-event campaign — payment transaction: The deepest event. Once we had a steady daily volume of completed transactions feeding back, we let UAC optimise toward the payment event itself. This is where the 4% install-to-payment conversion was protected and scaled.
- Geographic separation: Tier-1 metros and Tier-2/3 markets ran in separate campaigns. Auction prices in metro India run materially higher than Tier-2/3 for the same vertical, so splitting them let us scale each at its correct cost rather than letting expensive metro inventory drag the blended CPI up.
- Creative-led ad groups: Every campaign was fed 10+ creative assets — a mix of video, HTML5, and static — because UAC's algorithm needs creative volume to optimise. Thin creative inventory is the single most common reason UAC underperforms.
The dashboard below is the consolidated Google App Campaigns view for the window: 6.84M installs at a ₹5.77 blended cost-per-install, a 10.46% CTR, across ₹39.5M (₹3.95 crore) of spend. A 10%+ click-through rate on cold app-install inventory at that volume is well above typical — the product of the creative engine in section ten feeding the auction enough fresh, high-performing assets to keep CTR high as spend scaled.
How did TOFU, MOFU, and BOFU campaign segmentation work?
We mapped every campaign to a funnel stage — awareness, consideration, or conversion — so that each rupee was spent at the right price for the right job, instead of paying conversion-grade prices to reach people who had never heard of the app. In a low-margin category, paying a BOFU price for TOFU reach is how acquisition economics quietly collapse. Segmentation prevented that.
- TOFU — awareness: YouTube and Discovery-led reach campaigns introduced the brand to cold audiences across utility, finance, and household-management interest pools. The job here was not installs — it was building recognition and branded-search demand that the lower funnel could harvest more cheaply. Measured on reach, view-through, and the lift in branded search, not on direct CPA.
- MOFU — consideration: Search campaigns on category and competitor-adjacent terms, plus remarketing to people who had engaged with TOFU creative but not yet installed. This stage caught users at the moment of intent — someone searching "pay electricity bill online" is mid-funnel by definition — and warmed up audiences that awareness had already touched.
- BOFU — conversion: The event-optimised UAC campaigns from the previous section, pointed at registration and payment events. This is where the budget concentrated once the upper funnel was feeding it warm, brand-aware demand. Because these users arrived already recognising the brand, their install-to-transaction rate ran ahead of pure cold traffic.
The compounding effect is the whole point. TOFU made the brand familiar, which lifted MOFU search CTR and lowered cold-traffic resistance, which made BOFU conversion cheaper than it would have been in isolation. We have seen this pattern hold across our portfolio: a well-fed top of funnel does not just add reach, it makes every downstream rupee work harder. Treating UAC as a standalone install machine — with no awareness layer above it — is leaving that compounding on the table. Our mobile user acquisition team builds every large-scale campaign this way for exactly this reason.
How did we push the payment-transaction event to a 4% conversion rate?
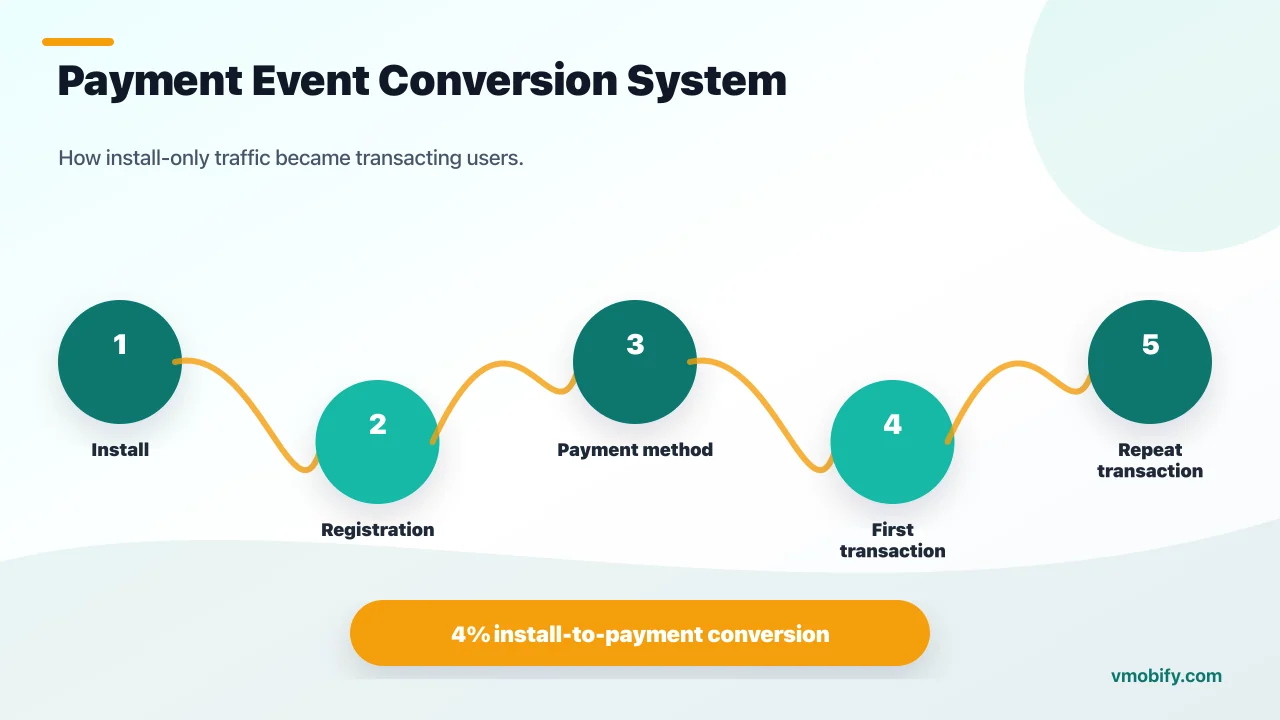
A 4% install-to-payment-transaction conversion rate is what made the entire campaign economically viable — and it came from instrumenting the deepest in-app event correctly, removing onboarding friction, and then letting the paid algorithms optimise toward that event rather than toward installs. In a category where the large majority of installs never complete a single transaction, getting one in twenty-five new installs to a completed payment is a strong number, and it is the metric the whole stack was built to protect.
The work that produced it, in order of impact:
- A clean event taxonomy first: Before a single rupee scaled, we wired a proper event hierarchy into the measurement stack — install, registration, payment-method added, first transaction, repeat transaction. Without the payment event firing reliably back to Google, no amount of "optimise for purchases" would work. Our mobile analytics team owns this layer because a mis-fired event silently wastes the entire media budget.
- Onboarding friction removal: We instrumented the funnel between install and first transaction and attacked every drop-off — a slow KYC step, a confusing payment-method screen, an unclear first action. Each percentage point recovered between install and first payment is a percentage point added directly to the conversion rate.
- First-transaction nudges and offers: Targeted first-payment incentives — small, time-bound, and only on the first transaction — gave new users a low-risk reason to cross from "installed" to "transacted". Crossing that line once dramatically raises the odds of a second.
- Value-based optimisation: Once the payment event was firing at sufficient daily volume, we shifted the relevant UAC campaigns onto the payment event and, where data allowed, toward transaction value — so the algorithm preferred users likely to transact, and to transact more.
The downstream effect compounded into real money. A 4% conversion across an install base this size, layered with repeat transactions driven by the remarketing loop, is what carried the app past ₹100 crore-plus in payments processed. Install-only optimisation would never have reached that — it would have bought a larger, cheaper, non-transacting base and a transaction line that never moved. Pointing the machine at the payment event from the start is the difference.
How did YouTube awareness campaigns change the growth trajectory?
YouTube awareness campaigns were the top-of-funnel engine that made everything below them cheaper — they built brand recall and branded-search volume that converted into lower-cost, higher-intent installs in the mid and lower funnel. In a trust-sensitive payments category, a user who recognises the brand before they reach the store listing converts at a higher rate than a cold installer who has never heard of it.
What we actually ran, and why it worked:
- Reach and view-led formats: Skippable in-stream and short-form video focused on a single, clear message — pay bills, recharge, and pay rent in one app — rather than feature dumps. A new payments brand needs to land one memorable association, not ten features.
- Interest and intent pools: We targeted household-management, utility, and personal-finance audiences where bill-payment intent naturally lives, keeping reach efficient rather than spraying broad.
- The branded-search halo: The clearest signal that awareness was working was branded search. As YouTube reach scaled, searches for the app's name climbed — and branded search is some of the cheapest, highest-converting demand available. That halo fed both paid Search and organic discovery.
- Creative consistency with the funnel: The awareness creative shared its visual language and core hook with the conversion creative, so a user who saw the YouTube ad recognised the app instantly when it appeared in a UAC placement or the store listing. Consistency is what turns reach into recall.
Because YouTube is part of Google's ecosystem, the awareness layer and the App Campaigns shared signals and audiences, making the handoff from awareness to conversion far tighter than stitching together two unrelated platforms would allow. This is also why we deliberately concentrated the budget on Google rather than splitting it across Meta and other networks for this client — when the goal is a single, coherent full-funnel system at scale, depth in one ecosystem beat breadth across several. We compare that trade-off in detail in our Google UAC vs Meta vs CPI breakdown.
What did the ASO programme deliver with 38,000+ indexed keywords?
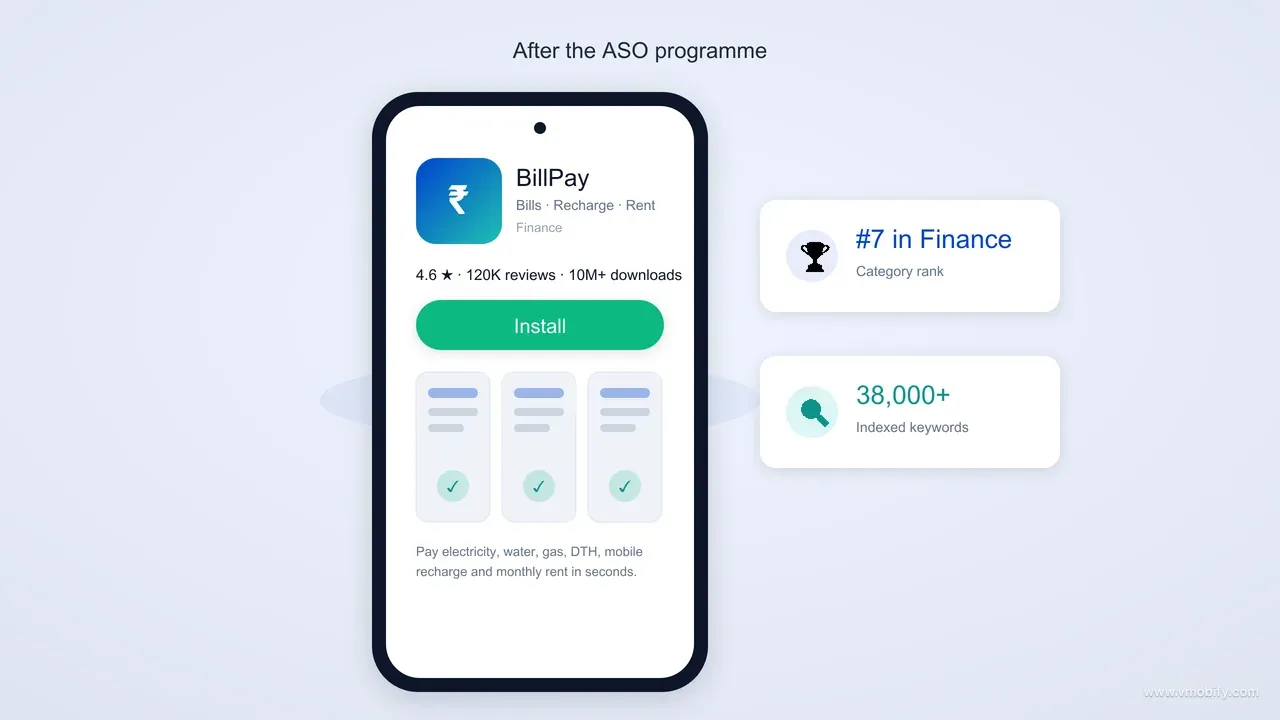
The ASO programme took the app from effectively unindexed to 38,000+ indexed keywords and a top-10 category rank — building an organic install base that progressively lowered blended CPA as paid spend scaled. Paid traffic gets expensive at the margin; organic installs are the lever that keeps the blended cost-per-install falling even as volume climbs. ASO is what built that lever.
- Keyword indexing at scale: A new listing indexes for almost nothing. We re-architected the title, short description, and long description so the app indexed for the full semantic field of bill-payment, recharge, and rent-payment queries — without keyword stuffing, which both stores penalise. Breadth of indexing (38,000+ keywords) is what lets a payments app appear across the thousands of long-tail "pay X bill" searches users actually type.
- Listing conversion-rate optimisation: Indexing only matters if the impressions convert. We ran structured experiments on the icon, the first screenshots, and the short description, leading with trust and the core job-to-be-done ("pay any bill in seconds"). SplitMetrics' research consistently shows the first screenshot carries the bulk of the install decision — we optimised it relentlessly.
- Category-rank push: Indexing breadth plus the paid-install velocity from UAC drove the app into a top-10 finance/utility category position — a discovery surface that compounds, because charting high earns impressions that earn more installs that hold the rank.
- Ratings and review velocity: Genuine review velocity, prompted at the right post-transaction moment, lifted the rating into a range where the trust gap against incumbents narrowed enough for the listing to convert at competitive rates.
The strategic value of ASO in a low-margin category is simple: every organic install is a paid install you did not have to buy. As organic share grew, the blended CPA across paid plus organic kept falling even while paid volume rose. Our app store optimisation team treats ASO and paid UA as one system for exactly this reason — they are not separate budgets, they are two halves of the same install economics.
How did remarketing and app-engagement campaigns drive repeat transactions?
Acquisition gets the install; remarketing and app-engagement campaigns are what turned installers into payers and one-time payers into repeat payers — and in a bill-payment app, repeat behaviour is the entire business. Bills recur monthly. An app that acquires a user and then lets them lapse has thrown away the only thing that makes the unit economics work: the second, third, and tenth transaction.
The re-engagement layer ran on three jobs:
- Installer-to-first-transaction recovery: A large share of installs complete onboarding but stall before the first payment. App-engagement campaigns and lifecycle messaging targeted exactly that cohort with a clear, low-friction reason to complete a first transaction — the single highest-leverage re-engagement audience in the whole funnel.
- Repeat-transaction reminders: Bills are predictable. Timely, well-targeted reminders around recurring billing cycles brought users back at the moment of natural intent, lifting repeat-transaction frequency without discount dependence.
- Churned-user reactivation: Users who transacted once and lapsed were re-targeted with engagement campaigns before they defaulted back to an incumbent. Winning back a user who has already transacted once is far cheaper than acquiring a fresh install.
The compounding here is what carried processed payments past ₹100 crore. A 4% install-to-payment rate is the entry point; repeat transactions are the multiplier. Every percentage point of repeat-rate improvement layers on top of an install base this size to produce outsized transaction volume. In our portfolio, the apps that scale profitably are never the ones with the cheapest installs — they are the ones that convert installs into habits. Remarketing is the mechanism that builds the habit.
Why was the daily creative engine the real scaling unlock?
The single biggest constraint on UAC scale is not budget — it is fresh, high-performing creative, and the daily creative engine is what let this campaign keep its 10.46% CTR and ₹5.77 CPI as spend scaled into the crores. Google's App Campaigns algorithm is a creative-testing machine; starve it of inventory and CPI climbs as the few assets you have fatigue. Feed it constantly and it keeps finding cheaper users.
How the engine ran:
- Multiple creatives shipped daily: A continuous pipeline of new video, HTML5, and static assets went live every day. This kept the auction supplied with fresh inventory and prevented the CTR decay that kills long-running campaigns.
- Hook-led testing: The first two seconds of a video decide the majority of its performance. We tested many hooks against the same core demo — "pay any bill in seconds", "rent payment made simple", "every recharge in one app" — and scaled the winners hard.
- Daily A/B discipline: Underperformers were paused fast and winners scaled progressively. The opportunity cost of running a below-threshold creative for a week is enormous at this spend level; daily pause-and-replace kept blended CPI moving down.
- Format and language variety: A multi-lingual Indian audience responds to creative in its own language. Localised variants across major Indian languages widened reach and lifted CTR in Tier-2/3 markets where the cheapest quality installs lived.
A breakthrough creative does not just perform — it uncaps spend. When a winning asset holds its CPI, you can pour budget into it, and the whole campaign's economics improve. The reason this campaign could absorb ₹39.5M of Google spend without CPI ballooning is that the creative engine kept producing winners faster than the old ones fatigued. We treat creative volume as the core scaling lever, not an afterthought — it is the difference between a campaign that plateaus at ₹2L a week and one that scales to crores.
What were the final results across installs, transactions, and rankings?
In eight months from a standing start, the app crossed 10M+ installs across all channels, drove 6.84M of those through Google UAC at a ₹5.77 blended CPI, converted installs to payments at a 4% rate, indexed 38,000+ keywords into a top-10 category rank, and processed ₹100 crore-plus in payments. The headline numbers, consolidated:
- Total installs: 10M+ across paid, organic, and YouTube-driven channels in 8 months.
- Google UAC installs: 6.84M at a ₹5.77 blended cost-per-install.
- Google CTR: 10.46% on cold app-install inventory — well above typical for the format at this volume.
- Google spend: ₹39.5M (₹3.95 crore) across the window.
- Install-to-payment conversion: 4% — roughly one in twenty-five installs reached a completed transaction.
- Payments processed: ₹100 crore-plus in bills, recharges, and rent.
- ASO: 38,000+ indexed keywords and a top-10 category rank.
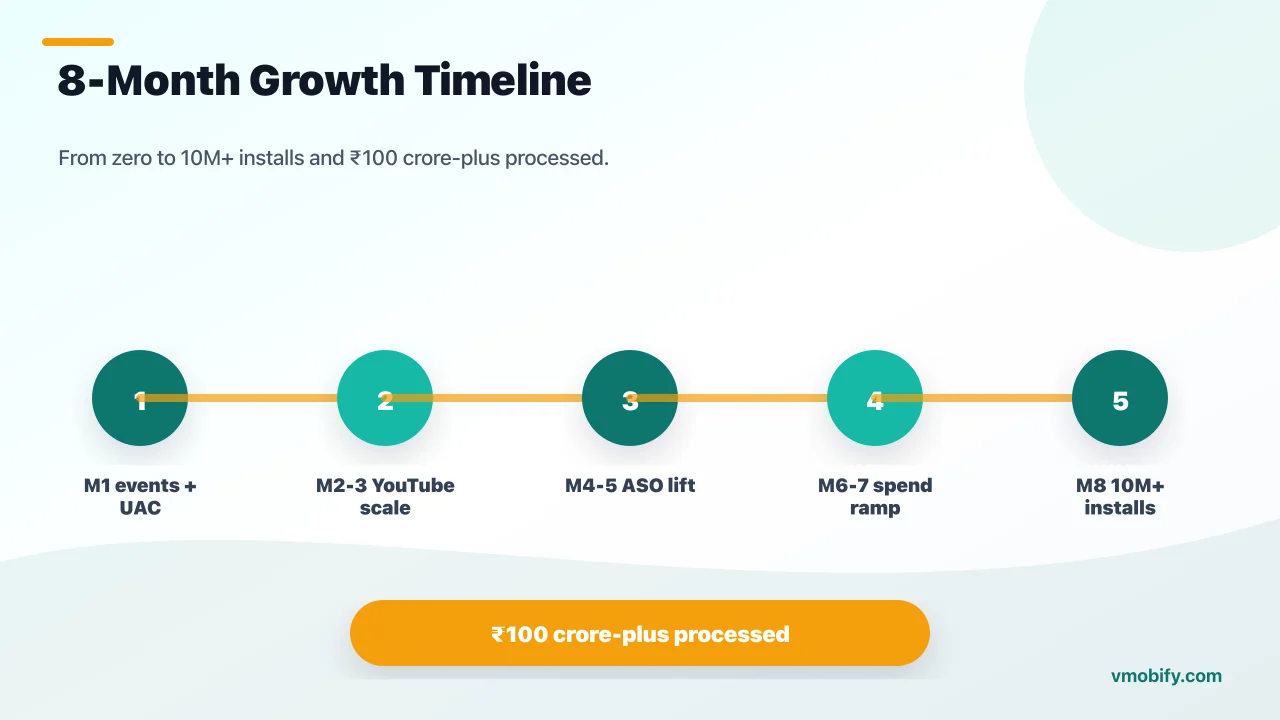
The month-by-month shape of the campaign:
- Month 1: Event taxonomy wired and verified. Volume and registration UAC campaigns live. ASO listing re-architecture and first keyword-indexing push. Creative engine spins up. Branded search near zero.
- Month 2-3: YouTube awareness scales; branded search begins climbing. Listing CVR experiments deploy winners. Payment-event campaign goes live once daily transaction volume is sufficient for the algorithm to learn. Geo-split campaigns separate Tier-1 from Tier-2/3.
- Month 4-5: The inflection. Organic install share grows as indexing breadth and category rank compound. Blended CPA falls even as paid volume rises. Remarketing layer activates against the installer-to-first-transaction cohort.
- Month 6-7: Scale. Google spend ramps into the crores while CTR holds above 10% on the strength of the daily creative engine. Top-10 category rank reached. Repeat-transaction reminders lift frequency.
- Month 8: 10M+ total installs crossed. ₹100 crore-plus processed. The machine is now a compounding system — organic and branded demand carrying a growing share of installs at a falling blended cost.
Two observations future teams should internalise. First, the economics are won at the event, not the install — optimising toward the payment event from the start is what kept a low-margin category profitable at scale. Second, the funnel compounds — YouTube made search cheaper, ASO turned search into organic installs, and remarketing turned installs into repeat payers. No single channel produced this; the system did. You can see the same systems thinking across our portfolio of case studies.
What makes a payments-app growth playbook repeatable?
Vmobify has managed app marketing for Indian and global publishers since 2013, across 300+ apps in fintech, gaming, OTT, edtech, news, and utility — and the reason this bill-payment playbook is repeatable is that it is a system, not a set of tactics. The variables change between clients; the structure does not.
- We optimise toward money, not vanity: Every campaign points at the deepest meaningful in-app event — here, the payment transaction. Optimising toward installs is how agencies produce big, cheap, useless numbers. Optimising toward transactions is how you build a business. That discipline is the core of our user acquisition and analytics practice.
- ASO and paid UA are one system: We never run them as separate budgets. Organic installs are the lever that keeps blended CPA falling as paid scales, and the category-rank velocity from paid is what makes ASO gains stick. Treating them together is why the blended cost kept dropping in this campaign.
- India is our home market: The team works out of India, runs creative in Indian languages, understands the payments landscape — UPI, BBPS, the regulatory frame — and has the Tier-2/3 targeting nuance that international agencies spend their first three months relearning.
- The creative engine is in-house and relentless: Daily creative volume with continuous A/B testing is not a service add-on for us — it is the scaling engine. Campaigns plateau when creative plateaus; ours did not.
- The portfolio compounds: Fintech learnings cross-pollinate with OTT (creator-led awareness), with gaming (creative cadence), with edtech (trust-driven conversion). No single-vertical agency builds that lateral muscle.
If you are launching or scaling a payments, fintech, or utility app in India — and you need volume that actually transacts, not installs that vanish — this playbook adapts to your vertical. The keyword set, the regulatory framing, and the event taxonomy change; the full-funnel, event-optimised structure does not. Talk to Vmobify's growth team to see how it would map to your app, or read our fintech app marketing guide for India for the broader strategy behind it.
Frequently Asked Questions
How many installs did the app get, and how fast?+
The app crossed 10M+ installs across all channels in 8 months from a standing start. Of those, 6.84M came through Google App Campaigns at a ₹5.77 blended cost-per-install across ₹39.5M of spend; the rest came from organic/ASO and the YouTube-driven branded-search halo.
Why concentrate the budget on Google instead of splitting across Meta and other networks?+
The goal was a single, coherent full-funnel system at scale. YouTube and App Campaigns share signals and audiences inside Google's ecosystem, so the awareness-to-conversion handoff is far tighter than stitching unrelated platforms together. For this client, depth in one ecosystem beat breadth across several. The trade-off is different for every app — we break it down in our Google UAC vs Meta vs CPI guide.
What is the difference between a volume UAC campaign and an app-event campaign?+
A volume campaign optimises toward installs and carries scale. An app-event campaign optimises toward a deeper in-app action — registration or a completed payment. Running both, separated, lets the algorithm find scale and quality at the same time instead of forcing one trade-off. The payment-event campaign is what protected the 4% install-to-transaction rate.
How did you achieve a 4% install-to-payment conversion rate?+
Four things: a clean in-app event taxonomy wired before scaling, aggressive removal of onboarding friction between install and first payment, time-bound first-transaction nudges, and shifting paid optimisation onto the payment event once enough daily transactions were feeding back. In a category where most installs never transact, one in twenty-five reaching a payment is a strong result.
What does ASO contribute when you are already buying installs at scale?+
Organic installs are the lever that keeps blended CPA falling as paid volume rises — every organic install is a paid install you did not have to buy. Indexing 38,000+ keywords and reaching a top-10 category rank built an organic share that progressively lowered the blended cost across paid plus organic, even as paid spend climbed into the crores.
Will the installs and rankings hold without continuous spend?+
Partly. The organic engine — keyword indexing, category rank, branded search, and repeat-transaction behaviour — compounds and carries a growing share without active spend. But a top-10 category position in a contested payments category needs a maintenance budget for ongoing creative, ASO iteration, and remarketing. We typically budget a fraction of the acquisition spend for maintenance.
Can this playbook work for a UPI, lending, or insurance app instead of bill payments?+
Yes, with adaptations. The keyword set changes, the regulatory framing changes the trust signals, and the north-star event changes — a loan disbursal or a policy purchase instead of a bill payment. The full-funnel, event-optimised structure — TOFU awareness, MOFU consideration, BOFU event optimisation, ASO, and remarketing — stays the same.
Sources
- Google Ads — App Campaigns Help — Official UAC setup, bidding, event optimisation, and creative guidance
- Google Play — Launch Best Practices — Google's documentation on install velocity and discovery signals
- NPCI — UPI Product Statistics — Primary source on UPI transaction volume and the shared payments rails in India
- IAMAI — Internet & Digital Payments Research — India internet and digital-payment adoption data
- AppsFlyer — Performance Index — Benchmarks for install quality, retention, and channel performance by geography
- Statista — Smartphone Users in India — Market-size context for the Indian addressable install base
- SplitMetrics — ASO & Conversion Research — Aggregated A/B test data on store-listing and first-screenshot conversion impact
- AppTweak — ASO Research Blog — Independent ASO benchmarks including keyword indexing and category-rank dynamics
About the author
Amol Pomane — Founder, Vmobify
Amol leads Vmobify, a mobile app growth agency that has driven 30M+ downloads and ranked 54K+ keywords across 300+ apps since 2013. He writes about ASO, paid user acquisition, retention, and the operational reality of scaling mobile apps in India and global markets.
Free Growth Audit
See exactly how to scale your app with 13+ years of expertise behind you.
Get My Strategy

