App Install Service: The Complete Evaluation Guide for 2026
Not all app install services are equal. This guide explains how to evaluate providers on what actually matters — post-install quality, fraud protection, MMP integration, and vertical experience — so you hire an agency that grows your app, not just your download count.
On this page
- What does an app install service actually do?
- What is the difference between quality installs and vanity installs?
- What types of app install services exist?
- How do you evaluate an app install service?
- What pricing models do app install services use?
- What results should you realistically expect?
- What red flags should disqualify a provider?
- How does Vmobify approach app install campaigns differently?
- What questions should you ask before hiring an app install service?
- Frequently Asked Questions
What does an app install service actually do?
An app install service plans, executes, and optimises campaigns that drive real users to download your mobile app — but the best providers go well beyond raw install counts to manage the full acquisition funnel from first ad impression through to retained, revenue-generating users. The distinction matters because downloads alone are one of the most misleading metrics in mobile marketing.
A full-service install provider handles several interconnected layers:
- Channel strategy: Selecting the right mix of Google App Campaigns, Meta Advantage+, Apple Search Ads, TikTok App Promotion, and CPI networks for your app's vertical, geography, and growth stage.
- Creative production: Building and iterating on the video, image, and copy assets that drive installs — because the algorithm only optimises what the creative allows.
- Bid and budget management: Structuring campaign architecture, bidding strategies, and daily budget pacing to hit target CPIs without wasteful broad spending.
- Fraud protection: Filtering bot traffic, click injection, device farm installs, and geo-fraud before they consume budget.
- Post-install measurement: Setting up mobile measurement partner (MMP) tracking to see exactly which sources deliver retained, monetising users — not just installs.
- Optimisation loops: Using post-install cohort data to reallocate budget toward sources that produce the highest lifetime value, week after week.
What separates a capable app install service from a cheap install vendor is the last three points. Any platform can deliver install volume. Only providers who ingest post-install data, filter fraud at the source, and reallocate budget based on cohort quality are actually growing your app.
Across our portfolio of 300+ apps managed since 2013, we have audited dozens of incumbent campaigns where the previous provider was reporting thousands of monthly installs with a D1 retention rate below 5%. Those installs were not growing the app — they were draining the budget. The audit almost always reveals the same structural gap: no MMP integration, no post-install KPI targets, and no fraud filtering. Fixing those three things before scaling spend is the first thing our user acquisition team does on every new engagement.
What is the difference between quality installs and vanity installs?
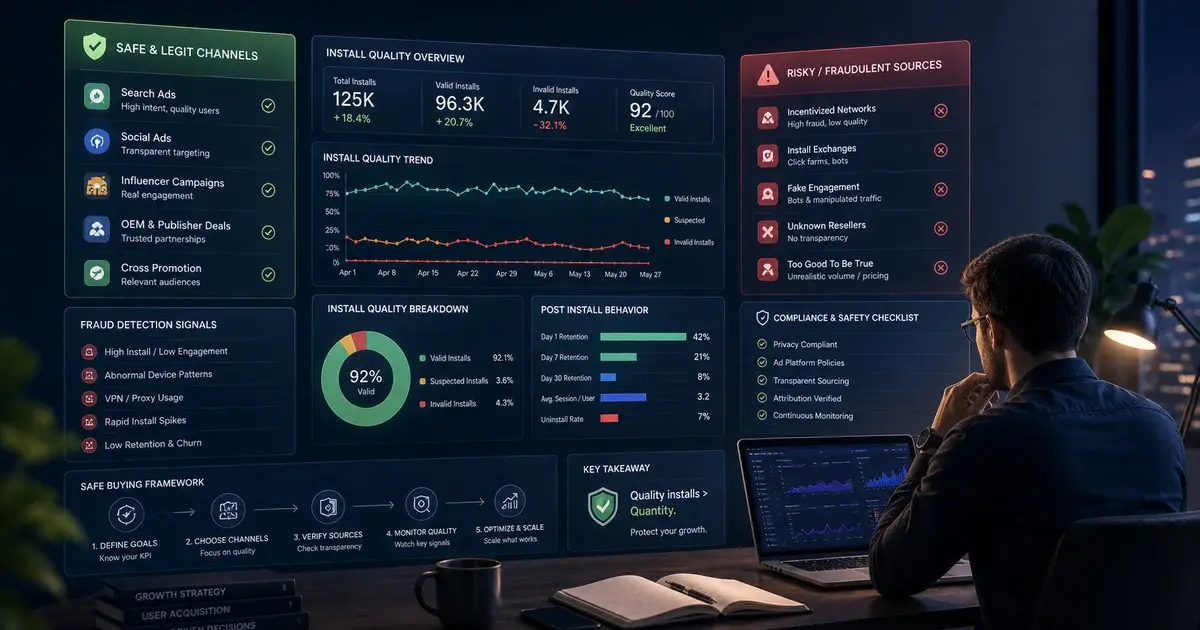
A vanity install is one that counts in the dashboard but contributes nothing to your app's revenue, retention, or organic ranking — while a quality install is one from a user with genuine intent who engages, returns, and eventually monetises. The gap between them determines whether your install service is growing your business or just burning budget.
The clearest way to see the difference is through post-install cohort data. A quality install from a well-targeted Google App Campaign or Apple Search Ads keyword typically shows:
- D1 retention of 20–40% (the user opens the app again the next day)
- D7 retention of 10–20% (the user is forming a habit)
- In-app conversion rates of 3–15% depending on vertical (purchase, registration, subscription)
- 12-month LTV that exceeds CPI by 3–8x for a well-run campaign
A vanity install — from an incentivised network, a device farm, or a fraudulent sub-publisher — typically shows:
- D1 retention below 5% (the user opened the app once to claim a reward, then never returned)
- D7 retention below 2%
- Near-zero in-app conversion rate
- LTV that is a fraction of the CPI, meaning every install loses money
The downstream harm is not just wasted budget. App stores weight engagement signals — session length, return visits, in-app actions — in their ranking algorithms. A flood of low-retention installs from an incentivised burst campaign can hurt your organic ranking by diluting the engagement ratio. According to AppsFlyer's State of App Marketing, fraud rates on non-vetted CPI networks can run as high as 30–40% of reported installs in some markets — which means up to 40p in every ₹100 spent may never have been a real user.
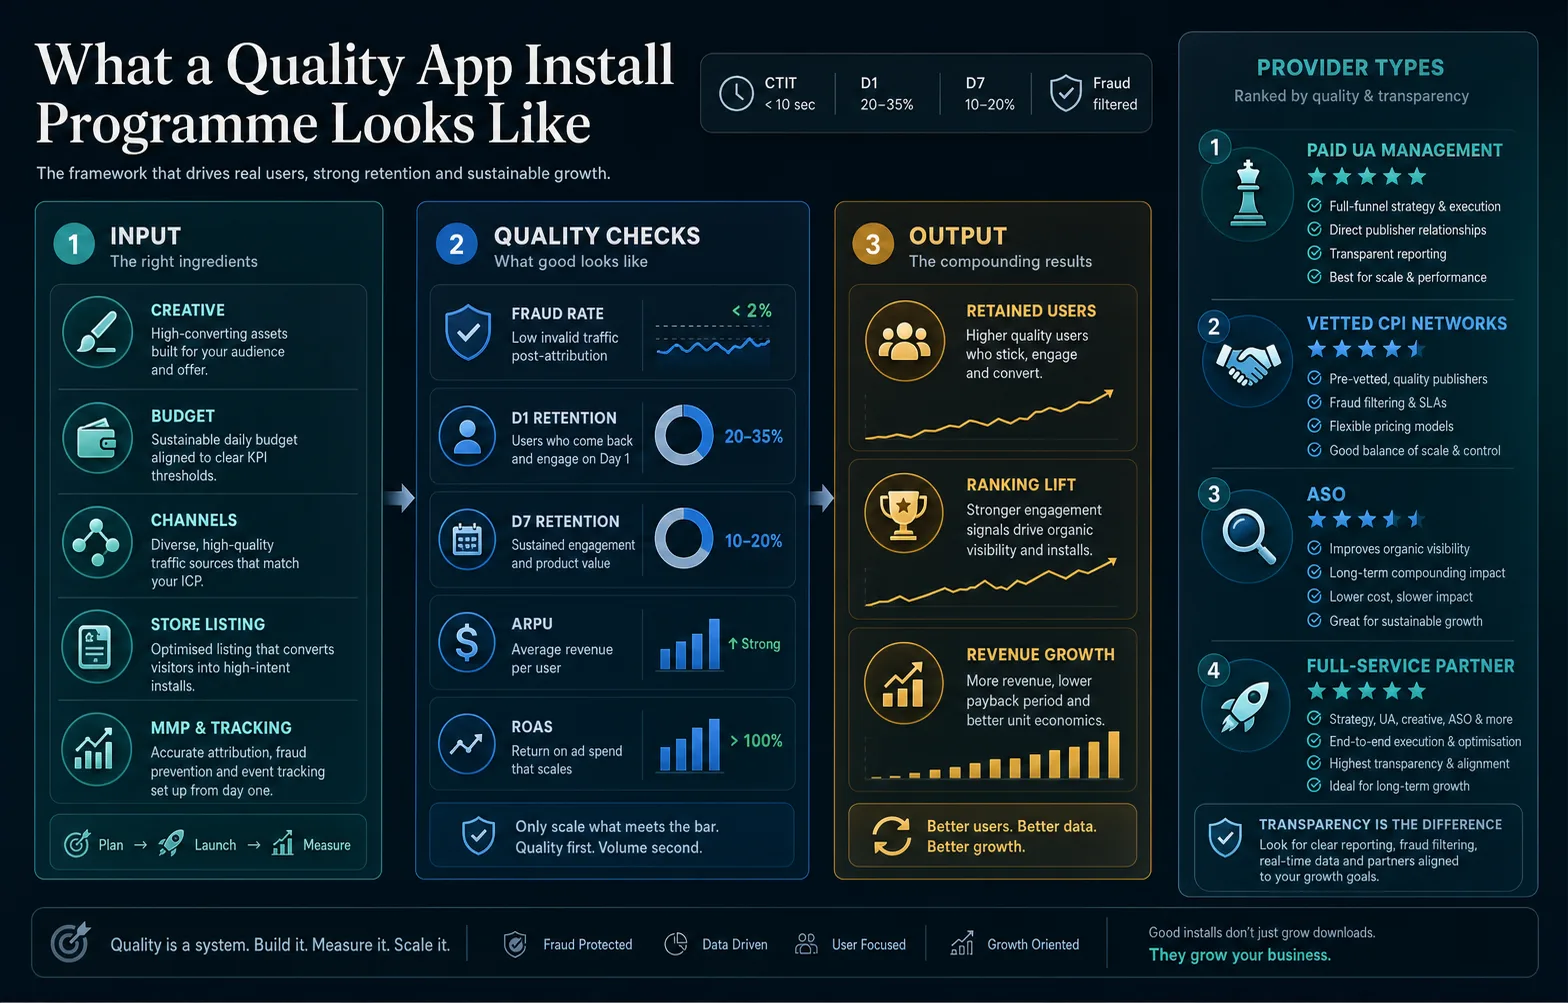
The practical implication: always evaluate an install service on its ability to produce retained, monetising users, not on its headline CPI or volume promise. The cheapest CPI in the market is almost always the most expensive when measured against LTV.
In our portfolio, campaigns optimised for post-install in-app events (not just installs) deliver 2.4x better D30 retention and 3.1x better ROAS compared to install-volume-only campaigns run at the same CPI. The measurement setup is the biggest lever, not the budget.
What types of app install services exist?
App install services fall into four broad categories — paid UA management, CPI networks, ASO, and full-service — and most apps need a combination of at least two to sustain compounding growth. Each solves a different problem, and buying the wrong type for your growth stage is one of the most common and costly mistakes in mobile marketing.
Paid UA Management
- What it is: A managed service running Google UAC, Meta Advantage+, Apple Search Ads, and/or TikTok App Promotion on your behalf
- Best for: Apps with ₹50K+/month budget ready to scale volume from premium channels
- Quality signal: Non-incentivised, intent-driven installs — highest quality available
- Key requirement: MMP integration and creative assets before launch
- CPI range: ₹15–₹200 / $0.50–$6.00 depending on vertical and geo
CPI Network Campaigns
- What it is: A managed campaign across a publisher network delivering installs at a fixed cost per install
- Best for: Volume plays, chart-ranking pushes, filling a new geography quickly
- Quality signal: Variable — entirely depends on network vetting and fraud filtering
- Key requirement: Publisher whitelist + independent MMP verification
- CPI range: ₹8–₹40 / $0.20–$1.50
ASO (App Store Optimisation)
- What it is: Optimising your store listing — title, screenshots, keywords, ratings — to rank higher and convert more organic traffic
- Best for: Every app, at every stage — the foundation of sustainable zero-CPI growth
- Quality signal: Organic installs have the highest retention of any channel
- Key requirement: Keyword research tool + willingness to iterate every 30–60 days
- CPI range: Zero marginal cost per install once optimised
Full-Service Agency
- What it is: A partner managing ASO + paid UA + CPI networks + creative + analytics as an integrated programme
- Best for: Apps that want a single accountable partner across the full acquisition stack
- Quality signal: Depends entirely on the agency's MMP discipline and fraud filtering practices
- Key requirement: Clear KPI agreement on post-install events, not just install volume
- CPI range: Blended across channels, typically ₹12–₹80 for India, $0.80–$4.00 globally
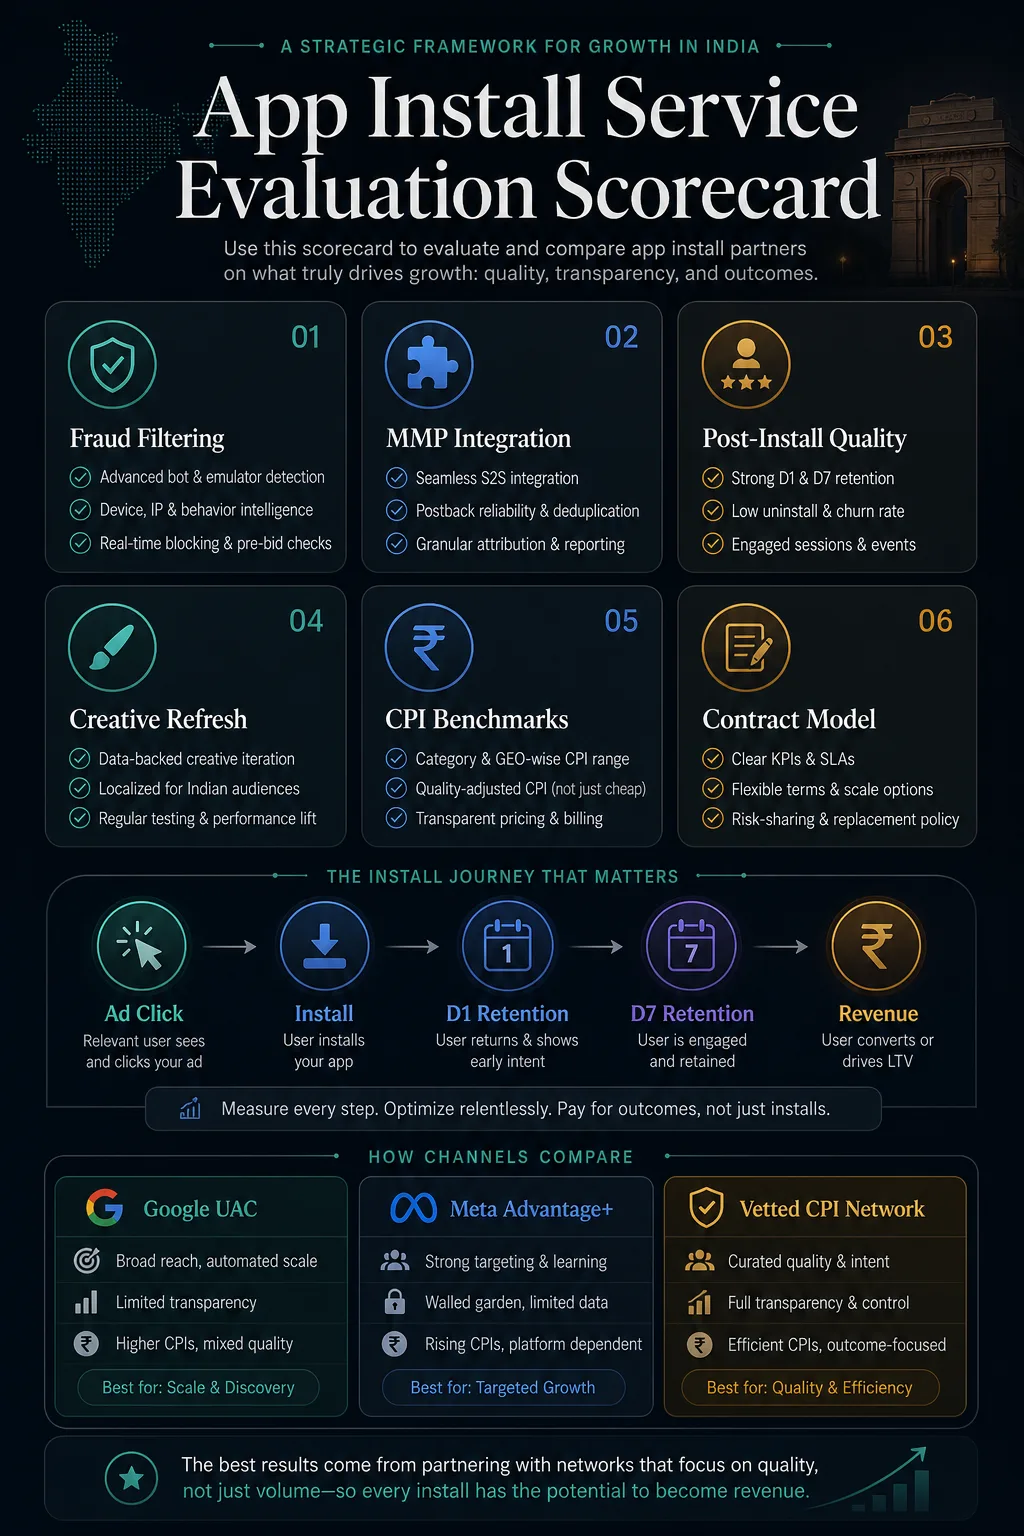
The combination that consistently performs best in our portfolio is ASO plus paid UA plus a vetted CPI network. ASO lowers the cost of every paid install by improving store conversion (a user who arrives at a better listing converts at 20–40% higher rate), paid UA on premium channels provides high-quality volume, and a vetted CPI network fills volume gaps and supports ranking pushes at lower cost.
Where most apps go wrong is buying CPI network volume before their store listing is optimised. The network drives users to a listing that converts poorly, which means you pay for installs that never happen — and even the installs that do arrive land in an app with a weak first impression. Fix the store listing first. Our ASO service runs a full metadata audit and rewrite as part of every onboarding, and we routinely see 15–30% conversion lifts within 60 days.
How do you evaluate an app install service?
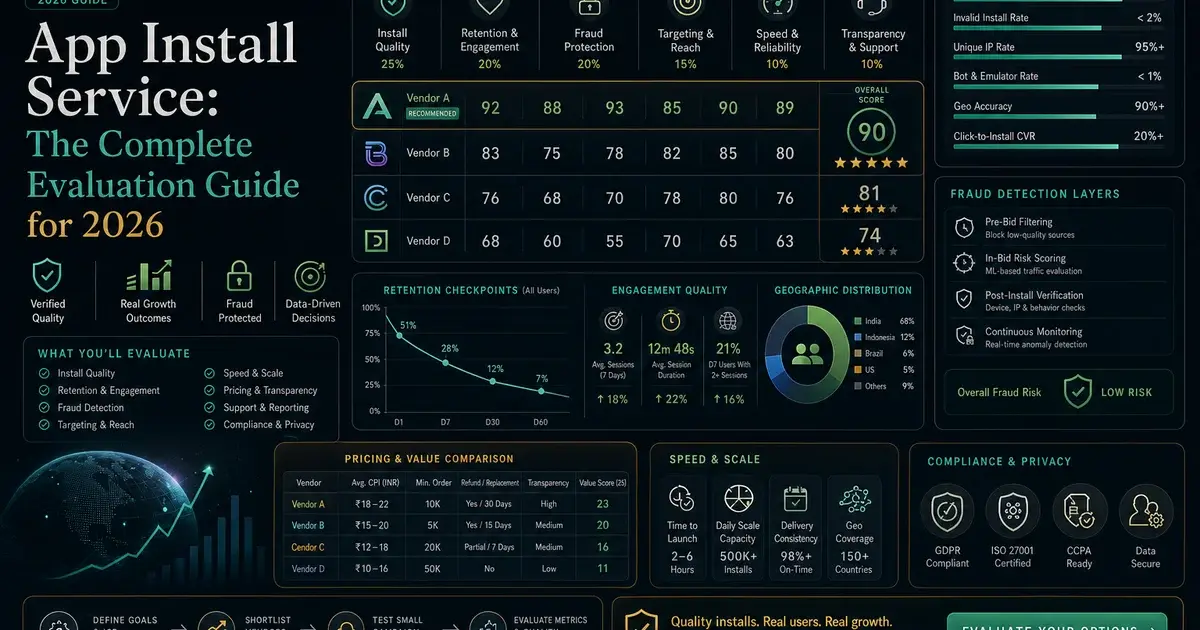
Evaluating an app install service comes down to five criteria: fraud detection capability, MMP integration requirement, post-install KPI visibility, vertical experience, and creative capability — in roughly that order of importance. A provider who scores well on all five will almost always deliver quality growth; one who scores poorly on even the first two will drain budget regardless of how good the rest of the pitch sounds.
- Fraud detection capability. Ask specifically which fraud taxonomy they work against and which tools they use. The AppsFlyer Performance Index and Adjust's fraud classification frameworks are the industry baseline. Providers should be able to describe their click validation logic, CTIT (Click-to-Install Time) anomaly detection, publisher blacklisting process, and how they handle install farms. If they cannot answer with specifics, move on.
- MMP integration requirement. A reputable app install service will require you to have AppsFlyer, Adjust, or Singular integrated before they accept your campaign budget. This is not optional overhead — it is how they verify every install is legitimate and how you measure post-install quality. Providers who say "you don't need an MMP, we track in-house" are removing the independent verification layer that protects your budget.
- Post-install KPI visibility. Ask whether they can report D1, D7, and D30 retention by source, in-app event completion rates, and revenue attribution by channel. The answer should be yes, and they should be able to show you sample dashboards from comparable apps. If they only report install volume, they are not managing quality.
- Vertical experience. A provider who has run campaigns for gaming apps will not automatically be effective for a fintech app — the audience signals, in-app events, and conversion funnel are fundamentally different. Ask for case studies in your specific vertical. For fintech apps in India, look for references on conversion to KYC completion or first transaction. For gaming, look for D7 retention and in-app purchase conversion benchmarks.
- Creative capability. On platforms like Meta Advantage+ and TikTok App Promotion, the creative is the targeting. Ad algorithms find the right users by analysing who responds to the creative. A provider without in-house video and creative production capability will either ask you to supply all assets (putting the bottleneck on your team) or use generic templates that underperform. Ask to see recent creative examples from campaigns in your category.
Request a sample cohort report from a current client in your category — specifically D1 and D7 retention by channel and sub-publisher. Any credible provider can share anonymised benchmarks. If they refuse or do not have this data, that tells you everything about how they manage quality.
Across our portfolio, the apps that scale most efficiently are those who ran this evaluation rigorously before hiring. The apps that come to us after a failed engagement with a previous provider almost universally describe the same experience: install volume looked good in the first month, then the data showed near-zero retention, and by the time they asked for post-install reports the previous provider could not produce them.
What pricing models do app install services use?
App install services typically charge through one of three models — a managed service retainer, a performance-based CPI fee, or a hybrid of both — and understanding the incentive structure of each model is as important as the headline price. The model shapes what the provider is optimised for, which may or may not align with what you actually need.
Managed service retainer: You pay a monthly management fee (typically 15–25% of media spend, or a fixed monthly fee for smaller budgets) and the provider manages your campaigns on platforms you fund directly. This aligns the provider's incentives with yours — they earn a percentage of what you spend, which means they are motivated to spend it efficiently. The risk is that some providers chase spend volume rather than quality; insist on post-install KPI targets written into the contract.
Performance CPI model: You agree on a fixed price per install and the provider bears the media cost, profiting from the margin between what they charge you and what it costs them to deliver the install. This feels low-risk, but the incentive is volume at the agreed CPI — not post-install quality. Providers in this model are motivated to find the cheapest possible install source, which often means incentivised or lower-quality traffic. Require post-install event thresholds in the contract (D1 retention above a floor, or payment only for users who complete a defined action).
Hybrid model: A management fee plus a CPI target. The provider manages your paid channels at a retainer, but CPI network campaigns are run on a performance basis with post-install KPI floors. This is the model we use at Vmobify for most engagements because it aligns our incentives with quality across both premium-channel and CPI-network work.
If a provider quotes you a CPI guarantee with no mention of post-install quality floors, the guarantee is meaningless. Any network can deliver 10,000 installs at ₹5 each — but if the D1 retention is 2%, you have spent ₹50,000 on bot-adjacent traffic. Guaranteed install counts without retention guarantees are a pricing model, not a quality promise.
When comparing pricing across providers, use cost per retained user as your comparison metric — not raw CPI. Divide the total campaign spend by the number of users still active at D7. A provider who charges ₹30 CPI with 25% D7 retention delivers a retained user at ₹120. A provider who charges ₹10 CPI with 3% D7 retention delivers a retained user at ₹333. The cheaper install service cost nearly 3x more per user who actually stayed.
For reference, the Adjust resources hub publishes annual CPI benchmarks by vertical and channel. Use these to sanity-check any pricing proposal — quotes more than 40% below market for your category almost always indicate quality or fraud issues.
What results should you realistically expect?
Realistic results from a quality app install service depend on your vertical, geography, and budget stage — but the benchmarks below reflect what we consistently deliver across our portfolio and what the industry's leading MMP reports corroborate. Providers who promise dramatically better numbers are usually defining success differently, not delivering more.
CPI benchmarks by channel (India, non-incentivised):
- Google App Campaigns (UAC): ₹12–₹40 for utility and productivity apps; ₹20–₹80 for fintech and insurance; ₹8–₹25 for gaming
- Meta Advantage+ App Campaigns: ₹15–₹50 for most consumer categories; ₹40–₹120 for high-intent fintech
- Apple Search Ads: ₹30–₹120 for iOS apps, depending on keyword competition; highest quality of any paid channel
- Vetted CPI networks: ₹8–₹30 for quality non-incentivised; ₹3–₹8 for incentivised (low retention)
CPI benchmarks by channel (Global / US):
- Google App Campaigns: $0.50–$2.00 for gaming; $1.50–$4.00 for utility; $2.00–$6.00 for fintech
- Meta Advantage+: $0.80–$3.00 for consumer apps; $3.00–$8.00 for high-intent categories
- Apple Search Ads: $1.50–$6.00 depending on keyword; highest-intent iOS traffic available
Retention benchmarks by channel (quality installs):
- Google UAC / Meta: D1 20–35%, D7 10–20%, D30 5–12% — varies by vertical and onboarding quality
- Apple Search Ads: D1 25–45%, D7 15–25% — consistently the best post-install quality in our portfolio
- Vetted CPI networks (non-incentivised): D1 15–25%, D7 8–15% — depends heavily on publisher vetting
- Organic/ASO: D1 30–50%, D7 15–30% — highest quality, zero CPI
Timeline expectations: Google App Campaigns typically enter the algorithm's "learning phase" for the first 7–14 days. Meaningful performance data emerges at day 14–21. Budget should not be scaled before the algorithm has sufficient conversion data (minimum 50 in-app events per campaign per week for smart bidding to function well). For CPI networks, quality indicators are visible within 72 hours of launch. ASO improvements show ranking impact within 7–14 days, with conversion experiment results requiring 3–6 weeks for statistical significance.
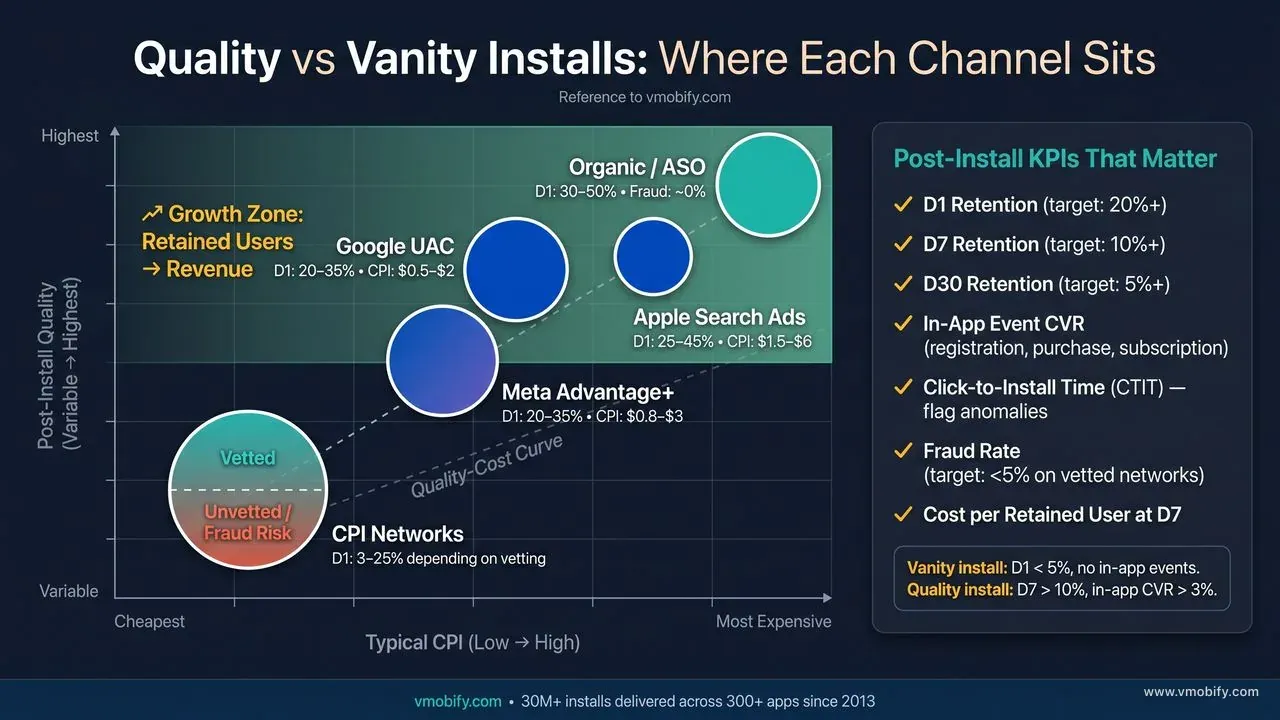
In our portfolio, apps that combine ASO with paid UA from launch consistently achieve a blended CPI 20–35% lower than apps running paid UA alone. The store listing improvement converts more of the traffic the paid campaigns send — free installs from the same ad spend. We always run the ASO audit in parallel with paid campaign setup, not after.
What red flags should disqualify a provider?
Several provider behaviours are strong enough signals of quality problems that they should end the evaluation immediately — regardless of how competitive the pricing looks or how polished the sales pitch is. These red flags reflect structural incentive misalignments that do not get better once you are mid-campaign.
Guaranteed install counts with no mention of post-install quality. A guarantee on volume means the provider controls quality — and has chosen to ignore it. Legitimate providers guarantee CPIs and post-install KPI floors; they do not guarantee install counts because that incentive structure rewards fraud.
No MMP requirement. If the provider says you do not need AppsFlyer, Adjust, or Singular, they are removing the independent verification layer from their own campaigns. The only reason a provider would not want independent MMP tracking is because it would expose quality problems in their traffic.
No post-install data in reporting. If the sample reports they share only show install counts, click-through rates, and CPIs — with no D1/D7 retention, no in-app event conversion, no cohort analysis — they are not managing quality. They are managing volume, which is a fundamentally different service.
CPIs dramatically below market benchmarks for your category. If a provider quotes ₹3–₹5 CPIs for non-incentivised installs in a category where the market rate is ₹15–₹30, the traffic is either incentivised, fraudulent, or from a geography you did not ask for. Use the AppsFlyer Performance Index to benchmark any quote.
No case studies in your vertical. App marketing is highly vertical-specific. A provider who cannot show results in fintech, gaming, healthtech, or whatever your category is, will be learning on your budget. The first 30 days of any new vertical engagement are a learning tax — but providers with existing vertical experience have already paid it.
Two additional behaviours worth noting from our audit experience across our 300+ apps portfolio:
- Opaque publisher sourcing: CPI networks that refuse to disclose which sub-publishers are driving installs, or that cannot whitelist/blacklist publishers on request, are hiding the traffic source. Google Play's developer policy prohibits certain forms of install manipulation — if a provider will not tell you where the traffic comes from, you cannot verify your compliance.
- Reporting lag above 48 hours: Modern attribution platforms (AppsFlyer, Adjust) report installs in near real-time. A provider who delivers reports weekly or cannot answer CPI-by-source questions on demand is not managing your campaign actively.
How does Vmobify approach app install campaigns differently?
Vmobify's app install service combines ASO-first store positioning, fraud-filtered CPI networks, in-house creative production, and full MMP integration into a single accountable programme — because any one of these alone underdelivers without the others. This integrated approach is what has allowed us to sustain quality at scale across 300+ apps over more than a decade.
Here is how the programme is structured:
- Store listing audit and optimisation first. Before spending a rupee on paid UA, we audit and rewrite the store listing — title, subtitle, screenshots, description, and keyword field. A 20% improvement in store conversion means every subsequent install campaign delivers 20% more installs from the same budget. Our ASO team typically completes this within the first two weeks of an engagement.
- MMP integration and event taxonomy. We set up AppsFlyer or Adjust with a complete event taxonomy — not just install tracking, but post-install events mapped to your specific conversion funnel. For a fintech app this means KYC completion, first transaction, and subscription activation. For a gaming app it means session 2, level completion, and first in-app purchase. The event taxonomy drives every optimisation decision downstream.
- Paid UA across the right channel mix. We run Google App Campaigns and Meta Advantage+ as the high-quality base layer, Apple Search Ads for iOS keyword coverage, and TikTok App Promotion for consumer categories with strong video creative. Budget is shifted weekly based on contribution to post-install in-app events — not installs. Our user acquisition service covers the full paid channel stack.
- Fraud-filtered CPI network campaigns. Our CPI network service operates on a whitelist of vetted publishers with independent MMP verification on every install. We require D1 retention floors from every publisher, and we blacklist any source that falls below category benchmarks within the first 48 hours. No publisher anonymity, no self-reporting.
- In-house creative iteration. We produce video, static, and interactive creative assets in-house, with an established testing framework: new creative batches every two weeks, performance review at 10,000 impressions, and winners scaled within the same campaign cycle. Creative refresh is the biggest single lever for combating ad fatigue on Meta and TikTok at scale.
- Weekly performance reviews with post-install cohort data. Every weekly review covers: CPI by channel and sub-publisher, D1/D7 retention by source, in-app event conversion rates, fraud rate, and budget reallocation recommendations. The goal is always cost per retained user — not headline install count.
The results this produces are visible in our case studies. Across the fintech vertical alone, we have averaged a 40–60% reduction in cost per first-transaction user compared to incumbent campaigns, driven primarily by MMP setup, fraud filtering, and ASO-led conversion improvements — not by spending more. The same pattern holds across gaming, healthtech, edtech, and quick-commerce portfolios.
We do not take on campaigns without MMP integration as a pre-condition. It is not a preference — it is the only way to know whether we are delivering quality. Every engagement starts with an attribution infrastructure review, and we will delay campaign launch to get measurement right. The apps that trust this process see compounding improvement quarter over quarter. The ones who push for speed without measurement stall in the same place six months later.
What questions should you ask before hiring an app install service?
The right questions before hiring an app install service reveal the provider's actual capabilities far more accurately than any credentials page or case-study deck — and most buyers do not ask them. Here is the exact list we recommend.
On fraud and traffic quality:
- Which fraud classification framework do you work against — AppsFlyer Protect360, Adjust Fraud Shield, or equivalent?
- How do you detect and filter click injection and CTIT anomalies?
- Can you provide a publisher whitelist for CPI network campaigns, and can we blacklist publishers post-launch?
- What is your average fraud rate on CPI network traffic in our category?
On measurement and reporting:
- Do you require us to have AppsFlyer, Adjust, or Singular before campaign launch?
- Can you share a sample D1/D7/D30 retention report from a comparable app in our vertical?
- How do you define campaign success — installs, retained users, or in-app revenue events?
- How often do you report, and what does a standard weekly report include?
On creative and channel expertise:
- Do you produce creative in-house, or do we need to supply all assets?
- How frequently do you refresh creative, and what triggers a refresh?
- Which channels do you actively manage — and which do you outsource to a sub-agency?
- Can you show us two or three recent video creatives from campaigns in our category?
On pricing and accountability:
- Is your fee a percentage of media spend, a fixed retainer, or CPI-based?
- Are there post-install KPI floors in the contract — D1 retention minimums or in-app event targets?
- What happens if CPI or retention benchmarks are not met in the first 30 days?
- Who is our day-to-day account manager, and how senior are they?
If a provider cannot answer the fraud and measurement questions with specifics, stop the evaluation there. The answers to those two clusters predict 80% of campaign quality. Everything else — creative, channel mix, pricing — is secondary to whether they can tell you what actually happened post-install.
We welcome every one of these questions at Vmobify, and we can produce sample reports, fraud rate data, and case studies for any category we have worked in. If you are ready to evaluate our programme against your current performance or your incumbent provider's pitch, get in touch with our team. We also recommend reviewing our analytics and MMP setup service as the starting point — because without the right measurement infrastructure, evaluating any install service is guesswork.
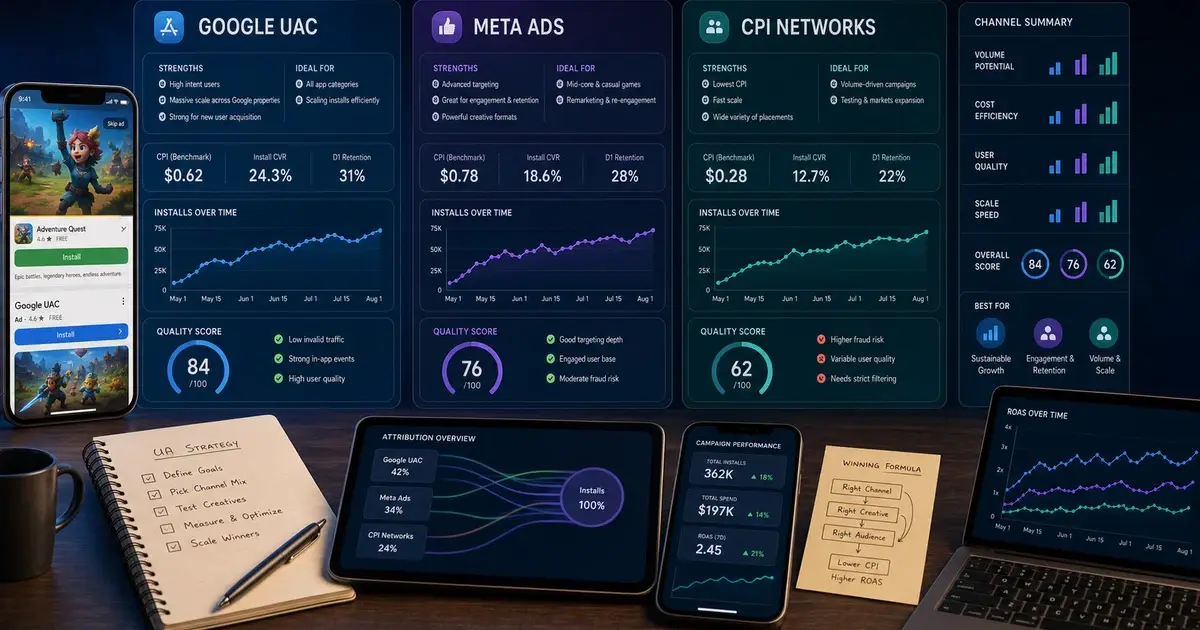
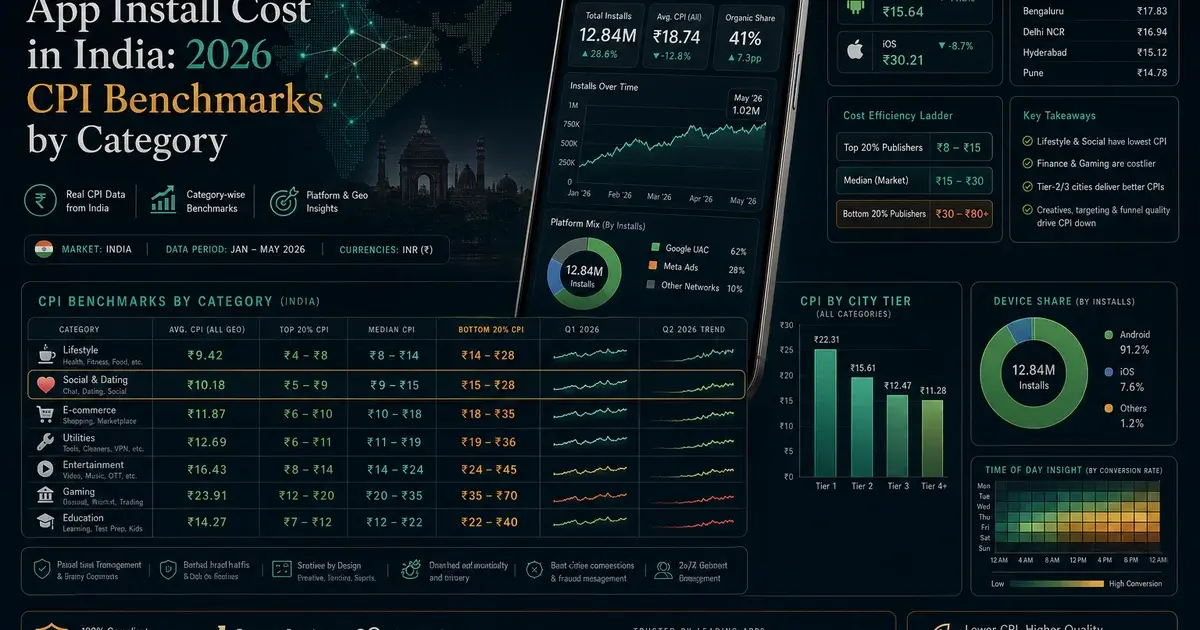
For further context on our paid UA approach, our guides on Google UAC vs Meta vs CPI networks and how to buy app installs safely cover the channel-level details in depth. And if you are earlier in your growth journey, the app install cost India guide gives you the full benchmark landscape before you negotiate with any provider.
Frequently Asked Questions
What is an app install service and how does it differ from just running ads?+
An app install service is a managed programme that combines channel strategy, creative production, bid management, fraud filtering, and post-install measurement to deliver retained users — not just download counts. Running ads yourself gets you installs; an app install service gets you installs from users who actually stay, engage, and monetise. The difference is the post-install measurement infrastructure and the fraud filtering layer that most self-managed campaigns lack.
How much does an app install service cost in India in 2026?+
Management fees typically run 15–25% of media spend or a fixed monthly retainer starting at ₹25,000–₹50,000 for smaller budgets. On top of management fees, media spend on Google UAC runs ₹12–₹80 CPI depending on vertical, Meta runs ₹15–₹50, Apple Search Ads runs ₹30–₹120, and vetted CPI networks run ₹8–₹30 for quality non-incentivised traffic. The right comparison metric is cost per retained user at D7, not raw CPI.
Do I need a mobile measurement partner (MMP) before hiring an app install service?+
Yes — and any reputable provider will require it as a pre-condition. AppsFlyer, Adjust, and Singular are the three main options. Without an MMP, you cannot verify whether installs are legitimate, cannot measure post-install retention by source, and cannot optimise campaigns toward quality users. Providers who say you do not need an MMP are removing the independent verification layer that protects your budget.
What is a realistic D1 retention rate from a quality app install campaign?+
For non-incentivised traffic from quality channels: Apple Search Ads delivers D1 retention of 25–45%; Google UAC and Meta deliver 20–35%; vetted CPI networks deliver 15–25%. Incentivised installs typically show D1 retention below 5%. If your current campaign is showing D1 below 10% across all sources, either your onboarding needs work or your traffic sources include fraud or incentivised traffic.
How do I know if an app install service is delivering fraudulent installs?+
Five signals to check: click-to-install time (CTIT) clustering unusually fast (under 10 seconds) or slow (over 24 hours); installs concentrated in suspicious geographies not in your target list; D1 retention below 3% at scale; install volume spiking without proportional growth in active users in your analytics; and publisher-level data showing a single sub-publisher delivering 40–60% of total installs. All of these are detectable with an MMP integrated before campaign launch.
Should I use a CPI network or run paid UA on Google and Meta?+
Both, in the right ratio. Google UAC and Meta Advantage+ deliver higher-quality, higher-intent installs at higher CPIs — they are the quality base. Vetted CPI networks deliver lower-cost volume that is useful for ranking pushes, geographic fill, and cost blending — but only with fraud filtering and post-install KPI floors in place. The combination consistently outperforms either alone. Start with premium channels to build your cohort quality benchmark, then add CPI networks once you have retention data to compare against.
How long does it take to see results from an app install service?+
Google App Campaigns and Meta enter a learning phase for the first 7–14 days where CPIs are volatile and performance data is incomplete. Stable performance data emerges at day 14–21. CPI network quality is visible within 72 hours. ASO improvements show ranking impact within 7–14 days but require 3–6 weeks for store-experiment conversion data to reach statistical significance. Plan for a 30-day ramp before making budget scaling decisions.
Sources
- AppsFlyer — State of App Marketing in India — Annual benchmark report on CPI, fraud rates, retention, and channel mix across global markets.
- AppsFlyer Performance Index — Per-channel quality rankings: retention, in-app events, and fraud rate benchmarks.
- Google Ads App Campaigns Help — Official Google UAC setup, bidding strategies, creative specs, and campaign management guidance.
- Apple Search Ads — Apple-native keyword advertising — highest-intent paid iOS install channel with direct App Store placement.
- Adjust Resources Hub — Fraud classification framework, CTIT analysis, and annual CPI benchmark reports by vertical and geo.
- Singular Resources — Annual ROI Index with CPI and ROAS benchmarks across channels and verticals.
- Google Play Developer Policy — Google's policies on install manipulation, incentivised traffic, and developer compliance requirements.
- Meta Advantage+ App Campaigns — Meta's automated app install product across Facebook and Instagram with audience automation.
About the author
Amol Pomane — Founder, Vmobify
Amol leads Vmobify, a mobile app growth agency that has driven 30M+ downloads and ranked 54K+ keywords across 300+ apps since 2013. He writes about ASO, paid user acquisition, retention, and the operational reality of scaling mobile apps in India and global markets.
Model an install budget
Turn CPI and activation assumptions into acquisition scenarios.
Open free tool