India App Market Statistics 2026: Downloads, Users, Revenue & Trends
A linkable benchmark for India's mobile app market in 2026 — download scale, smartphone user base, the UPI backdrop, the Android vs iOS split, the high-downloads low-ARPU reality, and which verticals are actually growing. Every figure attributed, framed as reported and directional.

How big is India's app market in 2026?
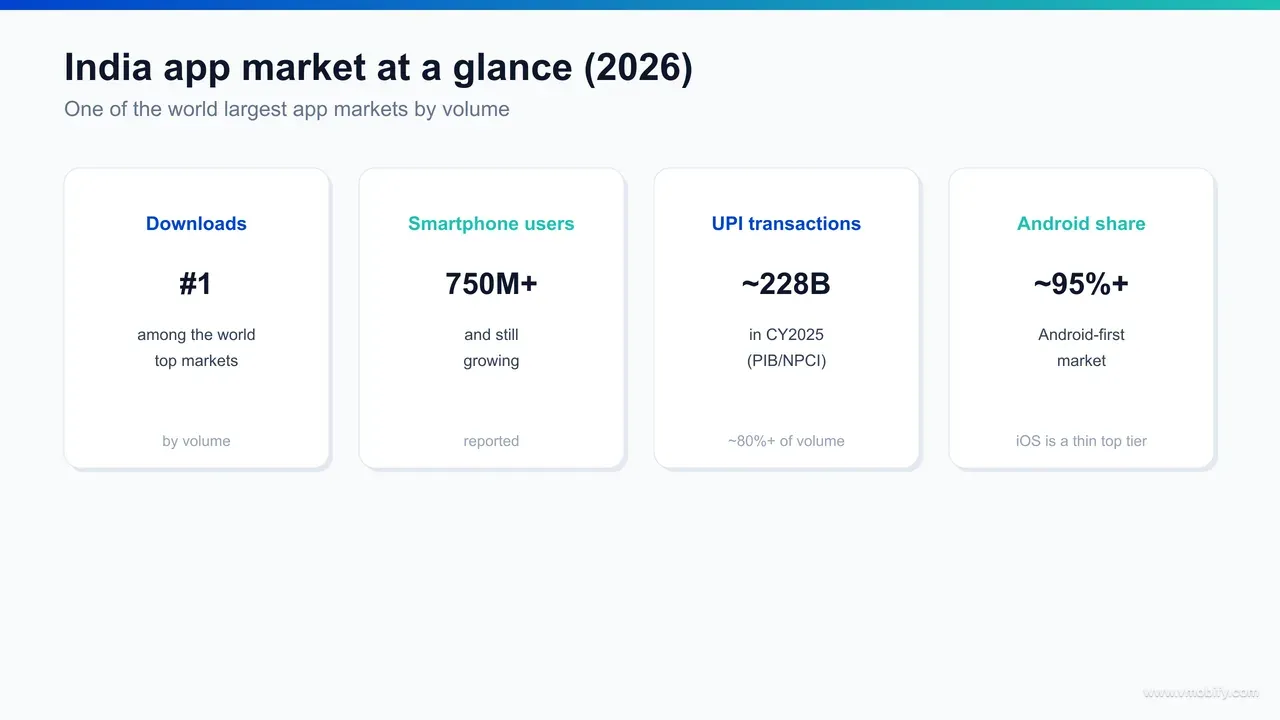
India is one of the largest app markets on the planet by download volume — frequently reported as the single biggest by raw installs — sitting on a smartphone base of roughly 750 million-plus users and a mobile-first internet population that almost no other country matches in absolute scale. The headline to hold in your head is simple: India leads the world on quantity of downloads while trailing mature markets badly on revenue per user. Every other statistic in this reference flows from that one tension.
The scale is genuinely hard to overstate. Industry trackers such as Sensor Tower and data.ai have for several years placed India at or near the top of global app-download charts, ahead of the United States and behind only occasionally on specific category cuts, per the running coverage in Sensor Tower's State of Mobile analysis. Statista's wider India mobile-internet market overview tells the same story from the demand side: hundreds of millions of users who came online on a phone, never owned a desktop, and treat apps as the default interface to banking, commerce, entertainment and government services.
It is worth being precise about what "big" means here, because the word does different work in different sentences. India is big on downloads (top of the world), big on users (second only to China on connected population), big on engagement hours (among the highest globally on time-in-app) — but mid-table or lower on consumer spend and per-user revenue. A market can be enormous on one axis and thin on another, and India is the textbook case. Treat the four axes separately and you will reason about it correctly; blend them into a single "market size" number and you will mislead yourself.
One framing note before the numbers: every figure in this piece is reported, approximate and directional. We have attributed each to a named source, but app-market statistics are estimates that vary between trackers, methodologies and reporting periods. Use them to size opportunity and set expectations — not as audited accounts. For the year-on-year movement behind these levels, our companion India app install trends 2026 report covers CPI shifts, channel mix and category dynamics in depth; this piece is the static benchmark you can cite.
How many smartphone users does India have?
India had on the order of 750 million-plus smartphone users heading into 2026, with credible forecasts pointing well past that figure as device prices fall and rural connectivity expands — a base that is still growing while most large markets have plateaued. The exact number varies by source and definition, but the direction is unambiguous: up, and from an already vast base.
Statista's India smartphone-user forecast is the most-cited series here, and it shows a long, steady climb through the decade. The Internet and Mobile Association of India, via IAMAI's connectivity reports, frames the same expansion in terms of internet users — the gap between "has a smartphone" and "is actively online" has all but closed in India, because for most users the smartphone is the only computer they will ever own.
Three structural facts make this base different from a Western one, and each has direct consequences for how you market to it:
- It is mobile-only. A large majority of Indian internet users have never used a desktop browser. There is no web-to-app fallback to lean on — the app, or the mobile site, is the entire relationship.
- It is young. India's median age is under 30, and the incremental user joining the internet now skews younger and more rural than the existing base — which pulls demand toward gaming, social, short-form video, and vernacular content.
- It is price-sensitive on devices and data both. Sub-₹10,000 Android phones and some of the cheapest mobile data in the world are what made this base possible — and they shape what users will pay for inside an app.
Across our 300+ apps managed since 2013, the single most common strategic error we see foreign teams make is reading "750 million users" as one addressable market. It is not. It is a stack of distinct cohorts — metro English-first, Tier-2 bilingual, Tier-3 vernacular-first — with 3-5x differences in willingness to pay and completely different discovery behaviour. The size is real; treating it as homogeneous is the trap.
Where is India's app growth actually coming from?
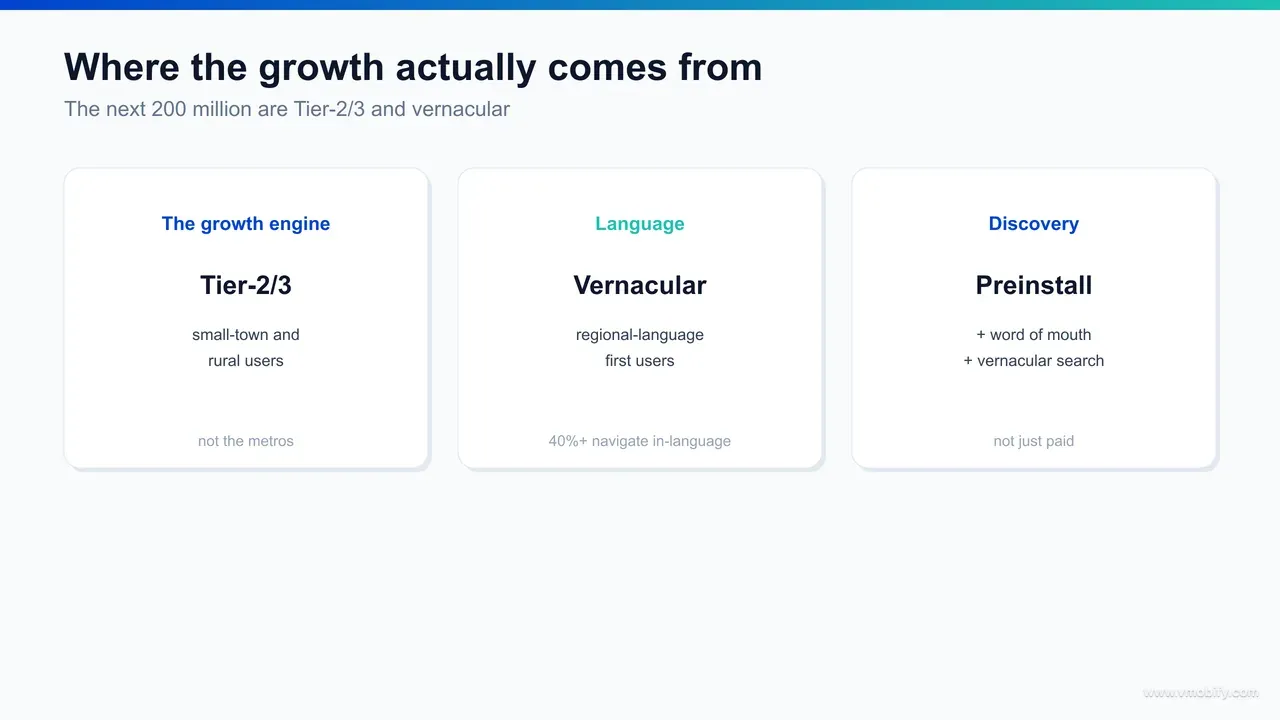
India's incremental app growth in 2026 comes overwhelmingly from Tier-2 and Tier-3 cities and rural districts — not the metros, which are at or near saturation in most mainstream categories. The next wave of installs is a small-town, vernacular, value-conscious wave, and it behaves differently from the metro audience most global apps were originally designed for.
The metros — Bengaluru, Mumbai, Delhi NCR, Hyderabad, Chennai, Kolkata, Pune — are largely penetrated for the big horizontal categories. UPI, messaging, the major OTT platforms and the dominant commerce apps already sit on most metro phones, so growth there is a share game, not an acquisition game. The acquisition game has moved outward to cities such as Indore, Jaipur, Lucknow, Coimbatore, Visakhapatnam, Surat and Chandigarh, and beyond them to the Tier-3 towns following the same arc 12-18 months behind.
This geographic shift is not a marginal effect — it is the dominant trend in Indian app growth and the reason "average India" benchmarks mislead. A Tier-3 user discovers apps differently (more via preinstalled stores and word of mouth, less via paid search), navigates in a different language, and converts to paid at a different rate. IAMAI's reporting has tracked rural internet growth outpacing urban for several cycles now, and the cheaper-device, cheaper-data flywheel keeps that gap open.
The behavioural gap matters as much as the geographic one. A Tier-3 user typically comes online on a shared or hand-me-down device, runs a tighter data budget, and leans on preinstalled stores, regional influencers and family word-of-mouth far more than on paid search or the English-language app press. Acquisition creative built for a metro commuter — English copy, card-first checkout, urban context — simply does not register with that user. Same country, genuinely different market, and the apps that recognise it early stop translating the metro playbook and start writing a new one for each ring of cities.
In our portfolio, the apps growing fastest in 2026 are the ones that stopped running a single national campaign and started treating India as 8-10 distinct markets, with creative, pricing and onboarding built for each. If you are budgeting paid user acquisition against a blended national CPI, you are almost certainly overpaying for metro inventory and underinvesting in the Tier-2/3 markets where the marginal user is both cheaper and growing faster. The deeper city-by-city and channel-by-channel breakdown lives in our install trends report; the point for this benchmark is structural — growth has moved out of the metros for good.
How does UPI and the digital-payments boom shape the app market?
UPI is the single most important piece of infrastructure behind India's app economy — it processed roughly 228 billion transactions in calendar year 2025 per PIB/NPCI figures and accounts for the large majority, broadly 80%-plus, of India's digital-payment volume — and it is what removed the checkout friction that once capped what Indian apps could earn. You cannot reason about Indian app monetisation without reasoning about UPI first.
The scale is staggering and worth stating plainly. The Press Information Bureau, citing National Payments Corporation of India data, has reported UPI clearing volumes in the hundreds of billions of transactions annually — a run-rate of many billions per month that dwarfs card networks in India and rivals the largest payment rails anywhere. For an app, the practical effect is that collecting ₹49 or ₹199 from a Tier-3 user is now a two-tap action, not a card-entry wall that 90% of users abandoned.
That matters in three concrete ways for app growth:
- It unlocked low-ticket monetisation. Micro-subscriptions, small in-app purchases, and pay-per-use models became viable for an audience that never had — and still largely does not want — a credit card. UPI Autopay extends this to recurring billing, which is why India subscription experiments increasingly route through UPI mandates rather than cards.
- It is itself a category. The payment apps — PhonePe, Google Pay, Paytm and the rest — are among the most-installed and most-engaged apps in the country, and they have become distribution surfaces in their own right.
- It lowered the trust barrier. A user who transacts dozens of times a month via UPI is far more comfortable paying inside other apps than the same user was five years ago. The behavioural shift compounds across the whole market.
The honest caveat: UPI made paying frictionless, but it did not make Indian users high-value. The same rail that lets a user pay ₹49 in two taps is the rail they use for ₹49 payments, not ₹4,900 ones. UPI raised conversion dramatically while average ticket sizes stayed modest — which is exactly the high-downloads, low-ARPU pattern we quantify later in this piece.
What is the Android vs iOS split in India?
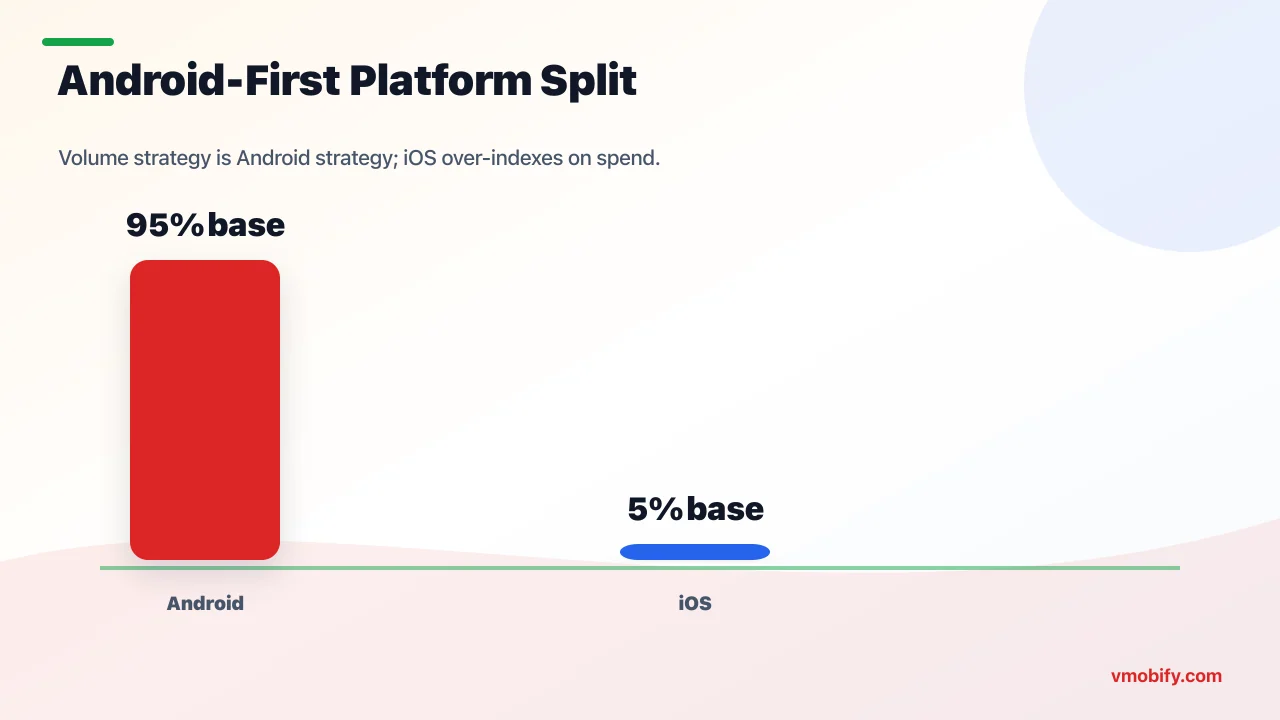
India is an Android-first market by an enormous margin — Android holds roughly 95%-plus of the installed base, with iOS in the low single digits — so volume strategy is Android strategy, while the small iOS slice carries a disproportionate share of consumer spend. The split is one of the most lopsided of any large market, and it has direct consequences for sequencing, measurement and monetisation.
The roughly 95:5 Android-to-iOS ratio is widely reported across device-tracking sources and is consistent with the price structure described above: India's smartphone base was built on affordable Android hardware, and Apple's pricing keeps iPhones a premium minority despite strong recent growth in absolute iPhone sales. Statista's India mobile coverage and the major device trackers all land in the same band — Android dominant, iOS a thin premium tier.
That thin iOS tier punches far above its weight on revenue, though. The pattern global trackers including data.ai's State of Mobile have documented for years holds in India too: iOS users spend several multiples more per head on subscriptions, premium commerce and in-app purchases than Android users. A market that is 95% Android by installs can easily be only 70-75% Android by in-app revenue — the iOS minority over-indexes that heavily on willingness to pay.
The practical reads we give portfolio teams are consistent:
- Volume-led apps (gaming reach plays, content, utilities monetised by ads) can defensibly launch and scale Android-first, and add iOS only when the unit economics justify a second platform build.
- Monetisation-led apps (subscriptions, premium commerce, fintech with paid tiers) need iOS from early on despite its small install share, because that is where a meaningful chunk of the revenue actually sits.
- Measurement differs by platform. Android's install-referrer and Play tooling give cleaner attribution than iOS's privacy-constrained SKAdNetwork world — so blended cross-platform reporting hides real differences. Read each platform on its own terms.
The trajectory is worth flagging: iOS share is creeping up slowly as premium device adoption grows, but on any realistic horizon India remains Android-first. Plan for Android as the default and treat iOS as the high-value specialist channel, not the other way round.
How big is the vernacular, next-200-million opportunity?
The "next 200 million" Indian internet users are overwhelmingly vernacular-first — they prefer to read, search, and transact in a language other than English — and serving them in their own language is now the largest single growth lever in the Indian app market. The English-comfortable metro audience is broadly online already; almost all the remaining headroom speaks Hindi, Tamil, Telugu, Marathi, Bengali, Kannada, Gujarati, Malayalam, Punjabi, Odia and dozens of other languages first.
This is not a niche or a nice-to-have. IAMAI and multiple market trackers have for years projected that the overwhelming majority of India's incremental internet users would be vernacular-first, and that has now played out. A large share of search, content consumption and even app discovery happens in regional languages, and the gap between an English-only listing and a properly localised one is the difference between visibility and invisibility for that audience.
Vernacular is a discovery lever, a conversion lever, and a retention lever simultaneously:
- Discovery: A user searching or speaking in Tamil or Hindi finds the apps whose metadata carries the real vernacular terms — not the literal English translation, the term users actually type or say. App stores that index Indian languages (more on those next) surface localised listings that English-only competitors never appear against.
- Conversion: Localised store creative and onboarding convert materially higher in the audiences they target — we routinely see vernacular variants outperform English-first listings by 20-40% in the right geographies.
- Retention: An app a user can actually navigate in their own language is an app they keep. Vernacular UI and content are among the strongest retention signals for Tier-2/3 cohorts.
This connects directly to how we run app store optimisation for India: keyword research has to be done per language, not translated word-for-word, because the spoken Hindi term for "money transfer" or "movie tickets" is rarely the dictionary translation of the English keyword. Treat each major language as its own ASO surface with its own research, and the vernacular base converts. Treat it as an afterthought translation and you forfeit the largest growth pool in the market.
The scale of the language fragmentation is what makes this hard to fake. India recognises more than twenty official languages and a long tail of widely spoken ones, and the major app categories now see meaningful daily usage across a dozen of them — Hindi is the single largest bloc but nowhere near a majority of the vernacular pool, so a Hindi-only "localisation" still leaves most of the opportunity untouched. The teams that win here build a tiered language plan: full localisation for the top four or five languages by addressable users, lighter metadata-and-creative localisation for the next tier, and a deliberate roadmap rather than a one-off translation sprint. Voice is the accelerant on top — a large and growing share of Tier-3 discovery happens through spoken queries, which rewards apps whose metadata carries the phonetic, spoken form of a term rather than its written-English equivalent.
Which app verticals are growing fastest in India?
The fastest-growing app verticals in India in 2026 are fintech, gaming, OTT and short-form video, edtech (post-correction), and quick-commerce — each riding a different combination of the UPI rail, cheap data, and the Tier-2/3 expansion. They do not grow for the same reasons, and they monetise very differently, so it pays to read them separately.
- Fintech: The broadest growth surface, anchored by UPI but extending into lending, insurance, wealth, gold and gig-worker earnings apps. Top-of-funnel UPI is saturating in metros, so the growth has moved to niche and Tier-2/3 segments. Fintech also carries some of the highest acquisition costs in the country because well-funded entrants flood the auction.
- Gaming: India is among the largest mobile-gaming markets by downloads. The audience is graduating from hyper-casual time-killers toward mid-core RPG and strategy titles with deeper monetisation — mirroring the arc Southeast Asia walked a few years earlier. Real-money and fantasy gaming sit under a shifting regulatory cloud, so read that sub-segment with caution.
- OTT and short-form video: Massive on engagement hours, increasingly vernacular and regional. Regional-language streaming and short-form are under-served relative to demand and convert well where competition is thin.
- Edtech: Recovering from the 2022-2024 correction with soberer unit economics. Vernacular K-12, test-prep and skilling are the healthier sub-segments; generalist English-medium K-12 is losing share.
- Quick-commerce: The fastest-growing install category by rate, expanding aggressively from metros into Tier-2. Expensive to acquire for, but strong post-install monetisation where it has density.
Read across these five and a single dynamic repeats: the easy, horizontal, English-first version of each category is largely built, and the headroom now sits in the harder, narrower, vernacular cuts. Fintech's growth is in underwriting the thin-file borrower and the gig-worker, not in another UPI wallet. Gaming's is in mid-core depth and regional-language live-ops, not another hyper-casual clone — and the real-money sub-segment now carries a heavier tax and compliance load that has reshaped its unit economics. OTT's is in regional originals and ad-supported tiers priced for Indian wallets, not another premium English subscription bet. Edtech's is in affordable vernacular skilling, not flagship metro test-prep. Quick-commerce's is in the next ring of cities, where the dark-store density that makes the model work is only now being built out. The category is never the moat; the under-served slice inside it is.
The cross-cutting pattern is that growth has moved from generalist horizontal plays to niche and vernacular ones inside every category. We have seen single-sub-genre specialists outperform multi-title generalists by 3-4x on retained-user economics — saturated does not mean closed; it means the generalist door is closed and the specialist door is wide open. For the vertical-by-vertical CPI and category-winner detail, the install trends report goes deeper than this static benchmark needs to.
Which alternative app stores matter in India?
Google Play remains the default on effectively every Android phone in India and is still where the overwhelming majority of installs happen — but India is also the one major market where alternative Android stores genuinely matter, led by PhonePe's Indus Appstore and Xiaomi's GetApps, both of which reach Tier-2/3 audiences through preinstallation. For an India-first app, a multi-store strategy is no longer exotic; it is increasingly table stakes.
Three reasons alternative stores are real in India specifically, where they are not in most markets:
- Preinstallation. Indus ships preinstalled on Xiaomi and Lava devices (with a Motorola India deal announced in late 2025), and GetApps is the default Xiaomi/POCO/Redmi store — which means these storefronts reach users who never go looking for an alternative store, including a large Tier-3 base.
- Billing economics. Indus charges zero commission on in-app purchases and lets developers bring their own payment gateway — usually UPI — versus the 15-30% cut Google Play takes. For a subscription or IAP-led app, that recovered commission is a direct margin gain on every transaction.
- Vernacular discovery. Indus indexes discovery across a dozen Indian languages with voice search, surfacing apps to vernacular users that an English-first Play listing buries.
The honest framing we give clients is "Play plus, not Play or." Google Play stays your volume engine; alternative stores are a high-margin, India-native supplement that captures commission-free revenue and vernacular installs Play does not. The work to maintain a second or third listing is real, but for an India-first, monetised app the commission savings alone frequently justify it before you even count the incremental installs. Our full Indus Appstore guide walks through publishing, billing and the limitations; the point for this benchmark is that India is the rare market where the alternative-store question has a "yes" answer for a meaningful share of apps.
What does this mean for your app growth strategy?
The macro picture dictates a specific operating posture: Android-first by default, Tier-2/3 and vernacular-led on acquisition, UPI-native on monetisation, multi-store on distribution, and patient on revenue per user. The market rewards apps built for the India that is growing — small-town, multilingual, value-conscious — not the metro-English India that is already saturated.
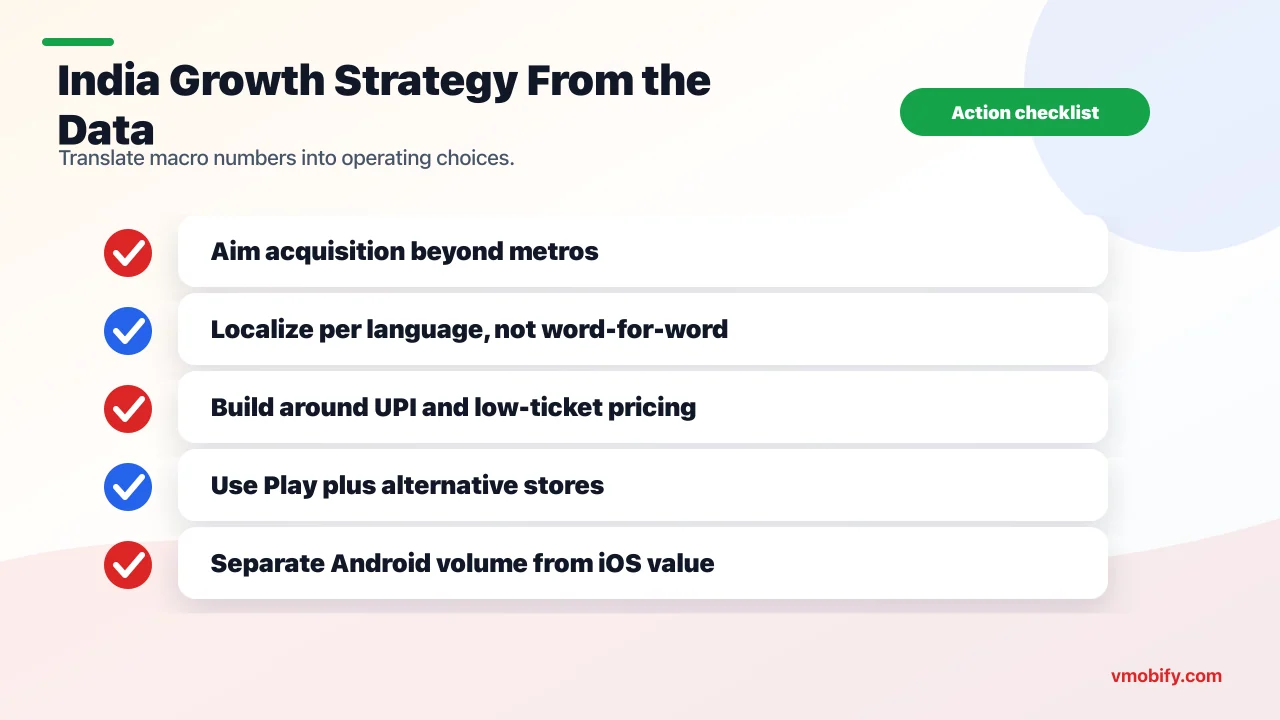
Translating the statistics in this piece into a plan, the priorities order out cleanly:
- Aim acquisition outward. Split campaigns by tier and language rather than running one national ad group. Metro inventory is the most expensive and slowest-growing; Tier-2/3 is cheaper and where the marginal user lives. Geo-splitting alone routinely moves blended CPI double digits.
- Localise as a growth lever, not a translation chore. Per-language ASO, vernacular creative, and localised onboarding are the highest-leverage work for the next-200-million audience. This is where the largest untapped pool sits.
- Build monetisation around UPI. Low-ticket subscriptions, UPI Autopay mandates, and small IAPs fit Indian willingness-to-pay far better than card-first, high-ticket models imported from the West.
- Treat iOS as the value channel. Small on installs, large on spend — sequence it according to whether you are volume-led or monetisation-led.
- Go multi-store where you are India-first. Play for volume, Indus and GetApps for margin and vernacular reach.
The strategic meta-point is that India is not one market but a stack of sub-markets fragmenting by geography, language, income tier and platform. The teams that treat that fragmentation as an asset — pricing, creative, onboarding and channel mix tuned per sub-market — compound advantage; the teams running single-creative, single-bid, single-region campaigns watch their effective costs deteriorate even as the headline market grows. If you want this turned into a portfolio-specific plan, that is exactly the work our India app marketing team does, and you can talk to us directly about your numbers.
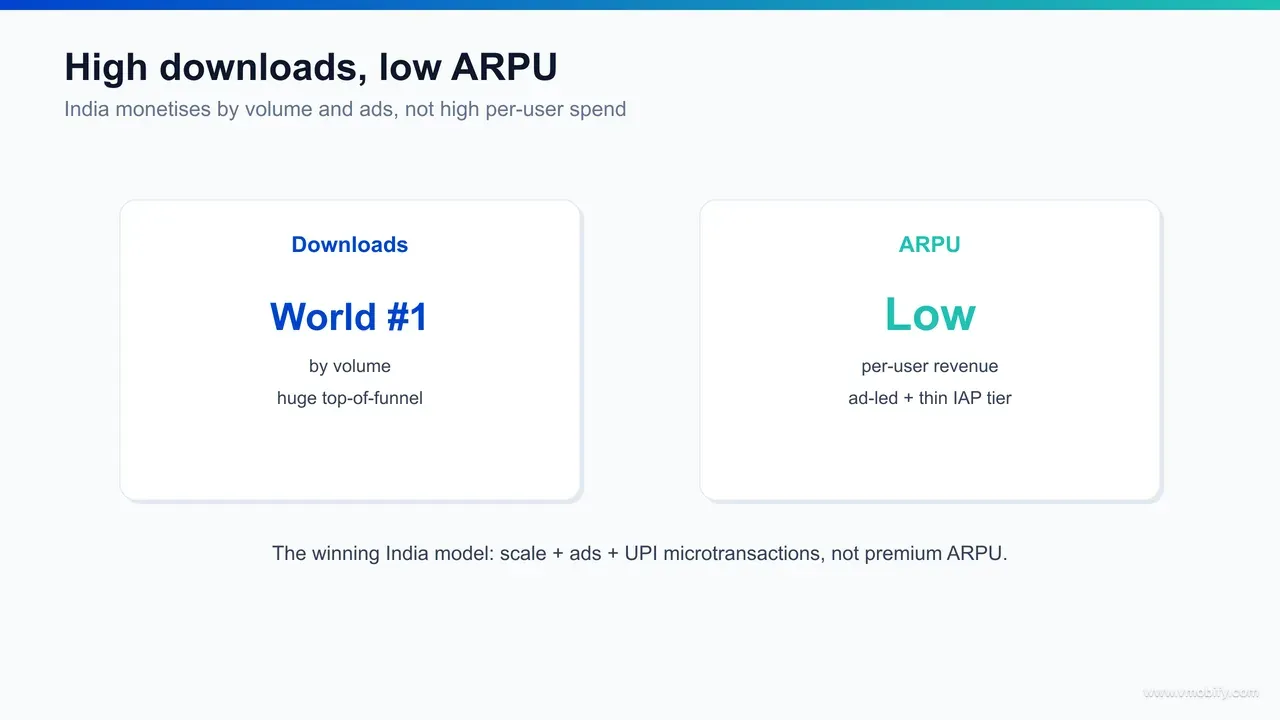
Why is India a high-downloads but low-ARPU market?
India leads the world on app downloads but sits far down the table on revenue per user — average revenue per user is a fraction of US, Japan or Western European levels — because the market combines an enormous, price-sensitive, mobile-only base with monetisation that skews heavily ad-led and a thin in-app-purchase and subscription top tier. This is the most important single nuance in the entire benchmark, and the one foreign teams most often miss.
The mechanics are straightforward once you separate volume from value. India's download leadership comes from the sheer size and youth of the base plus near-free data and cheap devices — installing is free and frictionless, so users install prolifically. But the same affordability that drove device adoption caps spending power: discretionary income per user is low, credit-card penetration is thin, and willingness to pay for digital goods is modest by global standards. The result is a market that is colossal on the top of the funnel and slim on the bottom.
Three consequences follow that every India monetisation plan has to price in:
- Revenue skews ad-led. For most consumer categories, advertising — not subscriptions or IAP — is the primary revenue engine, because reaching scale is easy and charging per user is hard. Ad ARPU is low per head but the head count is vast.
- The paying tier is thin but real. A small slice of users — concentrated on iOS and in metros — does pay, and pays at globally respectable rates. Subscription and IAP businesses in India are built by serving that thin top tier well, not by converting the mass base.
- Low ticket, high frequency is the winning shape. UPI made ₹49 and ₹199 price points convert; the model that works charges small amounts often, not large amounts rarely.
The strategic implication is not "India does not monetise" — it clearly does, at enormous aggregate scale. It is that you must monetise the Indian way: volume-and-ads at the base, a well-served premium tier at the top, low-ticket UPI-native pricing throughout, and realistic per-user revenue expectations benchmarked against India, not against your home market. An app that imports US ARPU assumptions into an India plan will mis-size everything from CAC ceilings to runway. In our portfolio, the India businesses that thrive are the ones that internalised this early and built for high-volume, low-ARPU economics from day one rather than discovering it after launch.
What are the sources, and how should you use these numbers?
Every figure in this benchmark is reported, approximate and attributed — drawn from Statista, IAMAI, PIB/NPCI, Sensor Tower and data.ai — and should be used as a directional sizing and expectation-setting tool, never as an audited account. App-market statistics are estimates that vary between trackers, methodologies and reporting windows, so the right discipline is to anchor on the direction and the order of magnitude, then validate against your own first-party data.
Here is how we recommend using each class of number:
- Market-size and download figures (Sensor Tower, data.ai) — use for opportunity sizing and competitive context, not for forecasting your own installs. They tell you the pond is huge; they do not tell you your share of it.
- User-base and connectivity figures (Statista, IAMAI) — use for total-addressable-market reasoning and for understanding the vernacular and Tier-2/3 shift. The trend matters more than the precise count.
- UPI and payments figures (PIB/NPCI) — use to justify UPI-native monetisation and to understand why checkout friction is no longer your bottleneck. These are among the more reliable hard numbers because they come from the payments operator itself.
- Platform-split and ARPU figures (data.ai, device trackers) — use to set platform sequencing and realistic revenue-per-user expectations. The ratios are more stable than the absolute rupee values.
The single rule that prevents most mistakes: treat any India app-market statistic as a band, not a point. "Roughly 750 million-plus users", "about 95% Android", "on the order of 228 billion UPI transactions" — the hedge words are doing real work, because the underlying estimates genuinely move. Cite the band, attribute the source, and build a plan that survives the number being 15% off in either direction.
If you want these macro numbers turned into a concrete, portfolio-specific growth plan — geo and language splits, platform sequencing, UPI-native monetisation, and a multi-store distribution map — that is the work our team does across our 300+ apps managed since 2013. Start with our India install trends report for the year-on-year movement, then get in touch to size your own opportunity against these benchmarks.
Frequently Asked Questions
How many app downloads does India have per year?+
India is among the world's largest app-download markets — frequently reported as the single largest by raw install volume — per trackers such as Sensor Tower and data.ai. Treat the figure as directional and attributed; exact annual counts vary by source and methodology.
How many smartphone users does India have in 2026?+
On the order of 750 million-plus, with credible forecasts pointing higher as devices and data get cheaper, per Statista and IAMAI. It is the second-largest connected population in the world after China and is still growing while most large markets have plateaued.
How big is UPI in India?+
UPI processed roughly 228 billion transactions in calendar year 2025 per PIB/NPCI figures and accounts for broadly 80%-plus of India's digital-payment volume. It is the rail that made low-ticket app monetisation viable for a largely card-free audience.
What is the Android vs iOS split in India?+
Roughly 95%-plus Android and low-single-digit iOS by installed base — one of the most Android-dominant splits of any large market. The small iOS slice, however, carries a disproportionate share of in-app spend, so monetisation-led apps still need it.
Why does India have high downloads but low revenue per user?+
Because it combines an enormous, young, price-sensitive, mobile-only base with monetisation that skews ad-led and a thin in-app-purchase and subscription top tier. Installing is free and frictionless, but discretionary spend and willingness to pay are modest by global standards, so per-user revenue is a fraction of US or Japan levels.
Where is India's app growth coming from?+
Overwhelmingly from Tier-2/3 cities and rural districts, and from vernacular-first users — the "next 200 million" — rather than the saturated metros. Serving that audience in its own language is the largest single growth lever in the market.
Are these India app market statistics exact?+
No — every figure here is reported, approximate and attributed to named sources (Statista, IAMAI, PIB/NPCI, Sensor Tower, data.ai). App-market statistics are estimates that vary between trackers and reporting periods, so use them as directional sizing and expectation-setting tools and validate against your own first-party data.
Sources
- Statista — Mobile internet usage in India — Market overview: mobile-first internet base, usage and revenue context
- Statista — India smartphone users forecast — Source for the ~750M+ smartphone user base and growth trajectory
- IAMAI — Internet and Mobile Association of India — Connectivity, rural internet growth and vernacular-user direction
- PIB — Press Information Bureau (UPI / NPCI data) — Official source for UPI transaction volumes (~228B in CY2025)
- NPCI — National Payments Corporation of India — UPI operator; transaction and digital-payment volume statistics
- Sensor Tower — State of Mobile analysis — Global download rankings placing India at or near the top by volume
- data.ai — State of Mobile — Platform-split, engagement and per-user spend benchmarks for India
About the author
Amol Pomane — Founder, Vmobify
Amol leads Vmobify, a mobile app growth agency that has driven 30M+ downloads and ranked 54K+ keywords across 300+ apps since 2013. He writes about ASO, paid user acquisition, retention, and the operational reality of scaling mobile apps in India and global markets.
Free Growth Audit
See exactly how to scale your app with 13+ years of expertise behind you.
Get My Strategy

