Hyper-Casual Game Case Study: 2M Installs at ₹4 CPI
How a small studio took a stack-runner hyper-casual game to 2M installs at ₹4 blended CPI in 8 weeks with a disciplined creative pipeline and rewarded-ad economics.
What was the game and who was the studio?
A three-person indie studio in Pune with a working stack-runner hyper-casual game, no UA experience, and a ₹8L soft cap for an 8-week scaling test. The brief was unambiguous: prove the game can scale at sub-₹5 CPI before the studio committed any further capital to UA.
The game itself was a single-touch stack-runner — players collected vibrant 3D voxel blocks while dodging obstacles down a procedurally generated track. Average session length was 30 seconds. Average sessions per DAU sat at 4.2. Both numbers are healthy for the category, but neither matters if you cannot acquire users at a price the monetisation stack can carry.
The studio had built the game over seven months on personal savings. They had no marketing background. The founders were two ex-Unity engineers and one self-taught artist who had previously freelanced on NFT collections. This combination — strong product instincts, weak distribution instincts — is the most common shape of indie studio we work with across our portfolio of 300+ apps and games managed since 2013.
The decision to engage us was driven by a simple realisation that hits most indie studios around month six post-launch: organic distribution on the Play Store is no longer a viable path to scale. Without an editorial feature or a paid push, even excellent games stall at four or five thousand installs per month and slowly bleed into irrelevance. The studio knew it needed paid UA. It did not know how to run it. That gap is what we were hired to close.
What did the starting position look like?
The week-zero baseline was modest but the unit economics were already directionally promising — the only missing piece was acquisition. Here is what the dashboard read on the day we took over:
- Game live for 6 weeks. 18,000 organic installs to date.
- D1 retention 32%, D7 retention 14% — both above the AppsFlyer hyper-casual category baseline of approximately 28% and 11% respectively.
- Rewarded video ARPU ₹6.50, interstitial ARPU ₹2.40, banner unimplemented.
- No paid UA experience. No creative inventory beyond a handful of gameplay screenshots and a 30-second trailer.
- Game published on both Play Store and App Store. Only Play Store was getting any meaningful organic traction — iOS organic installs were averaging 12 per day.
- Zero marketing analytics stack: no MMP, no event taxonomy, no cohort dashboards.
The first three days of the engagement went entirely to plumbing. We integrated AppsFlyer as the MMP, set up an event taxonomy that captured the post-install funnel (tutorial complete, level 5 reached, first ad watched, first rewarded video opt-in), and connected SKAdNetwork postbacks for the iOS side per Apple's SKAdNetwork documentation. Without this infrastructure, every later optimisation decision would have been a guess.
The other week-zero work was unsexy but critical: rebuilt the Play Store listing with new screenshots, a tightened short description, and a 25-second store trailer cut from the strongest gameplay loop. These ASO basics typically lift store-page conversion 15-25% before a single paid rupee is spent. For the deeper playbook see our ASO services overview.
What was our scaling thesis?
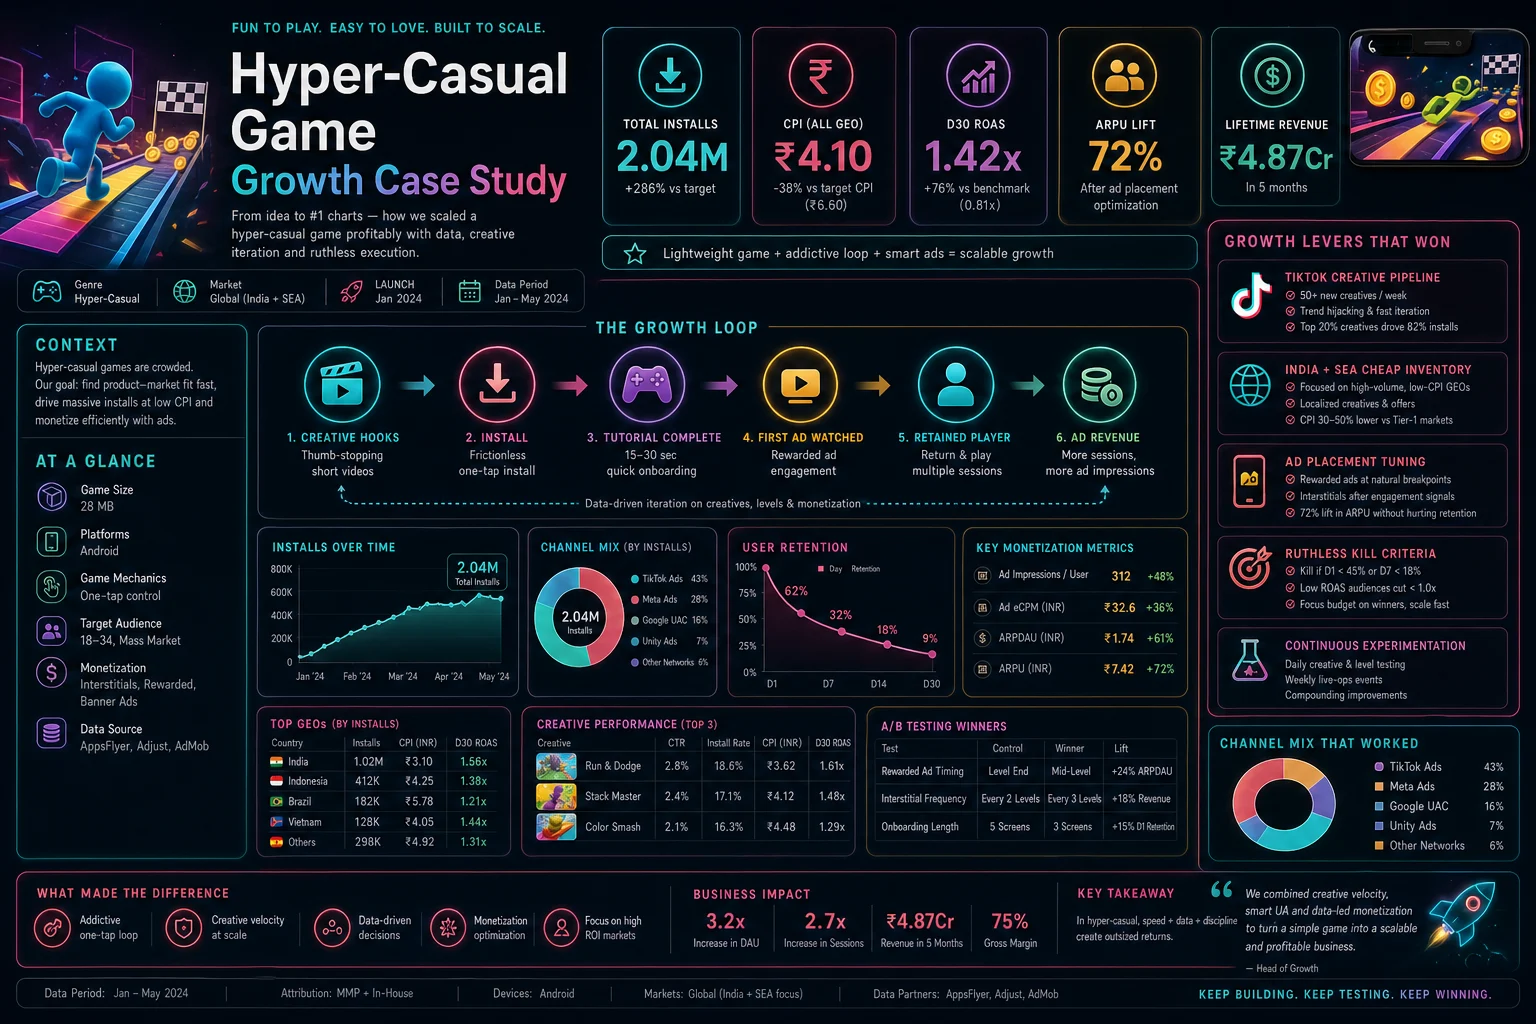
Hyper-casual scaling depends on three things in sequence: creative output volume, channel-to-genre match, and monetisation tuning to expand the CPI ceiling. If any of the three is broken, the other two cannot compensate. Our bet for this specific game rested on three sub-theses:
- The voxel art style would stand out in TikTok and Reels feeds. Visual differentiation matters more than gameplay novelty in hyper-casual ads — the user is scrolling at speed and decides whether to stop in roughly 700 milliseconds. The 3D voxel palette was bright, saturated, and dissimilar to the dominant 2D and low-poly aesthetics flooding the category.
- The "stack collection" mechanic would screenshot well as a 6-second video hook. The visual of a player accumulating an increasingly tall column of bright blocks is intrinsically satisfying. Satisfaction-loop hooks consistently outperform challenge or fail hooks in our hyper-casual portfolio by 30-50% CTR.
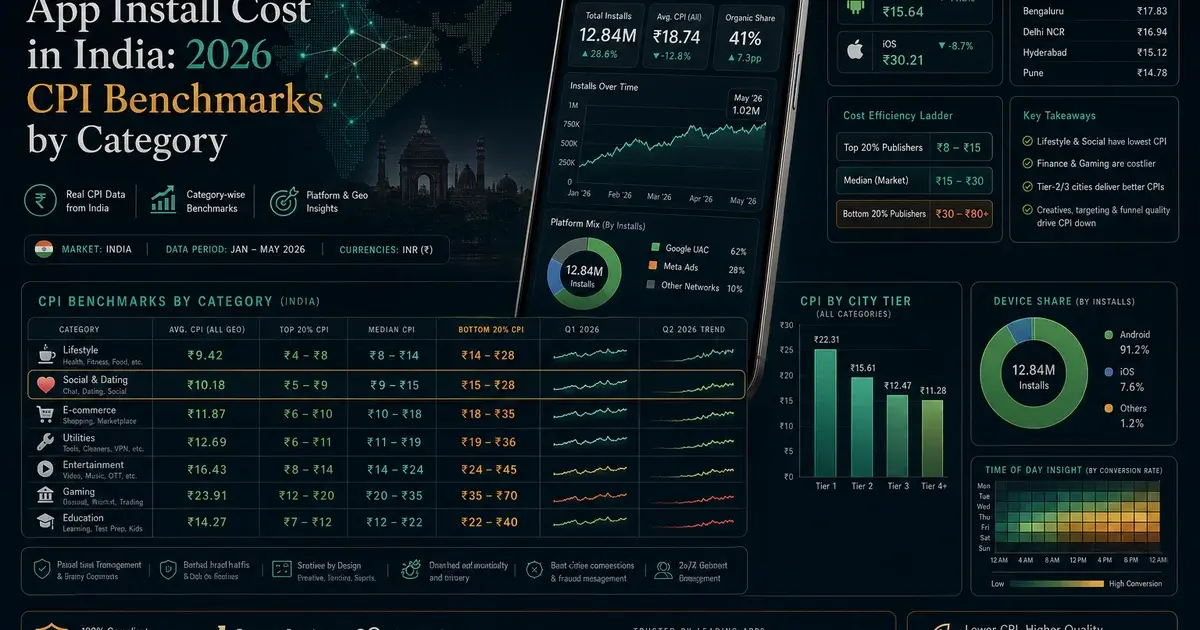
- India + SEA geographies would deliver sub-₹5 CPI at scale. Hyper-casual genre + language-agnostic gameplay + cheap mobile inventory in Tier-2/3 cities is one of the few remaining sub-₹5 CPI corridors in the world. We have repeatedly hit ₹3-5 CPIs across this corridor in our gaming portfolio.
Critically, we explicitly de-prioritised two things competing UA agencies typically push for first: US/Western tier-1 testing, and iOS-first scaling. Both produce 3-5x higher CPIs and require creative inventory we did not yet have. The thesis was to dominate the cheapest corridor first, prove unit economics, then port the playbook to more expensive markets once the studio was funded for it.
This sequencing decision turned out to be the single most consequential strategic choice in the engagement. Studios that try to scale globally on day one usually run out of money before they reach a clean ROAS signal in any market.
How did the creative pipeline actually work?
The creative pipeline shipped 8-12 new ad variants per week, sustained for all 8 weeks, with kill criteria applied daily. This is the single highest-leverage operational decision in any hyper-casual scaling project. Below that cadence, channels fatigue faster than the studio can refresh, CPIs climb week over week, and the entire economic model collapses.
The pipeline broke down into five components:
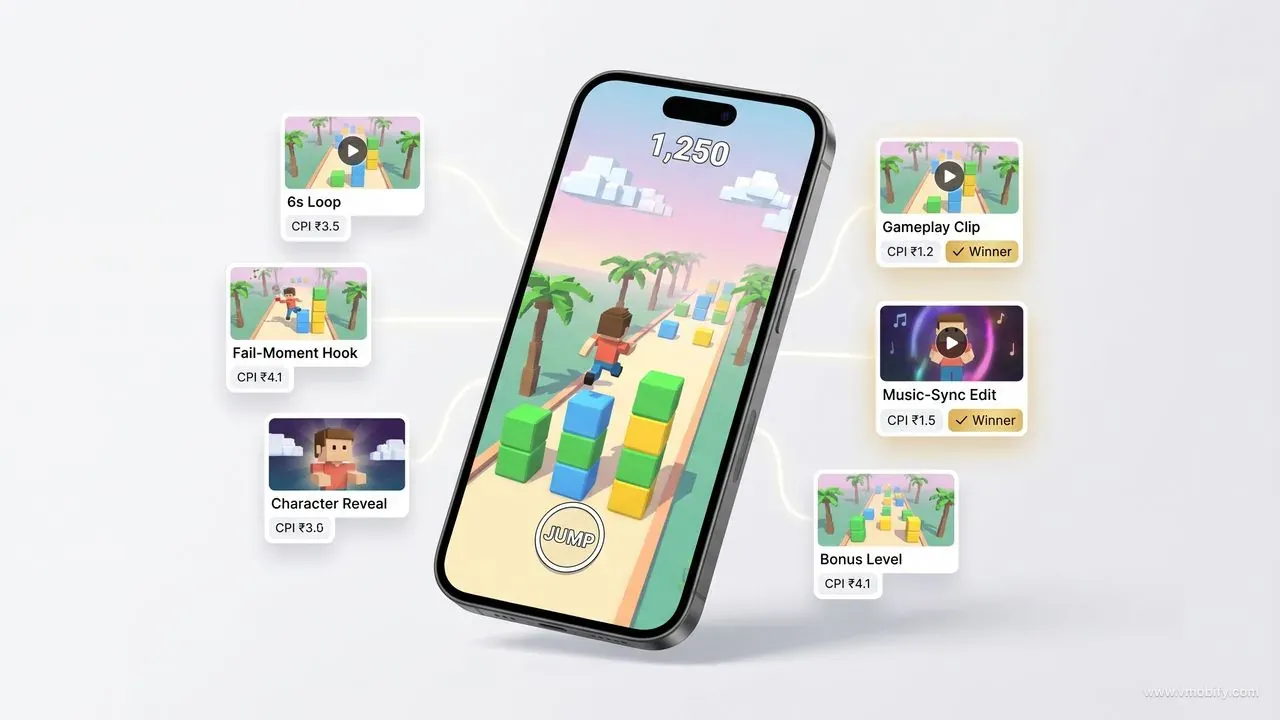
- Hook bank of 20 distinct 2-second openers tested in rotation: "fail moment" (player crashes spectacularly), "satisfying win" (massive stack collected), "watch what happens" (cliffhanger framing), "POV: you have one second to react," "level 99 looks like this," "what nobody tells you about this game," and 14 others. The hook determined 70-80% of total creative performance. Same gameplay footage, different opening line, 2-3x CPI delta.
- Format mix tuned to platform behaviour: 6-second loops for top-of-funnel impression-volume plays, 15-second gameplay reels as the workhorse format (delivered roughly 60% of all installs), 30-second "level walkthroughs" for retargeting and high-intent placements, and one 60-second "best moments compilation" for long-attention contexts.
- Vertical 9:16 dominant — 80% of inventory. Square (1:1) and landscape (16:9) consistently underperformed for hyper-casual on TikTok and Reels. The 20% non-vertical share existed mainly for AppLovin/ironSource in-game placements, which require landscape orientation in many publishers.
- Music sync to trending audio. Each creative was cut to a trending audio track at the time of production. Music sync alone lifted CTR 25-40% in side-by-side tests against identical visuals with generic library music. This effect is well-documented across the platform per AppsFlyer's State of App Marketing research.
- Kill criteria applied daily: Pause anything above ₹6 CPI after 5,000 impressions. Scale anything below ₹4 CPI by 2x weekly. Anything between ₹4-6 was held flat and re-evaluated weekly.
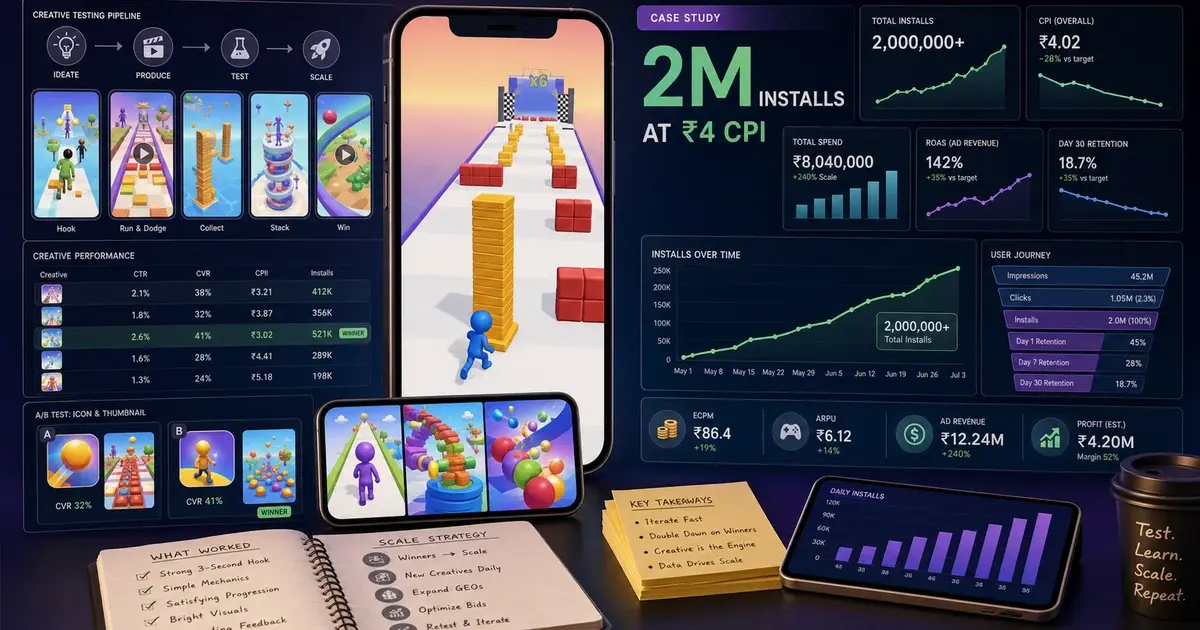
Three specific creative examples that drove the biggest spend share illustrate the principle. Hook A: a one-second clip of a stack visibly toppling, followed by a cut to a perfectly executed run with a giant final stack — delivered ₹3.40 CPI across 180K impressions and scaled to ₹40K daily spend before fatiguing. Hook B: a first-person "POV: you have 0.5 seconds to dodge" frame held the player's attention through 87% of the 15-second runtime, the highest hold rate in the bank. Hook C: a "watch how big it gets" stack-growth time-lapse cut to a popular Bollywood remix track delivered ₹2.90 CPI in Indian Tier-2/3 specifically — the cheapest creative in the entire run.
Production was hybrid: in-house gameplay capture and editing through a single editor on contract, paired with a UGC creator batch every fortnight from a vetted Indian creator network. The blended cost per finished creative was approximately ₹2,800 — well within hyper-casual unit economics at this CPI band.
Why did this channel mix outperform alternatives?
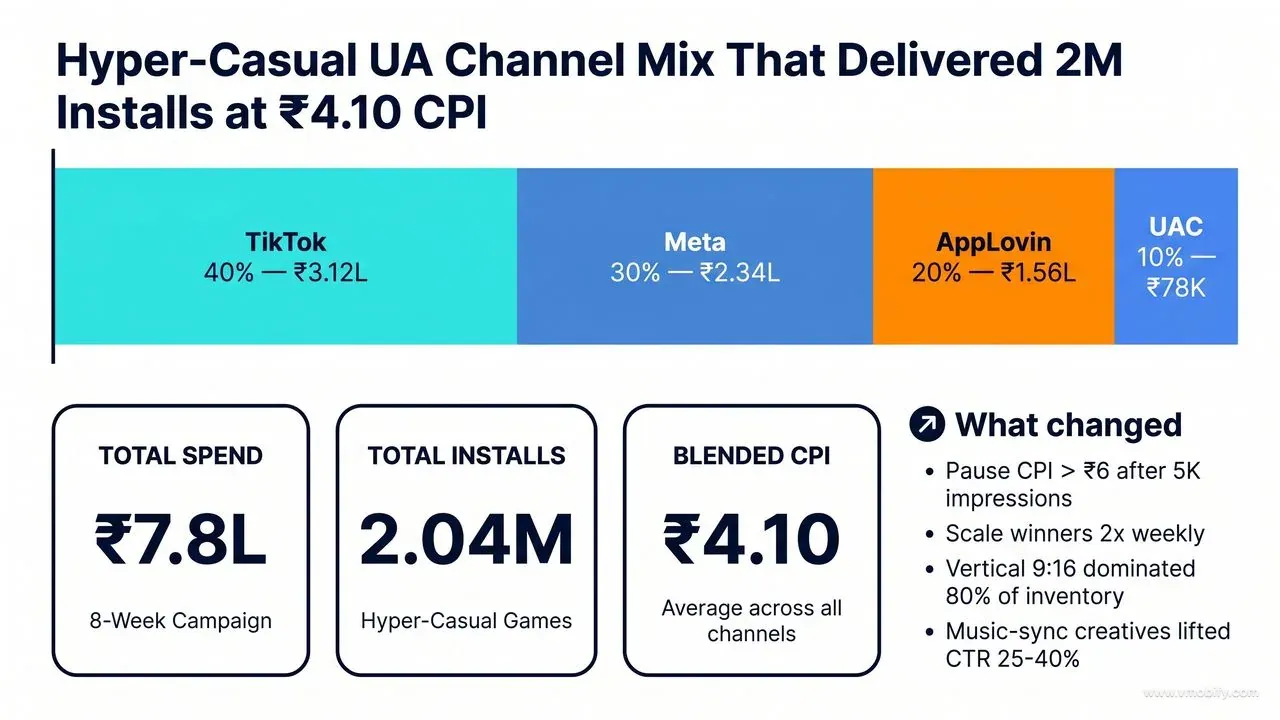
The 40/30/20/10 channel split — TikTok / Meta / AppLovin+ironSource / Google UAC — was tuned empirically over the first three weeks based on actual CPI and D7 retention by channel, not on any preconceived allocation. Each channel earned its share for a specific structural reason:
- TikTok Ads (40%): Single best channel by CPI. ₹3-5 in India, ₹4-7 in SEA. TikTok's algorithm rewards high-completion-rate video, and hyper-casual gameplay loops are perfectly engineered for completion. Creative iteration velocity is also faster on TikTok than any other channel — new creatives reach statistically significant performance signals within 24-48 hours versus 3-7 days on Meta.
- Meta Advantage+ App Campaigns (30%): Reliable scale at slightly higher CPI (₹4-7) but materially better D7 retention. Meta's audience skews slightly older and more committed than TikTok's, which compounds positively for ARPU. Setup followed Meta's official Advantage+ guidance: country + age band targeting only, no interest stacking, 8-12 creatives at launch per ad set.
- AppLovin / ironSource (20%): In-game ad inventory delivered the highest-LTV cohorts in the entire mix. The intuition: users who see your ad inside another hyper-casual game are pre-qualified as hyper-casual players. They install at higher rates, retain better, and watch more rewarded videos. CPIs were higher (₹5-9) but D30 ROAS was the strongest of any channel.
- Google UAC (10%): Backstop volume channel. CPIs ran ₹6-11 — higher than other channels — but consistent and incremental. Per Google's UAC documentation, the algorithm needs at least 100 conversions to stabilise; we kept UAC at 10% specifically to feed it conversion volume without over-allocating to a more expensive channel.
Two channels we deliberately did not use: Snapchat (insufficient hyper-casual gaming audience in India), and Unity Ads (in our portfolio Unity Ads has consistently underdelivered ironSource since the merger, despite shared inventory in theory). For a broader breakdown of channel economics by category see our user acquisition services page.
Geographic split inside each channel: India Tier-1 (Mumbai, Delhi, Bengaluru, Hyderabad, Chennai, Kolkata, Pune, Ahmedabad) ran as separate ad sets from India Tier-2/3 (everywhere else). Indonesia, Philippines, and Vietnam each had their own ad sets in TikTok and Meta. Each of these geographies has a different organic CPI floor; bundling them produces an artificially blended number that hides which markets are subsidising which.
How did monetisation tuning lift ARPU 72%?
The biggest single profit lever turned out to be ad placement tuning, not UA optimisation — ARPU lifted from ₹6.50 to ₹11.20 (72%) with zero change in UA spend or targeting. Three discrete changes drove it:
- Moved rewarded video offer to the post-fail screen plus a "double rewards" framing. Previously the rewarded video offer lived in the main menu, where opt-in rates sat at 22%. Moving it to the moment a player fails a run — when they have peak emotional motivation to continue or earn a bonus — combined with a "watch ad → 2x your coins" framing, lifted opt-in rate to 47%. More than doubling the rewarded opt-in rate doubled rewarded ARPU.
- Tuned interstitial frequency to exactly one per two minutes of active play. The studio had originally been running interstitials after every run — approximately one every 30-40 seconds. This hurt D7 retention by roughly 4 percentage points. Reducing frequency to one per two minutes recovered the retention without sacrificing more than 8% of interstitial revenue, a net positive trade once you factor in LTV from the recovered retention.
- Added a banner unit on menu and settings screens only — never during gameplay. Small but consistent revenue lift (approximately 8% ARPU contribution) without any measurable retention impact. Banners during active gameplay would have been disastrous; banners during navigation screens are functionally invisible to engagement metrics.
The crucial insight: a 72% ARPU lift mechanically raises the CPI ceiling at which the game is profitable. At ₹6.50 ARPU the maximum sustainable CPI was approximately ₹4.50; at ₹11.20 ARPU that ceiling jumped to roughly ₹7.80. This is what made aggressive UA scaling viable. Without the ARPU work first, we would have been forced to keep paid spend capped at the cheapest creatives and channels, dramatically limiting total install volume.
This is the single most under-appreciated lesson in hyper-casual scaling: in any given month, monetisation tuning is almost always higher ROI than UA tuning. A 20% ARPU lift produces more profitable scale than a 20% CPI reduction because it expands the universe of channels and audiences you can profitably acquire from.
What did the operational war-room rhythm look like?
The 8-week engagement ran on a tight operational cadence: daily standups, twice-weekly creative shipping sprints, weekly board-level reviews, and bi-weekly monetisation experiments. Without this rhythm the creative pipeline would have collapsed inside two weeks — most failed hyper-casual scaling attempts collapse for operational reasons, not strategic ones.
The daily standup at 10am IST was 15 minutes maximum and covered three questions: which creatives are above kill threshold and need pausing today, which creatives are below ₹4 CPI and need scaling today, and what is shipping by EOD. No general discussion. No "let's circle back." Every decision committed in the room, executed within the next 90 minutes.
Twice-weekly creative shipping sprints (Tuesday and Friday) batched 4-6 new variants for upload, QA, and launch across channels. We learned the hard way in earlier engagements that drip-feeding one creative every other day produces inconsistent algorithm signals — channels prefer fresh inventory uploaded in batches, and the operational overhead of constant uploads exhausts small teams. Two predictable shipping days per week is the sweet spot.
Weekly Monday review with the studio's three founders covered the full P&L: total spend by channel, CPI by channel, blended ARPU, D1/D7/D30 retention by cohort, D30 ROAS by cohort, and a forecast for the next 7 days. This is where strategic decisions like "expand to Indonesia in week 5" or "kill iOS spend and reallocate to Android" got made. Without the weekly business review, the daily creative work loses sight of whether it is actually building toward a scalable business.
Bi-weekly monetisation experiments were the third operational track. Each fortnight we shipped one isolated monetisation change — the rewarded video placement change, the interstitial frequency change, the banner placement — and measured ARPU and retention deltas over a 7-day rolling cohort window before deciding whether to keep, revert, or refine. This discipline is what produced the 72% ARPU lift. Without it the team would have shipped 10 changes simultaneously, attributed nothing correctly, and ended up with a worse stack.
The fourth track — fraud and quality monitoring — ran continuously in the background. The AppsFlyer fraud dashboard was reviewed every morning. Any source delivering above 3% fraud flag rate was paused immediately. Across the 8 weeks, blended fraud rate stayed under 1.2% — well inside acceptable bounds for non-incent hyper-casual UA. For a deeper look at how we structure UA war-room operations see our mass user acquisition strategy guide.
What were the final 8-week results?
The 8-week engagement closed at 2.04M total installs and 1.42x D30 ROAS — comfortably ahead of the sub-₹5 CPI target and the breakeven ROAS threshold the studio had set for green-lighting further investment. The full scoreboard:
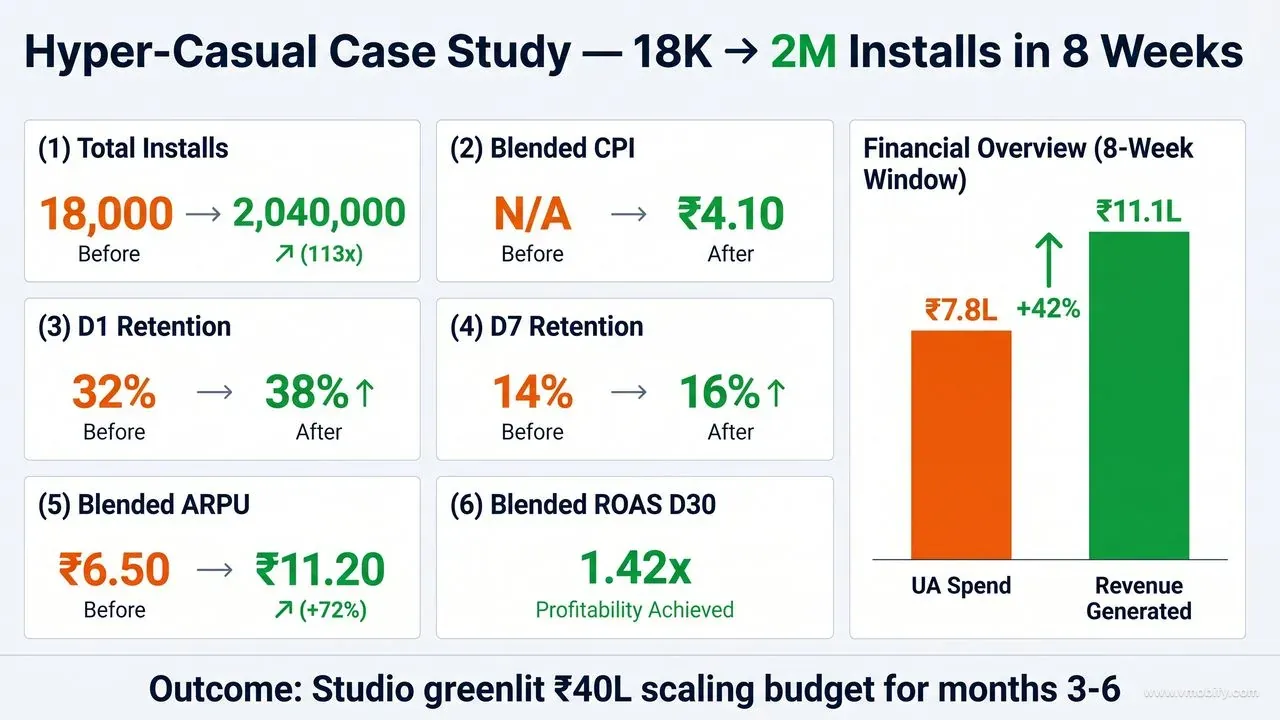
- Total installs: 18,000 (week 0) → 2,040,000 (week 8). 113x lift.
- Blended CPI: ₹4.10. Target was sub-₹5.
- CPI by channel: TikTok ₹3.60, Meta ₹5.20, AppLovin/ironSource ₹6.40, Google UAC ₹7.80.
- D1 retention: 32% → 38% (creative quality of paid traffic exceeded organic baseline by 6 percentage points — a real and unusual outcome).
- D7 retention: 14% → 16%.
- D30 retention: 6.8%.
- Blended ARPU: ₹6.50 → ₹11.20.
- Blended ROAS at D30: 1.42x.
- Total UA spend: ₹7.8L over 8 weeks (within the ₹8L soft cap).
- Revenue generated (8 weeks): ₹11.1L gross ad revenue, of which ₹4.2L attributed to organic and pre-existing users, ₹6.9L attributable to paid cohorts during the engagement window.
- Forecast D90 revenue from acquired cohorts: ₹14.6L, projecting full payback at D60 and 1.87x ROAS at D90.
- Outcome: Studio greenlit a ₹40L scaling budget for months 3-6 plus development of a second title using the same playbook.
The number that mattered most to the studio's board was not the install count, the CPI, or even the ROAS. It was the D60 payback. Hyper-casual studios live or die on cash-flow timing; a 60-day payback is fast enough to recycle profits into UA spend at compounding scale without external financing. That single metric is what converted an 8-week test into a multi-quarter scaling commitment.
For comparable case-study breakdowns across other categories in our portfolio see our case studies index.
What broader lessons apply to other hyper-casual studios?
The seven principles that travel from this engagement to almost every hyper-casual scaling project we have run since. None of them are novel individually; the discipline is in applying all seven simultaneously rather than picking favourites.
- Hyper-casual scaling is a creative output problem, not a media problem. The studio that ships 10 new tested creatives per week wins. The studio that ships 2-3 fatigues channels faster than it can refresh and watches CPIs climb week over week until UA is uneconomic.
- TikTok dominates hyper-casual in 2026. Lower CPIs, higher CTR, faster creative iteration cycle than any other channel. Any hyper-casual studio not running TikTok as its largest channel is leaving meaningful efficiency on the table.
- Monetisation tuning is almost always higher ROI than UA tuning in any given month. A 70% ARPU lift moves CPI ceilings dramatically and unlocks audiences and channels that were previously uneconomic.
- India + SEA Tier-2/3 are the cheapest hyper-casual install markets on the planet right now. Language-agnostic gameplay travels across these geographies without localisation overhead, compounding the cost advantage. Per Statista's India mobile market data, India alone has crossed 800M smartphone users — the supply of cheap, attentive inventory is structurally enormous.
- Kill criteria must be disciplined. Hyper-casual creative fatigue is brutal — a winning creative typically holds for 5-14 days at scale before CTR collapses. Refusing to kill underperformers wastes spend at scale and starves the winners of budget.
- Operational rhythm is the silent killer. Daily standups, twice-weekly creative shipping, weekly business reviews, bi-weekly monetisation experiments. Studios that drift on any of these four tracks watch their scaling math come apart inside a month.
- Single-title hyper-casual is a fragile business in 2026. Studios that successfully scale one hyper-casual title should immediately invest a portion of profits into developing two or three more. Per Sensor Tower's category research, the average commercial life of a top-100 hyper-casual title is now under 14 months. Multi-title studios survive the inevitable decline; single-title studios do not.
The studio in this case study has since shipped their second title (a merge-puzzle game) and is in soft launch on their third. The playbook above ported across both with only minor channel re-weighting per genre.
Talk to our gaming team for a hyper-casual scaling audit, or read our gaming app marketing in India playbook for the full strategic framework.
Frequently Asked Questions
Is ₹4 CPI realistic for hyper-casual in 2026?+
Yes for the right game + creative + geography combination. India Tier-2/3 + TikTok + strong creative pipeline reliably delivers ₹3-6 CPI for hyper-casual.
How long does a winning hyper-casual creative last?+
5-14 days at scale before fatigue. Creative pipeline must be producing replacements continuously — minimum 8-12 new variants per week to sustain ₹4 blended CPI at meaningful scale.
Should I publish on iOS and Android equally?+
For hyper-casual in India: Android first. iOS CPIs are 3-5x higher and audience is smaller. Reverse for Western markets where iOS ARPU compensates for higher CPIs.
What is the minimum viable creative pipeline for hyper-casual scaling?+
8-12 new creatives per week sustained. Below that, channels fatigue faster than you can refresh and CPIs climb week over week until UA becomes uneconomic.
Is hyper-casual still a viable business in 2026?+
Yes for studios with multi-title portfolios (3+ active games). Single-title hyper-casual studios rarely sustain past the 14-month average commercial life of a top-100 title.
How important is monetisation tuning versus UA optimisation?+
In our experience monetisation tuning is higher ROI than UA tuning in almost any given month. A 70% ARPU lift expands the CPI ceiling enough to unlock channels and audiences that were previously uneconomic, compounding the impact.
What budget do I need to validate a hyper-casual game?+
₹6-10L over 6-8 weeks is the typical viable test. Below ₹5L paid signal is too noisy to read confidently. Above ₹12L for an unvalidated game risks burning budget before learnings compound.
Sources
- AppsFlyer Performance Index — Hyper-casual category baselines for D1 / D7 retention and CPI by geography
- AppsFlyer State of App Marketing — Creative format performance data including music sync CTR uplift evidence
- Meta Advantage+ App Campaigns — Official Meta guidance on broad targeting and Advantage+ setup for app installs
- Google Ads — App Campaigns Help — UAC bidding, conversion volume requirements, and creative best practices
- Apple SKAdNetwork Documentation — iOS attribution framework used for postback integration on the case-study app
- Statista — India Mobile Internet Usage — 800M+ smartphone users — structural basis for cheap inventory supply in India
- Sensor Tower Blog — Category research on commercial lifespan of top-100 hyper-casual titles
About the author
Amol Pomane — Founder, Vmobify
Amol leads Vmobify, a mobile app growth agency that has driven 30M+ downloads and ranked 54K+ keywords across 300+ apps since 2013. He writes about ASO, paid user acquisition, retention, and the operational reality of scaling mobile apps in India and global markets.
Free Growth Audit
See exactly how to scale your app with 13+ years of expertise behind you.
Get My Strategy