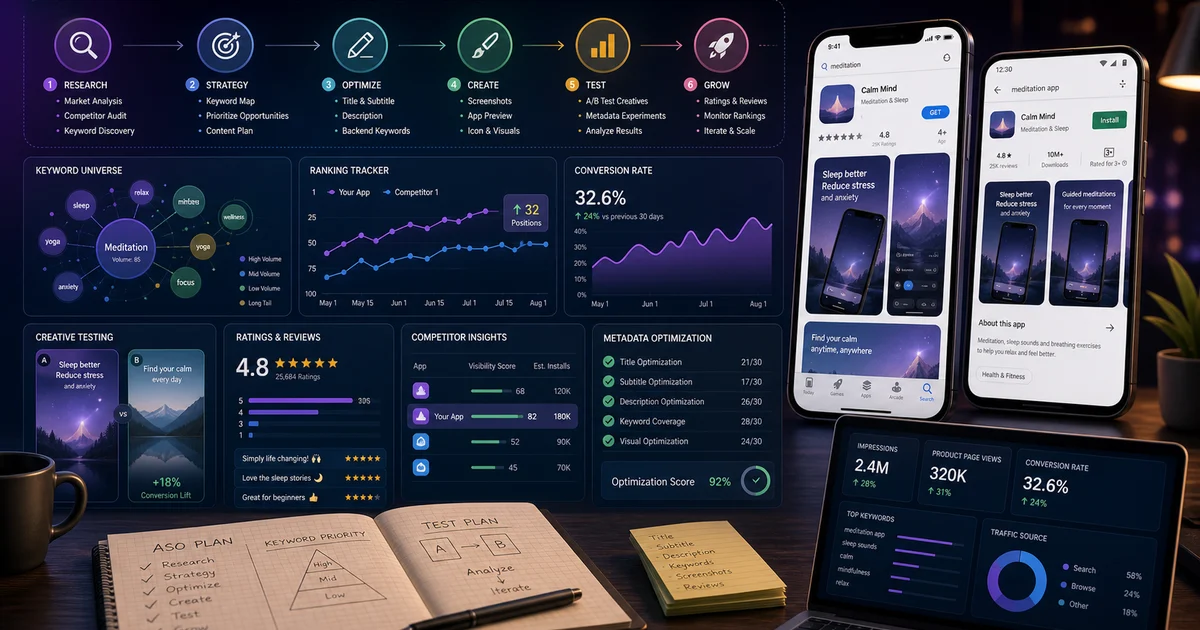
ASO Optimization Complete Guide: Rank Your App in 2026
Every ASO ranking factor, ranked by impact — from building a keyword universe to Custom Product Pages, off-metadata signals, and the measurement framework that separates compounding programmes from one-off tweaks. Built from first-hand results across 300+ apps.

What is ASO and why does it matter in 2026?
App Store Optimisation (ASO) is the discipline of improving an app's discoverability and conversion rate inside app store environments — and in 2026 it is the highest-return marketing investment available to any mobile growth team. According to AppsFlyer's State of App Marketing, roughly 65% of all app installs still originate from organic store discovery — search, browse, and featured placements — meaning that the majority of downloads happen before a single rupee or dollar of paid UA is spent.
ASO operates across two interdependent objectives. Discoverability is about ranking for the right keywords and appearing in browse or featured placements. Conversion is about turning listing visitors into installs. These objectives reinforce each other in a compounding loop: a higher conversion rate signals quality to the algorithm and lifts rankings, while higher rankings send more qualified traffic that converts at higher rates.
What has changed in 2026 is the weight of that loop. Both Apple and Google have shifted their ranking models to weight retention and engagement signals more heavily than keyword presence alone. An app that ranks for a keyword but fails to retain users will be displaced by a lower-ranking competitor that holds its cohorts. This means ASO is no longer a metadata exercise — it is a full-stack signal management programme that touches your store listing, your creative assets, your in-app review prompts, and your onboarding flow simultaneously.
Across the 300+ apps we have managed since 2013, the single most common finding in an initial ASO audit is that the app title contains the brand name twice and no secondary keyword — surrendering the most powerful ranking field in the store to redundant branding. Fixing that alone typically produces a measurable ranking lift within 14 days.
How does the app store algorithm actually rank apps?
Both the App Store and Google Play use a two-stage ranking model: a relevance filter (does this app match the query?) and a quality sort (which relevant apps deserve top positions?). Understanding how each stage is weighted tells you exactly where to invest your optimisation effort.
In the relevance stage, the algorithm checks metadata fields in order of their weighting. On iOS, the hierarchy is: title > subtitle > keyword field > in-app purchase names > developer name. The description is not indexed by Apple. On Google Play, the hierarchy is: title > short description > long description — with the full description indexed in detail, making Android long-description keyword density genuinely impactful.
In the quality sort, the stores weight behavioural signals to decide which relevant apps rank above others. The June 2025 algorithm update on both platforms shifted more weight from raw install volume toward install-to-retention ratios. Apps with strong D7 retention now outrank competitors with more total downloads but weaker engagement. Crash rate and ANR (Application Not Responding) rate are explicit downranking signals on Google Play.
App Store (iOS) ranking signals
- Title keyword match (highest weight)
- Subtitle keyword match
- Keyword field coverage
- Install velocity (trending in category)
- Conversion rate (impressions → installs)
- Ratings average and volume
- In-App Events engagement
- App clip and widget installs
Google Play ranking signals
- Title and short description keywords
- Long description keyword density
- Install volume and velocity
- D1 and D7 retention rates
- Ratings and review velocity
- Crash rate / ANR rate
- External web signals (Play page backlinks)
- Engagement with update cadence
The practical implication: metadata gets you into the relevance pool, but product quality — measured by retention, ratings, and engagement — determines where you rank within that pool. ASO investment that ignores the product experience side will hit a hard ceiling, typically around positions 10–20 for competitive keywords, regardless of how well-optimised the metadata is.
Apple Intelligence now applies semantic matching in App Store search, ranking apps for queries they are semantically relevant to — even without exact keyword matches. This means natural-language metadata that describes what your app genuinely does will outperform keyword-stuffed copy that was written for the 2022 algorithm. Rewrite your descriptions accordingly.
How do you build a keyword universe that covers real search intent?
A keyword universe is the master list of all terms your app could realistically rank for, organised by search intent and competitive difficulty — and building it before touching any metadata is the step most teams skip, leaving 60–70% of indexable keyword real estate unexploited.
Start from five seed categories: category keywords (what your app is — "budget tracker"), use-case keywords (what it does — "track daily expenses"), problem keywords (what pain it solves — "overspending on food"), competitor keywords (branded terms of your top 5 rivals), and audience keywords (how your users describe themselves — "salaried professional savings app"). Each category typically yields 10–20 terms, giving you a starting universe of 50–100 keywords.
Prioritise this list using a three-factor scoring matrix: volume (higher means more potential installs), difficulty (lower means a faster path to the first page), and relevance (only include terms where your app genuinely serves the query intent). The result is a tiered structure:
- 5 head-term targets — high volume, high competition, 90-day ranking horizon. These go in your title and subtitle.
- 15–20 mid-tail targets — moderate volume, moderate competition, the core of your keyword field and description. Expect ranking movement in 30–60 days.
- 20–30 long-tail quick wins — low volume, low competition, rankable in under 30 days. Fill the iOS keyword field and Android description with these.
Data tools are non-negotiable for volume estimation — we use AppTweak and Sensor Tower across our portfolio engagements. Google Play Console's "Store Listing" section also surfaces suggested keywords directly from Google's index — check this before finalising your list. Mine your own reviews for natural-language terms users actually use to describe your app; these are often low-competition and highly relevant.
Sort your keyword list by "difficulty × relevance" before volume. A low-difficulty, high-relevance keyword at moderate volume will compound faster and more durably than a high-volume head term you will never crack. Start where you can win, then move up-funnel.
Refresh your keyword universe every quarter. Seasonal intent shifts (a fitness app's "weight loss" volume spikes every January), new competitor entries, and algorithm changes mean the opportunity landscape is never static. The 2026 ASO trends post covers the seasonal patterns we observe across our portfolio.
Which metadata fields carry the most ranking weight?
On both stores, the title is the single highest-weight metadata field — every keyword placed there carries a ranking multiplier no other field can match, and most apps waste a significant portion of it on non-indexable content.
Here is the field-by-field breakdown for each platform:
- Title (iOS: 30 chars, Android: 50 chars). Lead with your brand name — kept short — then your most important keyword phrase: "BrandName – Budget Tracker & Planner." Every keyword in your title receives the highest indexing authority in the store. Changing the title alone is the single highest-impact metadata action available to you.
- Subtitle / Short Description (iOS: 30 chars, Android: 80 chars). The second-highest weight field. iOS subtitle should contain keywords not already in your title. Android short description is both indexed and displayed prominently in search results — write it as a benefit headline that simultaneously contains your second-priority keyword cluster. Treat it as an 80-character ad.
- iOS Keyword Field (100 chars, invisible to users). Apple's invisible indexing layer. Rules: never repeat words already in your title or subtitle (wasted characters); no spaces between keywords (use commas); use singular forms (Apple indexes both from one form); include competitor-adjacent terms, alternate spellings, and locale variants. Every character is a ranking asset — remove spaces after all commas to maximise keyword count.
- Long Description (Android only for indexing). Google Play indexes the full 4,000 characters. Front-load the first three lines with your top keywords and value proposition — these display before the "read more" truncation. Target each primary keyword appearing 3–5 times naturally across the body. Apple's description is not indexed but should be written for conversion: clear value proposition, benefit bullets, and a strong call-to-action above the fold.
- In-App Purchase names and developer name (iOS). Apple indexes these fields too. Name your IAPs with relevant category terms where possible (e.g. "Premium Plan: Unlimited Budget Tracking" rather than "Premium Tier 1").
iOS's total indexed metadata — title + subtitle + keyword field — is only 160 characters. This is a finite ranking asset. Every character used on a redundant word, a space after a comma, or a term already covered in another field is a character not working for your rankings. Treat it like premium display advertising space.
For a detailed walkthrough of Android-specific metadata structure, see our step-by-step ASO guide. For the complete metadata optimisation process we run on every engagement, explore Vmobify's ASO service.
How do store visuals drive conversion, and which elements matter most?
Visual assets — icon, screenshots, and preview video — are the primary conversion driver in ASO, with optimised creatives consistently delivering 20–40% more installs from the same organic and paid traffic, at zero additional spend. Research from SplitMetrics and StoreMaven places the conversion impact hierarchy consistently in the same order: icon first, first two screenshots second, preview video third, remaining screenshots and feature graphic last.
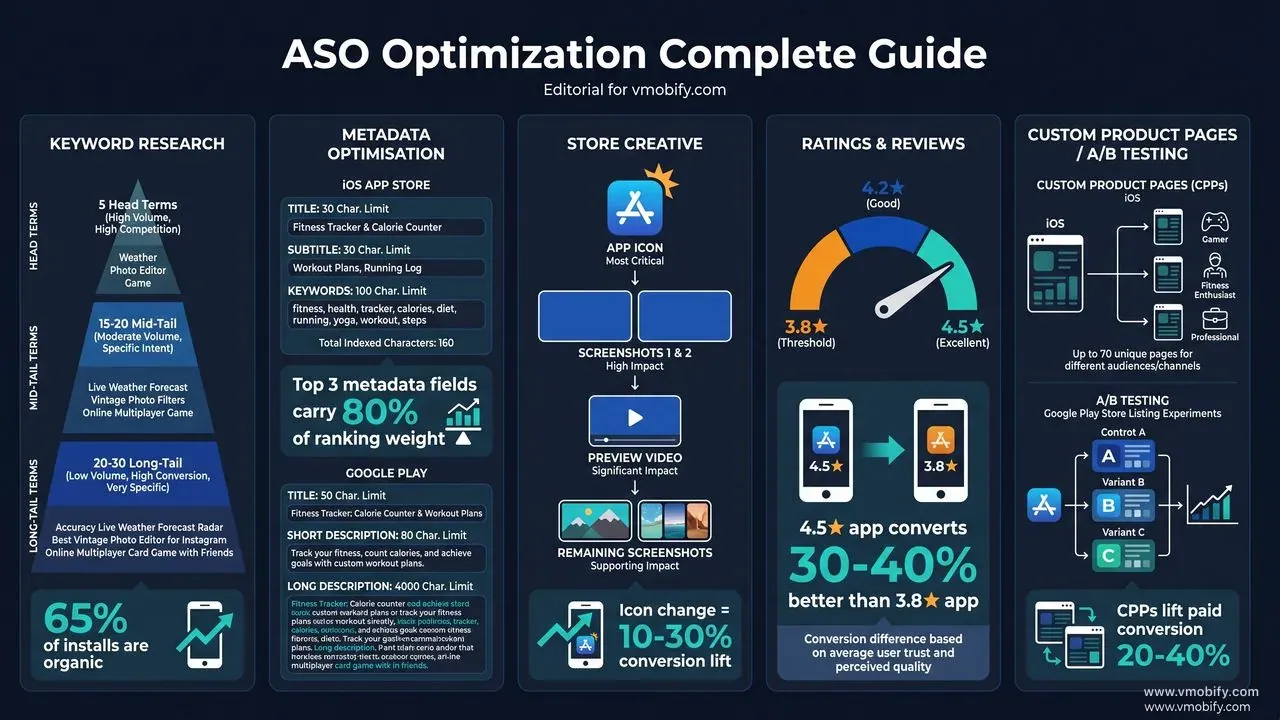
Icon: The icon appears in search results, browse placements, home screens, and notifications. It must be recognisable at 16×16 pixels. Bold, simple designs beat complex ones at small sizes in virtually every A/B test we have run across our portfolio. Avoid text unless your brand name is very short and highly legible at minimum display size. A single bold colour change to your icon routinely produces 10–20% conversion lifts in our tests — it is the most underrated quick win in ASO.
Screenshots 1 and 2: On iOS, screenshots 1 and 2 appear directly in search results before the user taps your listing. They function as a two-panel visual advertisement. Screenshot 1 establishes the core value proposition in 5–7 bold words. Screenshot 2 confirms the primary feature or shows social proof (e.g. "Trusted by 2M users"). Screenshot 3 is your strongest differentiator or objection-handler — it sees the most engagement among users who do visit your listing.
Preview Video / Promo Video: Videos auto-play muted in iOS search results. The first 3 seconds must hook without sound — large on-screen text, product UI visible immediately, no branded intro bumper. High-quality product videos outperform static screenshots for complex apps and games; for simple utility apps, strong screenshots often outperform mediocre videos. Always test having a video versus not having one before testing between two video variants.
- Add concise captions to every screenshot — 5–7 words max, in a large contrasting font, placed in the top third of the image where it clears iOS and Android device chrome.
- Localise visuals for your top 3 markets — even small cultural adjustments (model ethnicity, UI language, colour associations) measurably improve conversion in non-English markets.
- Run at least one icon A/B test before making it permanent. Your first instinct about what the icon should look like is wrong roughly half the time — the data almost always surprises.
A fintech app we work with ran three icon variants in Google Play Store Listing Experiments. The winning variant — a simplified design with a single bold teal symbol — lifted install rate by 23% over the control icon. That single creative change translated to roughly 8,000 additional organic installs in the following 30 days, without any change to keyword strategy or paid spend.
What off-metadata signals determine where you rank?
Off-metadata signals — the behavioural and external signals that the algorithm uses to assess app quality — now carry at least as much ranking weight as keyword placement on both stores, and on Google Play they arguably carry more. Optimising metadata without addressing these signals will hit a ceiling at competitive keywords.
Install velocity and volume: Both stores reward apps actively gaining installs. A sustained daily install rate signals ongoing relevance. Coordinating paid user acquisition with ASO work creates a powerful flywheel: paid campaigns drive install velocity, which improves organic rankings, which reduces blended cost per install over time. Incentivised install spikes from low-quality sources are detectable by both algorithms and can trigger ranking penalties — avoid them.
D1 and D7 retention: Since the June 2025 algorithm update, both stores place measurably more ranking weight on retention rates. Apps with D7 retention below 15–20% will struggle to hold rankings regardless of keyword optimisation quality. This is the most important reason that ASO programmes must work in tandem with onboarding improvements — metadata gets users to the install, product quality keeps them in the algorithm.
Ratings and review velocity: Both the average rating and the volume of recent reviews are direct ranking signals. Apps rated below 4.0 are systematically deprioritised in search and browse placements. According to AppTweak's ASO Benchmarks, 90% of featured apps on the App Store carry a 4.0+ rating. Trigger the native in-app review prompt — SKStoreReviewManager on iOS, the Play In-App Review API on Android — at a moment of demonstrated user satisfaction, not at first open.
Crash rate and ANR (Android): Google Play surfaces crash rate and ANR rate as explicit ranking signals in the Play Console. An app with a crash rate above 1.09% (Google's threshold for "bad behaviour") will see ranking suppression regardless of how strong its metadata and retention are. Monitor these weekly and treat any spike as a P1 incident — the ranking cost of a bad release is immediate.
External web signals (Google Play only): Unlike Apple, Google Play incorporates signals from the broader Google ecosystem — Play Store page backlinks from high-domain-authority sites, and engagement with your Play Store URL across other Google surfaces. Building legitimate press coverage and listings on authoritative app review sites (not incentivised) is a meaningful off-metadata tactic specifically for Android. Check our case studies page to see how we have used PR placement to lift Android rankings for portfolio apps.
How do you run A/B tests that actually reach statistical significance?
Both Apple's Product Page Optimisation and Google Play's Store Listing Experiments provide free native A/B testing against live store traffic — and they are among the most underutilised capabilities in ASO, because most teams run tests that are too small, too short, or too parallel to be interpretable.
The sequencing that works consistently across our portfolio:
- Icon first. It has the highest impression volume in search results and the largest single swing in conversion. Test a simplified colour variant against your current icon before testing anything else.
- Screenshots 1 and 2 next. These are the only screenshots most users see without scrolling. Test value-led variants (lead with benefit) against feature-led variants (lead with UI screenshots).
- Preview video vs. no video third. Establish whether a video helps or hurts before testing between two video variants. Many utility apps convert better without a video.
- Description and feature graphic last. Smallest conversion swings, but worth testing once the high-impact elements are locked.
Test design rules that separate reliable results from noise:
- Test one variable at a time. Running icon and screenshots simultaneously makes it impossible to attribute a result to either change.
- Run each test for a minimum of 2 weeks to account for day-of-week variance in user behaviour. Weekend traffic often converts differently from weekday traffic.
- Aim for at least 1,000 impressions per variant before evaluating — smaller samples produce statistically unreliable winners that revert when implemented.
- Use a 95% confidence threshold before implementing a winning variant. "Trending toward" wins should continue running, not be called early.
- Allow 3–4 weeks between major metadata updates to give the algorithm time to re-index and for ranking changes to stabilise before measuring.
For pre-launch testing or apps with thin traffic, third-party tools like SplitMetrics allow paid-traffic A/B testing of concepts before they enter the native store experiments. This is especially useful for validating a new icon design for a freshly launched app that lacks the impression volume for statistically valid native testing. Document every test with hypothesis, variant description, traffic allocation, sample size, result, and action taken — over time, this builds a creative pattern library of what resonates with your specific audience.
A creative set that wins in Q1 may underperform during the holiday season when user intent shifts. Build quarterly visual refresh cycles into your ASO calendar. Our advanced ASO strategies guide covers the seasonal testing patterns we follow across our portfolio.
What are the key differences between iOS and Android ASO?
iOS and Android ASO share the same objectives but differ in algorithm architecture, metadata structure, indexing behaviour, and update cadence — and running an identical strategy on both stores without platform-specific adaptation leaves significant ranking potential unrealised on both.
iOS ASO
- Title: 30 chars (highest weight field)
- Subtitle: 30 chars (second highest)
- Keyword field: 100 chars, invisible, comma-separated
- Description: NOT indexed — written for conversion only
- Algorithm: heavily weights metadata precision + retention
- Updates: 1–3 day review cycle
- Custom Product Pages: up to 70 per app
- Testing: Product Page Optimisation (native)
Android ASO
- Title: 50 chars (highest weight field)
- Short description: 80 chars (indexed + displayed)
- Long description: 4,000 chars, fully indexed
- No invisible keyword field — all indexing is from visible text
- Algorithm: heavily weights retention, crash rate, web signals
- Updates: hours to approve
- Store Listing Experiments: multi-variant, including description
- Testing: Store Listing Experiments (native)
Iteration speed is the most practically important difference: Google Play approves metadata updates within hours; Apple takes 1–3 days. This means Android iteration cycles are 5–10× faster. We use Android as the keyword testing ground — run a metadata variant, measure ranking impact in 48 hours, apply the winning formula to iOS where you have to commit to a longer cycle. This sequencing alone saves weeks of waiting in a typical keyword optimisation sprint.
On Android, use the full 4,000 characters of the long description. Apps with thin descriptions are consistently outranked by those with comprehensive, naturally written keyword-rich content. Target each primary keyword 3–5 times across the body, in natural sentences — not in a keyword list at the bottom. On iOS, the description plays no role in indexing but is the last piece of copy a user reads before deciding to install — make the first 255 characters (the above-the-fold section) convert, not just inform.
The algorithm weighting difference also matters: Google Play weights behavioural signals more heavily relative to keyword optimisation compared to Apple's algorithm, which places more direct importance on keyword precision in the title, subtitle, and keyword field. In practice, an iOS app can move rankings meaningfully with a metadata rewrite alone; an Android app usually needs both a metadata update and an install-velocity or retention improvement to crack the top 5 for competitive keywords.
How do Custom Product Pages and Store Listing Experiments change the game?
Apple's Custom Product Pages (CPPs) and Google Play's Store Listing Experiments are the most significant structural expansions to ASO in the past three years, because they allow each app to present a different listing to different users — turning a single static listing into a dynamic conversion engine.
Custom Product Pages on iOS allow up to 70 unique product page variants per app (doubled from 35 in early 2026). Each CPP has its own screenshots, preview video, promotional text, and unique URL, and can be independently deep-linked from paid campaigns, emails, QR codes, or ASA keyword groups. A fitness app might maintain a CPP focused on "weight loss" for users coming from an ASA "lose weight" keyword campaign, a separate CPP focused on "marathon training" for users from a running community ad, and a third focused on "mental health" for users from a wellness content campaign — each page presenting the app's most relevant value proposition for that specific search intent.
The conversion lift from well-matched CPPs is substantial. Across our portfolio we consistently see 20–40% higher install rates on CPP-linked paid campaigns versus sending traffic to the default listing. At scale, this is the difference between a profitable UA campaign and one that misses the CPI target by a wide margin.
Google Play's Store Listing Experiments go further than Apple's native testing by permitting full description and short description variants in addition to visual assets. This means Android teams can test keyword-loaded description variants head-to-head against conversion-optimised variants — a capability Apple does not offer natively. The discipline is the same: one variable, 2+ weeks, 1,000+ impressions per variant, 95% confidence before calling a winner.
A quick-commerce app we manage built 12 CPPs across its top-performing keyword clusters and linked each CPP to its corresponding Apple Search Ads keyword group. Within 60 days, blended iOS CPI fell by 31% because the intent-matched landing page improved post-click install rates significantly. The keyword strategy did not change — only the destination page for each intent cluster.
For a full walkthrough of CPP strategy and setup, explore Vmobify's ASO service — we build and manage CPP programmes as part of every iOS engagement.
How do you measure ASO performance and prove its ROI?
ASO performance measurement requires a layered metrics framework — rankings, traffic, conversion, and downstream quality — because a single metric in isolation tells an incomplete story and makes it easy to optimise for the wrong thing. An app can rank for 50 keywords but convert poorly; or it can have excellent conversion but thin keyword coverage. The goal is compounding improvement across all layers simultaneously.
Core metrics to track weekly:
- Keyword rank for your top 20 target terms, using ASO tools (AppTweak, Sensor Tower) for daily tracking. Rank history is more informative than rank snapshot — a keyword moving from position 18 to 11 is more valuable than a keyword sitting at 8 with no movement.
- Organic install volume from App Store Connect or Google Play Console, filtered to "App Store Search" or "Google Play Search" traffic sources. This is the direct commercial output of your ASO work.
- Store conversion rate — impressions to product page views to installs. A rank improvement that does not show up as increased search install volume points to a conversion problem, not a ranking problem.
- Ratings velocity — new ratings per week and average rating trend (trailing 30 days). Any week with a net rating decline is a signal worth investigating.
- Crash rate / ANR rate (Android) — from Play Console's Android Vitals. Any spike above Google's threshold is a ranking risk that must be resolved before continuing optimisation work.
Reporting cadence that works in practice: Weekly spot-checks for ranking movements and traffic anomalies. Monthly reviews covering keyword rank trends, organic install trend MoM, conversion rate by traffic source, competitor rank movements, and rating velocity. Quarterly strategy reviews to refresh the keyword universe, reallocate metadata, and plan the next creative test cycle. Connect ASO data to downstream LTV metrics — organic installs from high-intent keyword searches often retain at 20–40% higher rates than paid installs, which is the most compelling ROI argument for continued ASO investment that we bring to client reviews.
If your blended paid CPI is ₹30 and ASO improvements generate 50,000 additional organic installs per month, that is ₹15,00,000 of acquisition value delivered for the cost of an ongoing optimisation programme. The compounding nature of rankings — unlike paid campaigns which stop when the budget stops — means ASO ROI improves every month the programme runs.
For apps scaling beyond a few thousand daily installs, integrate your ASO data with your MMP (AppsFlyer, Adjust, or Singular) to segment organic installs by keyword category and compare their downstream LTV and retention against each paid channel. This is the analysis that consistently makes the business case for increased ASO investment at leadership level. Ready to build a data-driven ASO programme? Request a free ASO audit from Vmobify — we will audit your keyword coverage, metadata efficiency, visual conversion rate, and competitive positioning, and deliver a prioritised action plan within 5 business days. See what we have delivered in our case studies.
Frequently Asked Questions
How long does ASO take to show measurable ranking improvements?+
Title and subtitle changes typically show ranking impact within 7–14 days. Keyword field and description updates take 2–4 weeks to fully index. Store conversion experiment results require 2–6 weeks for statistical significance depending on traffic volume. Expect a meaningful organic install lift within 60–90 days of a disciplined, end-to-end ASO programme covering metadata, visuals, and ratings simultaneously.
What is the most important ASO factor on iOS in 2026?+
The app title remains the single highest-weight ranking field on iOS. Every keyword placed in the title carries the highest indexing multiplier in the store. After title, the subtitle and the 100-character keyword field are the next most impactful fields. Apple Intelligence semantic matching has added a layer of natural-language relevance scoring, which means well-written, intent-clear copy now outperforms mechanically keyword-stuffed metadata.
What is the difference between ASO and Apple Search Ads?+
ASO and Apple Search Ads (ASA) are complementary, not competing. ASO optimises your organic ranking — free impressions from store search and browse. ASA places paid ads at the top of search results for specific keywords. The feedback loop between the two matters: ASA data reveals which keywords convert best from paid traffic, informing which terms to prioritise in your organic metadata. Apps that treat ASO and ASA as one integrated programme consistently outperform those that run them in isolation.
Should I use all 100 characters in the iOS keyword field?+
Yes — every unused character in the iOS keyword field is a ranking opportunity wasted. Rules for maximum efficiency: never repeat words already in your title or subtitle; no spaces after commas (use every character for keyword content); use singular forms (Apple indexes both singular and plural from one form); include competitor-adjacent terms, alternate spellings, and long-tail variants. A well-structured 100-character keyword field can index your app for 15–25 additional search terms.
How do ratings affect ASO rankings?+
Ratings affect ASO in two ways: direct algorithmic ranking (both stores weight rating average and review volume as a quality signal) and indirect conversion impact (a 4.5★ app converts 30–40% better than a 3.8★ app for the same keyword). According to AppTweak, 90% of featured apps on the App Store have a 4.0+ rating. The right approach is triggering native in-app review prompts at moments of user success, not at first open — and responding to every negative review within 24 hours.
How many Custom Product Pages should an iOS app maintain?+
There is no fixed answer — the right number depends on how many distinct intent clusters your paid campaigns and organic search traffic represent. A starting framework: one CPP per major keyword cluster (typically 3–5 clusters for most apps), one per top-spending paid channel or campaign, and one per major localisation market. Apple now supports up to 70 CPPs per app. More CPPs only help if each one is genuinely intent-matched and has dedicated traffic pointing to it.
What is the most common ASO mistake we see in audits?+
The most frequent issue is title field waste: brand names that occupy 15–20 characters of the 30-character iOS title, leaving room for only one short keyword. The fix is shortening the brand reference in the title (using an abbreviated name or dropping it to the subtitle) to free characters for a higher-priority keyword phrase. The second most common mistake is running parallel A/B tests — testing icon and screenshots at the same time — which makes results uninterpretable and leads to implementing a "winner" that cannot be attributed to either change.
Sources
- Apple Custom Product Pages — Official Apple documentation on CPP structure, limits, and setup.
- Google Play Store Listing Experiments — Official Google guide to Store Listing Experiments and launch best practices.
- Apple Search Ads — Apple-native paid keyword advertising — highest-intent iOS install channel.
- AppsFlyer State of App Marketing — Annual benchmark report with organic install share data and channel benchmarks.
- SplitMetrics ASO research — Independent research on store creative A/B testing and conversion uplift benchmarks.
- AppTweak ASO blog — Keyword volume data, algorithm analysis, and ASO benchmarks used in this guide.
- Sensor Tower blog — App market intelligence and download trend data.
- StoreMaven ASO research — Research on creative conversion hierarchy and visual testing best practices.
About the author
Amol Pomane — Founder, Vmobify
Amol leads Vmobify, a mobile app growth agency that has driven 30M+ downloads and ranked 54K+ keywords across 300+ apps since 2013. He writes about ASO, paid user acquisition, retention, and the operational reality of scaling mobile apps in India and global markets.
Free Growth Audit
See exactly how to scale your app with 13+ years of expertise behind you.
Get My Strategy