ARPU, ARPPU & LTV: 2026 App Benchmarks by Vertical
A reference set of 2026 ARPU, ARPPU and LTV benchmarks by app category — what to expect per user, the roughly 2.7x iOS-versus-Android revenue gap, and why retention is the multiplier that decides lifetime value.

What is the difference between ARPU, ARPPU and LTV?
ARPU is revenue divided by your entire user base; ARPPU is revenue divided only by paying users; and LTV is the total revenue a user generates over their whole relationship with the app — three different denominators that answer three different questions. Confusing them is the most common reporting error we see, and it leads directly to bad pricing and budget decisions.
ARPU (average revenue per user) is the broad health metric. It includes every free user, lapsed trialist and never-paying visitor, so it is always a small number and it directly reflects how well you convert the base, not just how much payers spend. ARPPU (average revenue per paying user) strips out everyone who never paid, so it measures the depth of your monetisation among the people who actually open their wallets. Because a typical subscription app converts only a single-digit percentage of its base, ARPPU sits well above ARPU — the Adapty glossary on ARPPU frames the relationship as ARPPU running roughly 10-20x ARPU, governed by your paid-conversion rate.
LTV (lifetime value) is the forward-looking one. Where ARPU and ARPPU are usually measured over a fixed window — per month, or at a cohort age like Day 30 or Day 60 — LTV projects the full revenue a user contributes across their lifetime, which is why it is the number that should sit opposite your acquisition cost. The cleanest way to think about it: LTV is ARPPU stretched across how long a payer stays, multiplied by how many of your users pay. Retention and conversion are baked in.
A worked example makes the relationship concrete. Suppose an app has 100,000 monthly users, 4,000 of whom pay, and total monthly revenue of ₹8,00,000. ARPU is ₹8 (revenue ÷ all 100,000 users); ARPPU is ₹200 (revenue ÷ the 4,000 payers) — a 25x gap that reflects a 4% paid-conversion rate. Push conversion to 6% and ARPU rises even if ARPPU does not move at all, because more of the same base is now paying. That single illustration explains why two apps can report identical ARPPU yet wildly different ARPU, and why you can never read one number safely without the other.
Across our 300+ apps managed since 2013, the teams that monetise well are the ones that keep these three numbers on the same dashboard and never use them interchangeably. ARPU tells you whether the funnel is converting, ARPPU tells you whether your packaging extracts fair value from payers, and LTV tells you how much you can afford to spend to acquire the next user. The rest of this guide gives you 2026 benchmarks for each, by vertical and by platform, so you can place your own numbers in context.
What ARPU should your app expect by category in 2026?
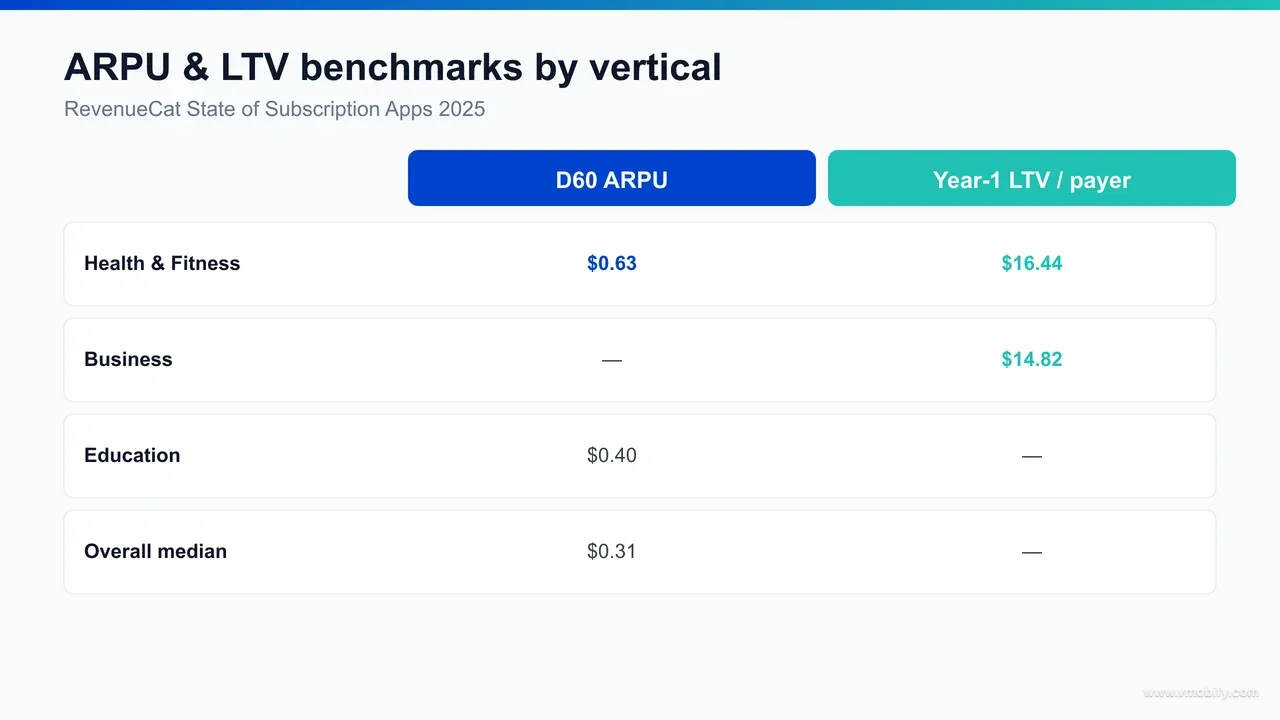
There is no single "good" ARPU — it is set by your vertical. In the RevenueCat State of Subscription Apps 2025 report, Day-60 ARPU ran $0.63 for Health & Fitness and $0.40 for Education against an overall median of $0.31. Benchmark yourself against your category, not the global average, or you will misread a perfectly healthy app as a failing one.
Those figures measure revenue per installed user at Day 60 of the cohort's life — a standardised window that lets you compare apps of different ages fairly. Read them as a hierarchy, not absolutes:
- Health & Fitness — $0.63 D60 ARPU: the strongest performer. High personal motivation, visible outcomes, and a habit loop that justifies recurring payment put this category at roughly double the overall median.
- Education — $0.40 D60 ARPU: above median, driven by clear utility and outcome-linked spend (exam prep, language fluency, skills) that users treat as an investment rather than entertainment.
- Overall median — $0.31 D60 ARPU: the midpoint across categories. If your app sits here with no strong differentiator, you are normal; if you sit here in a high-ARPU vertical, you have headroom.
The practical use of these numbers is diagnostic. If your Health & Fitness app is monetising at $0.30 per user while the category benchmark is $0.63, the gap is not bad luck — it is a conversion, packaging or retention problem you can name and fix. If you are an education app already clearing $0.40, your lever is no longer "monetise harder" but "acquire more of the right users efficiently." We build that comparison into every analytics and measurement engagement, because a benchmark you can act on is worth far more than a number in isolation.
One caveat worth stating plainly: ARPU is a base-wide average, so it moves when your mix of free and paying users moves, not only when payers spend more. A campaign that floods the funnel with low-intent installs will depress ARPU even if your payers are spending exactly as before. Always read ARPU alongside paid conversion before you conclude monetisation is the problem.
How big is the iOS-versus-Android revenue gap?
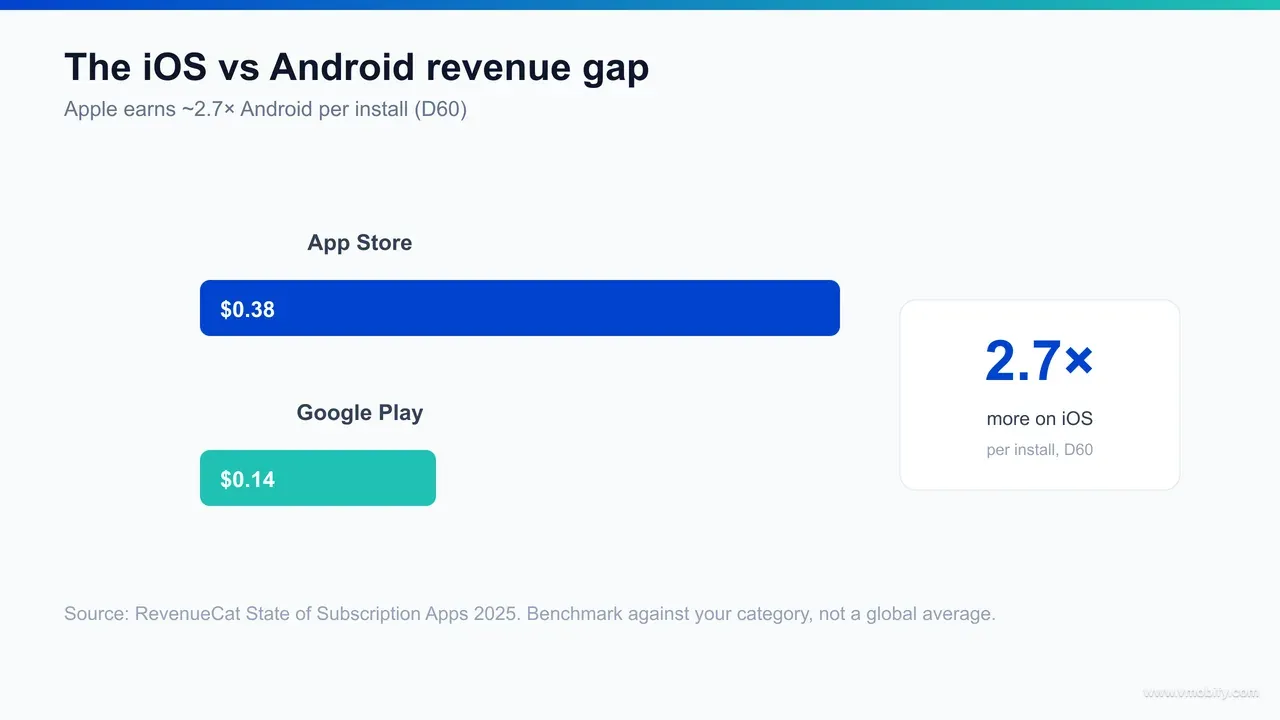
iOS earns roughly 2.7x more per user than Android: RevenueCat's 2025 data put Day-60 revenue at $0.38 on iOS versus $0.14 on Android. That gap is large enough that platform mix is a monetisation decision, and it is especially consequential for an India-focused app where the install base is overwhelmingly Android.
The drivers behind the gap are structural, not cosmetic. iOS users skew toward higher-income, higher-spend demographics; Apple's payment friction is lower because billing details are already on file; and historically App Store users have shown a greater willingness to pay for digital subscriptions. Android's reach is far wider — particularly across India and other price-sensitive markets — but its per-user revenue is thinner. The platforms also handle billing and price points differently, each with its own tax treatment and currency rounding, so a price that converts on one will not automatically translate to the other. Neither platform is "better"; they monetise differently, and your strategy has to account for that rather than fight it.
For an India-first product this creates a specific tension we navigate constantly. The volume is on Android, where card penetration is low and price sensitivity is high, so the iOS playbook of premium recurring pricing simply does not transfer. The answer is rarely to chase iOS-style ARPU on Android; it is to monetise each platform on its own terms — leaning on lower price points, locally relevant payment rails, and hybrid models on Android while capturing higher willingness-to-pay on iOS. Our work on app price localisation with purchasing-power parity goes deep on why a flat global price leaves money on the table in exactly these markets.
In our portfolio, the apps that misread this gap are usually the ones that set a single global price anchored to iOS economics and then wonder why Android conversion collapses. The fix is to treat the $0.38-versus-$0.14 reality as a planning input: model LTV and acquisition budgets per platform, expect lower Android ARPU by design, and make it up on volume and retention rather than price. A blended company-wide ARPU that hides a 2.7x platform split is a number that will mislead every downstream decision.
What is a typical lifetime value per subscriber by category?
Year-one lifetime value per payer reached $16.44 in Health & Fitness and $14.82 in Business in the RevenueCat State of Subscription Apps 2025 report — the verticals where high intent and clear, repeatable utility justify sustained recurring spend. These are first-year LTV figures per paying user, so they sit far above ARPU because they isolate the people who actually pay and follow them across renewals.
The pattern mirrors the ARPU hierarchy, and that is not a coincidence: the categories that earn the most per user up front are usually the ones that retain payers long enough to compound it. Health & Fitness tops both tables because a fitness or wellness subscription is tied to a personal goal users return to; Business apps earn because the spend is often expensed, outcome-linked, and rarely cancelled while the workflow is in use. Education sits close behind for the same reason it leads on ARPU — outcome-driven spend that users treat as an investment.
- Health & Fitness — $16.44 year-one LTV per payer: the benchmark to beat. Habit-forming usage plus high personal motivation produces both strong conversion and durable retention.
- Business — $14.82 year-one LTV per payer: close behind, powered by utility-led, often-expensed spend that resists churn while the tool stays embedded in a workflow.
The reason LTV matters more than any single-window metric is that it is the number you set your acquisition budget against. If your year-one LTV per payer is $16 and only a fraction of installs convert, your blended cost-to-acquire-a-payer ceiling is a hard constraint that ARPU alone will not reveal. This is precisely the calculation our LTV-to-CAC calculator walks through, and it is why we treat LTV as the anchor metric for any paid-acquisition plan rather than an afterthought reported at quarter-end.
Two cautions on using these figures. First, they are first-year LTV — a user who renews into year two and beyond is worth materially more, so these are floors for a retentive app, not ceilings. Second, they are per payer; to translate them into a base-wide planning number you multiply by your paid-conversion rate, which is exactly the bridge back to ARPU.
How much does retention multiply lifetime value?
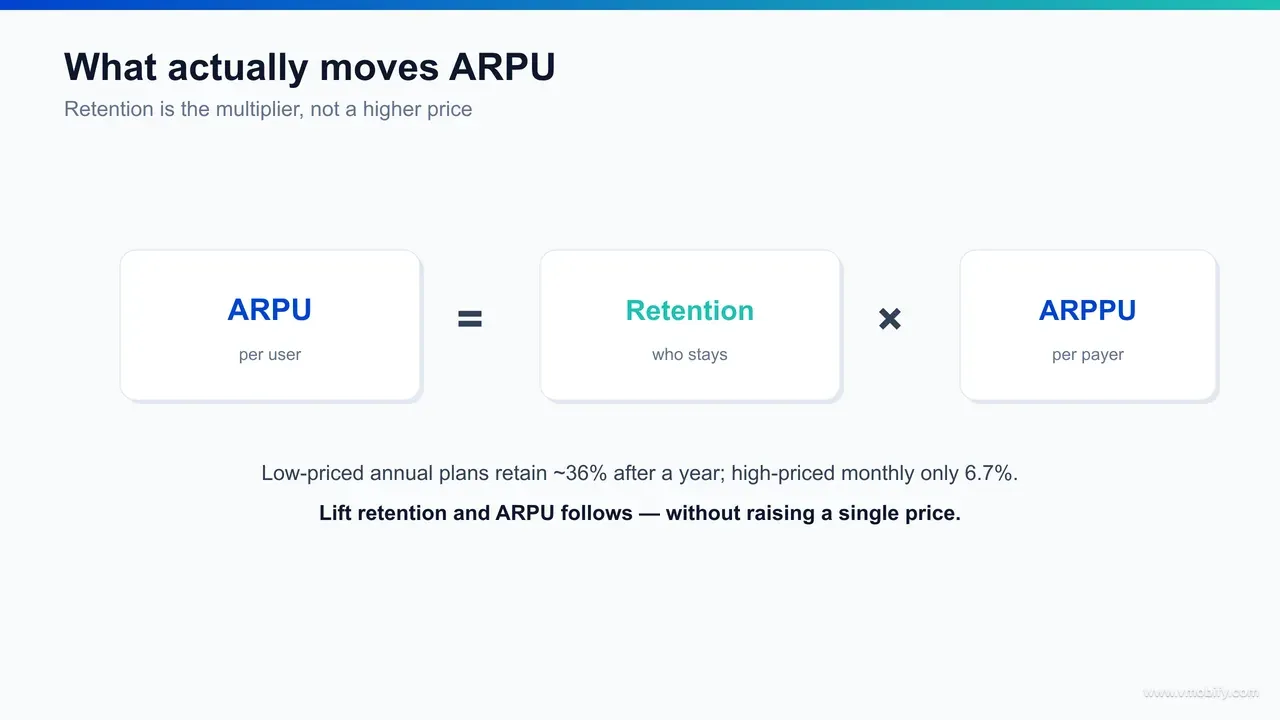
Retention is the single biggest multiplier on lifetime value — far larger than price. In the RevenueCat State of Subscription Apps 2025 data, low-priced annual plans retained roughly 36% of subscribers after one year, while high-priced monthly plans retained just 6.7% — a more-than-5x difference in how much lifetime value the same revenue base produces. You cannot out-price weak retention, and you can rescue mediocre pricing with strong retention.
The mechanism is simple arithmetic but easy to forget. LTV is, in essence, ARPPU multiplied by how long a payer stays. Doubling how long the average subscriber retains does roughly the same thing to LTV as doubling what they pay each month — except retention compounds and is usually cheaper to improve than a price increase, which risks suppressing conversion at the top of the funnel. That is why the "ARPU = retention × ARPPU" framing is the most useful mental model on this entire page: it tells you that the highest-return lever is usually the one in the middle, not the price tag.
Concretely, a 36%-versus-6.7% one-year retention gap means one cohort is still generating revenue from more than a third of its payers a year later, while the other has lost over 93% of them. Even if the high-retention cohort pays less per cycle, it can easily out-earn the high-price, high-churn cohort over any horizon longer than a few months. This is the trap behind chasing headline price: a higher sticker that churns fast produces less lifetime value than a modest price that sticks.
In our portfolio we have watched this play out repeatedly — the apps that obsess over the first renewal and the early-lifecycle habit loop end up with LTV that compounds, while the ones that optimise only the purchase moment plateau. If you want the tactical retention playbook that feeds this multiplier, our guide to app subscription monetisation strategy covers the onboarding, trial design and win-back mechanics that move one-year retention from single digits toward that 36% benchmark.
Why do annual plans beat monthly plans on retained value?
Annual plans beat monthly plans on retained value because they convert the churn decision from a monthly question into a yearly one — and the data is stark: low-priced annual plans retained around 36% of subscribers after a year versus 6.7% for high-priced monthly plans. Every billing cycle is a fresh opportunity to cancel, so the fewer cycles a year contains, the more of your base survives it.
A monthly subscriber faces twelve cancel-or-continue moments in a year; an annual subscriber faces one. That structural difference matters more than the discount you offer to nudge users onto the annual tier. It is also why the highest-retaining configuration in the data pairs a lower price with an annual term — the affordable annual commitment maximises both initial conversion and the proportion that survives to renewal.
The strategic implication is to make annual the recommended default for the users who are good candidates for it, while being honest about who those are:
- Lead with annual for high-intent users: users who have already shown engagement — completed onboarding, hit an activation milestone — are the ones for whom an annual commitment lifts LTV rather than scaring off the purchase.
- Keep monthly as the on-ramp: for lower-commitment or price-sensitive users, monthly reduces purchase friction; the goal is to migrate the engaged ones to annual at the right moment, not to remove monthly entirely.
- Mind the India dimension: on Android-heavy, price-sensitive bases, a steep annual price up front can suppress conversion outright — pair an affordable annual tier with a payment rail users trust to capture the retention benefit without the conversion penalty.
The bottom line is that plan term is a retention lever disguised as a pricing choice. Moving the right cohort from monthly to a sensibly priced annual plan is one of the few changes that can lift both conversion and one-year retention at once — and therefore LTV — without you raising prices at all.
How do you lift ARPU without hurting retention?
You lift ARPU by working its components — retention, paid conversion and ARPPU — rather than simply raising prices, because a price increase that suppresses conversion or accelerates churn can lower the base-wide average it was meant to raise. ARPU is an outcome, not a dial; you move it by moving the inputs.
- Improve retention first: because LTV is roughly ARPPU multiplied by tenure, lengthening how long payers stay is usually the highest-return work — and it lifts ARPU mechanically as retained payers keep contributing revenue to the base.
- Convert more of the base: ARPU is dragged down by every non-paying user, so improving paid conversion through better onboarding, trial design and paywall placement raises ARPU even with prices unchanged. Small conversion gains move the base-wide average more than most price changes.
- Deepen ARPPU thoughtfully: nudge engaged users toward annual plans, add a higher tier with genuine added value, and localise pricing to each market's purchasing power so you capture more where willingness-to-pay is higher without pricing out price-sensitive markets.
- Add a complementary ad tier: a hybrid model — subscriptions plus ads on the free tier — can lift blended ARPU by monetising users who will never subscribe, and done well it need not hurt retention. RevenueCat's own analysis of ad monetisation in subscription apps covers where this complements rather than cannibalises subscription revenue.
There is also a measurement discipline underneath all of this. Always segment ARPU by platform and market before you act on it — a blended figure that hides the 2.7x iOS-versus-Android gap, or that averages a high-ARPU geography with a low-ARPU one, will point you at the wrong lever. The right unit of analysis is a cohort on one platform in one market, tracked across its lifetime; that is where ARPU, ARPPU and LTV finally line up and tell a consistent story.
If you want these benchmarks turned into an actual monetisation plan — category-correct targets, a retention-led LTV model, and a per-platform pricing strategy for an India-heavy base — that is the core of what our app monetisation work delivers. You can see how it plays out across our case studies, or talk to our team about pressure-testing your own ARPU and LTV against the 2026 benchmarks above.
Frequently Asked Questions
What is a good ARPU for a mobile app in 2026?+
It depends on your category. RevenueCat's 2025 data put Day-60 ARPU at $0.63 for Health & Fitness and $0.40 for Education against a $0.31 overall median, so benchmark against your vertical rather than a single global figure.
What is the difference between ARPU and ARPPU?+
ARPU divides revenue across your entire user base, including free users; ARPPU divides revenue only among paying users. Because most apps convert a small minority, ARPPU typically runs roughly 10-20x higher than ARPU.
Which app category has the highest ARPU?+
Health & Fitness led the 2025 benchmarks with $0.63 Day-60 ARPU, roughly double the overall median, driven by high personal motivation and habit-forming usage that justifies recurring payment.
How much more do iOS apps earn than Android?+
About 2.7x more per user. RevenueCat's 2025 data put Day-60 revenue at $0.38 on iOS versus $0.14 on Android, driven by demographics, lower payment friction and higher willingness to pay.
What is a typical lifetime value per subscriber?+
Year-one LTV per payer reached $16.44 in Health & Fitness and $14.82 in Business in 2025. These are first-year figures per paying user, so a user who renews into later years is worth considerably more.
Do annual plans retain better than monthly plans?+
Yes, by a wide margin. Low-priced annual plans retained around 36% of subscribers after one year versus just 6.7% for high-priced monthly plans, because an annual term replaces twelve cancel decisions with one.
What does Vmobify do to lift ARPU and LTV?+
We set category-correct ARPU and LTV targets, build retention-led lifetime-value models, and design per-platform, market-localised pricing — particularly for India-heavy Android bases. See our app monetisation service at /services/monetization.
Sources
- RevenueCat — State of Subscription Apps 2025 — D60 ARPU by category, iOS vs Android revenue, year-one LTV per payer, and annual-vs-monthly retention
- Adapty — ARPPU glossary — Definition of ARPPU and its roughly 10-20x relationship to ARPU via paid conversion
- RevenueCat — Ad monetisation in subscription apps — Hybrid subscription-plus-ads model for lifting blended ARPU
- Apple — App Store Connect — Where iOS pricing, price points and per-storefront billing are configured
- Google Play — Console pricing and currency conversion — How Android prices are set, converted and taxed per market
- AppsFlyer — App Marketing Performance Index — Benchmark methodology context for per-user revenue and acquisition cost by category
- data.ai — State of Mobile insights — Cross-market context on mobile spend and category monetisation trends
About the author
Amol Pomane — Founder, Vmobify
Amol leads Vmobify, a mobile app growth agency that has driven 30M+ downloads and ranked 54K+ keywords across 300+ apps since 2013. He writes about ASO, paid user acquisition, retention, and the operational reality of scaling mobile apps in India and global markets.
Free Growth Audit
See exactly how to scale your app with 13+ years of expertise behind you.
Get My Strategy

