Paywall Optimisation: The 6 Decisions That Drive Conversion
Most paywall redesigns move nothing because they change the skin, not the structure. Here are the six decisions — placement, trial model, hard versus soft, and the tests worth running — that actually shift subscription conversion, with 2026 benchmarks from more than 16,000 apps.

Why do most paywall redesigns fail to move conversion?
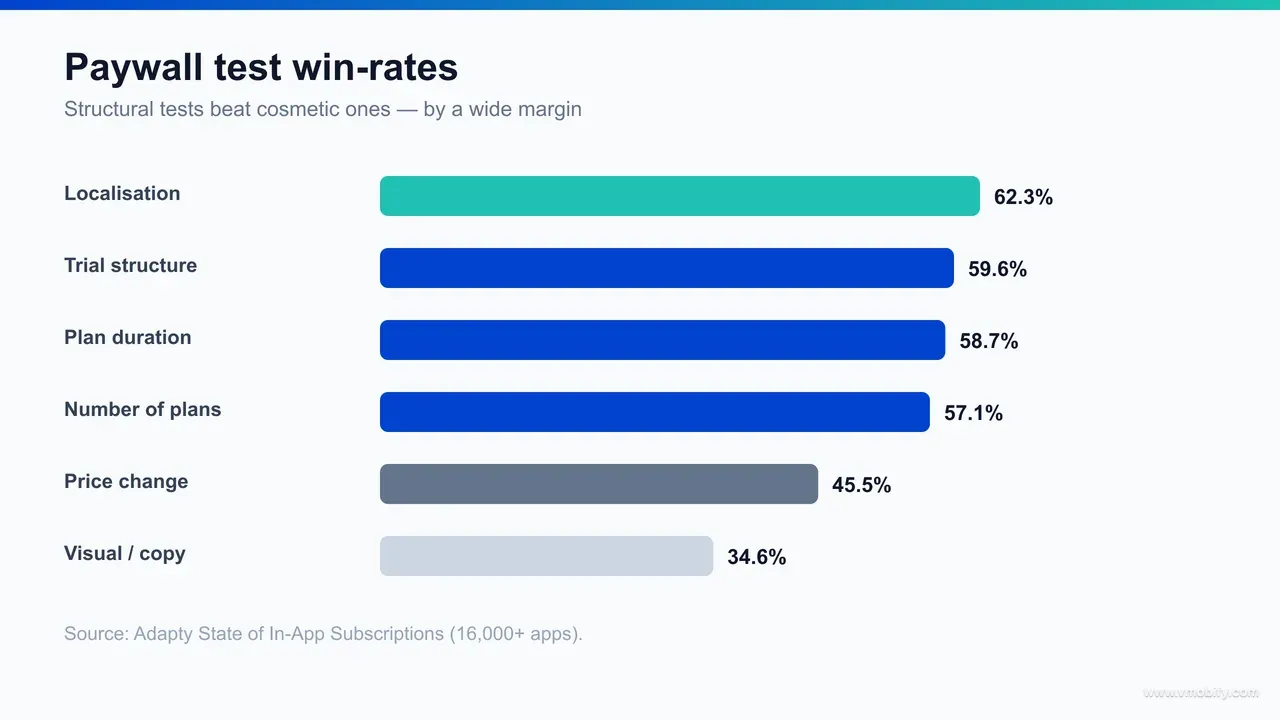
Most paywall redesigns fail because they change the skin — colours, copy, illustrations — rather than the structure, and the data is blunt about how little cosmetics move: visual and copy tests win only about 34.6% of the time, against 59.6% for trial-structure tests and 62.3% for localisation. A redesign feels like progress because something visibly changed, but a coin-flip win rate is not a strategy.
The mistake is understandable. The paywall is the most-screenshotted surface in a subscription app, so it attracts opinions — the founder wants a cleaner hero, the designer wants a new layout, marketing wants punchier headlines. All of that is a debate about presentation. Conversion, though, is mostly decided by structure: where the paywall appears in the journey, whether it offers a trial, whether it blocks the app or merely interrupts it, and what the price says about the market it is shown in. Those are the levers Adapty's analysis of high-performing paywalls finds actually move the number, as set out in its 2026 high-performing paywall report.
There is a second, quieter reason redesigns disappoint: teams judge them on the wrong metric and the wrong timescale. A new paywall might lift trial starts on Day 1 and then quietly suppress paid conversion or renewal a month later, and nobody connects the two because the test was already declared a winner. Optimising the visible top of the funnel while ignoring the retained-revenue bottom is how an app "improves" its paywall into a lower lifetime value.
Across our 300+ apps managed since 2013, the pattern is consistent: the teams that win on monetisation are the ones who stop treating the paywall as a canvas and start treating it as a system of structural decisions. This guide walks the six decisions — placement, trial model, hard versus soft, localisation, the highest-win-rate tests, and how to run them — that move conversion, with the 2026 benchmarks to calibrate against.
What paywall conversion rates are realistic in 2026?
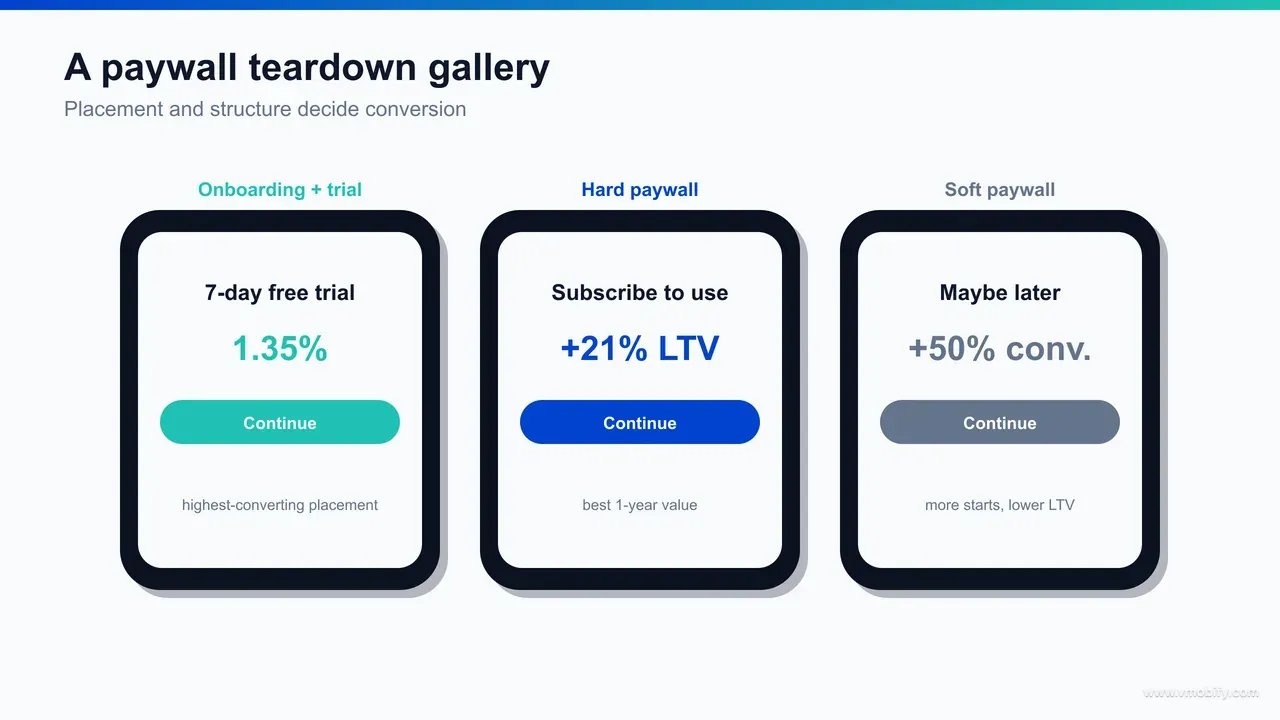
Realistic paywall conversion depends almost entirely on placement and type, but as a calibration point, the onboarding paywall shown with a free trial converts at about 1.35% — the highest of any placement — while soft paywalls across the dataset convert at roughly 4.85% and hard paywalls at 3.34%. The wide spread is the point: there is no single "good" number, only a number relative to where and how the paywall is shown.
The reason the figures look so different is that they measure different denominators. A placement-level rate like the 1.35% onboarding figure is measured across everyone who reaches that step early in the funnel, including users who have barely tried the product. A hard-versus-soft rate is measured among users who actually encounter that paywall pattern. Comparing them directly is apples to oranges — which is exactly why "what is a good paywall conversion rate?" is the wrong question, and "what is a good rate for my placement and type?" is the right one.
Timing explains a lot of the variance. According to Adapty, roughly 90% of trial starts happen on Day 0, and about 44.5% of purchases happen on Day 0 too. (RevenueCat's 2025 dataset reports a different but directionally similar figure — around 82% of trials starting the same day — measured on its own population; the two are not interchangeable, so treat each number with its source.) Whichever dataset you read, the implication is the same: the decision to subscribe is made early, near the moment of first intent, which is why placement matters more than almost anything else on the paywall.
The other thing the benchmarks make clear is that conversion alone is a trap. A higher conversion rate on a cheaper plan or a softer offer can still earn less per user, which is why every figure here has to be read alongside lifetime value — the subject of the hard-versus-soft section below. Use these numbers to calibrate expectations, not to set a target your structure cannot support.
Where should the paywall go — onboarding or in-app?
For most subscription apps the highest-converting placement is an onboarding paywall shown with a free trial, at about 1.35%, because roughly 90% of trial starts happen on Day 0 — when intent is highest and the user has just self-selected by installing. A paywall buried three screens deep behind a feature gate misses that window entirely.
The logic follows directly from the Day-0 data. If almost all trial starts and a large share of purchases happen on the first day, then the paywall's job is to be present, clear and compelling during the first session. Push it too late — wait until the user "experiences value" across several days — and you are betting on a return visit that the retention curves say most users never make. The onboarding paywall meets intent where it actually lives.
That said, placement is not a single binary. The strongest setups usually combine a well-built onboarding paywall with a few well-chosen in-app triggers:
- Onboarding paywall (primary): shown after a short, benefit-led onboarding that earns the ask. This is where the 1.35% headline comes from and where most of your revenue decision is made.
- Contextual in-app paywalls (secondary): triggered at the moment a user hits a premium feature — export, an advanced filter, the next level. These convert a smaller volume but at high intent, because the user is reaching for the exact thing they would pay for.
- Win-back and reminder surfaces (tertiary): for users who dismissed the first ask, a later nudge tied to a usage milestone recovers a slice of demand without nagging.
The common mistake is treating placement as either/or. In our portfolio, the apps that monetise best run an onboarding paywall as the anchor and layer contextual paywalls on top, rather than choosing one and leaving the other on the table. If you are also fighting for store-level conversion before the user ever opens the app, our guide to app store conversion-rate optimisation covers the upstream half of the funnel that feeds these paywalls.
Hard paywall vs soft paywall — which makes more money?
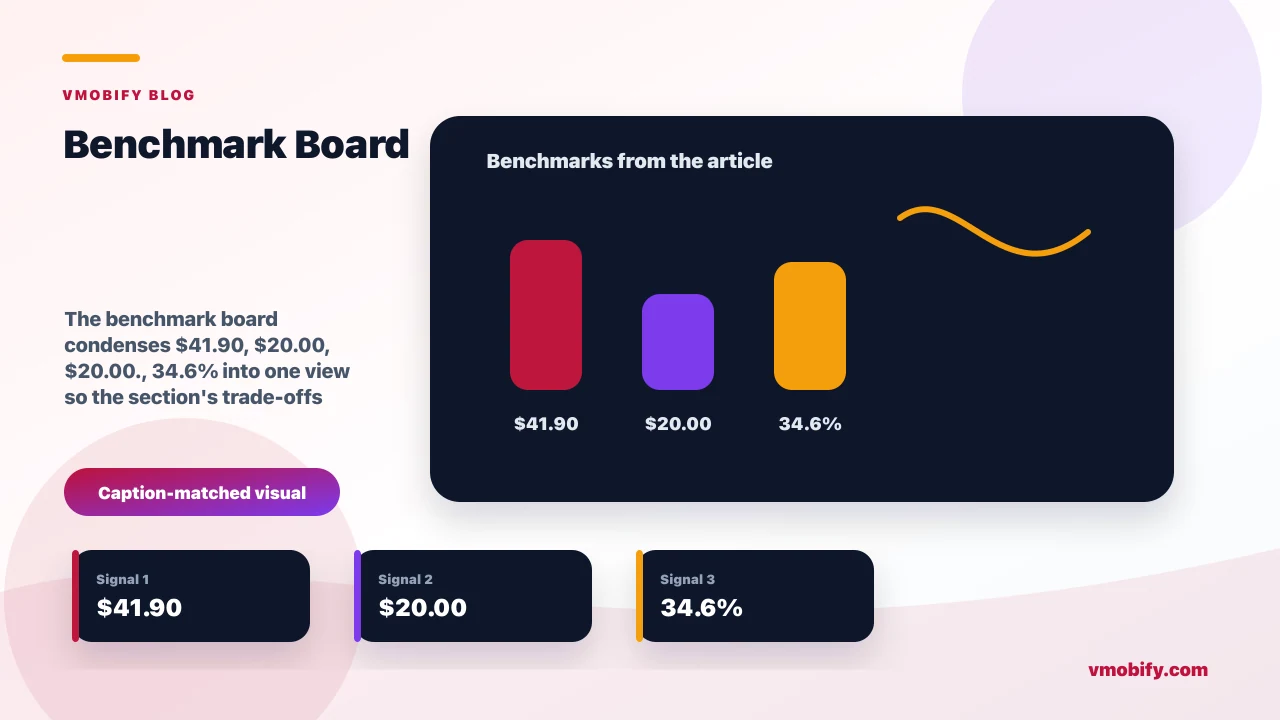
Soft paywalls convert roughly 50% better than hard ones (about 4.85% versus 3.34%), but hard paywalls produce around 21% higher one-year lifetime value — a median $41.90 against $20.00 — so the right answer depends on whether you are optimising for reach or for revenue per subscriber. Neither is universally "better"; they optimise different goals.
A hard paywall blocks access until the user subscribes (or at least starts a trial). It converts a smaller share of users, but the users it does convert are higher-intent and tend to stick — which is why its lifetime value runs higher in Adapty's 2026 dataset. A soft paywall lets users into the product and presents the upgrade as an option they can defer or dismiss. It converts more people overall because it removes the up-front wall, but a meaningful share of those conversions are softer, more price-sensitive, and churn sooner.
The numbers reframe the decision cleanly:
- Choose a hard paywall when your value is obvious from the store listing and onboarding, your category has high willing-to-pay intent, and your goal is revenue per subscriber and durable LTV. You trade some top-of-funnel volume for a denser, longer-retained paying base.
- Choose a soft paywall when the product needs to be experienced before users will pay, when you are building a large free base for ads or virality, or when you are early and need engaged users more than you need immediate revenue.
- Consider a hybrid — a soft paywall that hardens behind specific premium features — when you want the reach of soft entry with the intent of a gate at the moment of value.
This is also where conversion-only thinking does the most damage. A team that A/B tests hard against soft and crowns the soft variant on Day 1 conversion will systematically pick the lower-LTV option, because the LTV gap only shows up over the following year. Judge this test on retained revenue, not the first screen. For the deeper mechanics of structuring trials, prices and plans around these choices, our app subscription monetisation strategy goes a level below the paywall itself.
Which paywall tests actually have the highest win rates?
The paywall experiments with the highest win rates are structural, not cosmetic: localisation wins about 62.3% of the time, trial-structure tests 59.6%, and plan-duration tests 58.7% — while visual and copy tests win only around 34.6%, per Adapty's paywall benchmarks. Run the high-win-rate tests first; treat the cosmetic ones as polish once the structure is right.
Read carefully, this is a prioritisation map. If a localisation test wins almost two times in three and a colour test barely better than a coin flip, then a team with limited experiment budget should spend it on language, price and plan structure before it touches the hero image. The hierarchy that emerges:
- Localisation (62.3% win rate): pricing and language adapted to each market. This is the single highest-win-rate lever, which is why for a global or India-facing app it is usually the cheapest reliable lift available — often more about correct local pricing than a redesign.
- Trial structure (59.6%): whether to offer a trial, how long, opt-in versus opt-out, and how the trial is framed against the paid plan. This reliably moves the number because it changes the user's perceived risk, not just the look.
- Plan duration (58.7%): which plans you show, in what order, and which is the default — for example anchoring on an annual plan versus leading with monthly. Small ordering changes here shift the revenue mix materially.
- Visual and copy (34.6%): colours, illustrations, headline wording, button labels. Worth doing once the structure is settled, but a poor place to start.
A specific caution worth stating plainly: it is tempting to claim a precise lift from a copy change like swapping a "Subscribe" button for "Start your 7-day free trial". There is no published exact figure for that specific swap, and you should be wary of any source that quotes one. What the data does support is the structural conclusion — that the underlying decision (offering a trial at all, and how it is structured) sits in the 59.6%-win-rate band, while the wording on the button is a 34.6% cosmetic test. The win is in the structure; the wording is the rounding. Localisation in particular is where pricing and paywall design meet, which is why we treat it as a pricing exercise — see our work on in-app purchase pricing experiments for how to test it without wrecking LTV.
What does a high-converting paywall look like?
A high-converting paywall is fast to parse, makes one offer the obvious default, states the price and trial terms honestly, and earns the ask through a short value-led onboarding before it appears — the structural decisions show up in the layout, not in the decoration. Tearing down strong paywalls, the same patterns recur across categories.
Across the paywalls that perform in our portfolio and in the public benchmark data, four traits show up again and again:
- One clear default, not a menu: the strongest paywalls pre-select one plan — usually annual — and make it visually dominant, so the user is choosing whether to proceed rather than solving a pricing puzzle. Plan-duration ordering is a 58.7%-win-rate lever precisely because the default does so much work.
- The trial framed as the action: when a trial is offered, the primary button describes the trial, the renewal price and date are stated nearby, and the structure — not the colour — carries the conversion. Honesty here protects renewal and reduces the refunds and chargebacks that quietly erode LTV.
- Benefit-led, scannable value: three to five concrete benefits a user can read in seconds, tied to what they just experienced in onboarding, rather than a feature wall. The paywall converts the intent onboarding created; it does not try to create intent from scratch.
- Locally correct pricing: the price shown matches what the market will pay — the localisation lever again, surfaced visually. A paywall that shows a US-converted price to an India user is structurally wrong before a single pixel is debated.
The teardown lesson is that "high-converting" is rarely a look you can copy. The visible design is downstream of decisions about placement, default plan, trial structure and local price. Copy a strong paywall's gradient and you copy the 34.6% part; copy its structure and you copy the part that actually converts.
How do you run a paywall A/B test that produces a decision?
A paywall A/B test produces a decision when you change one structural variable at a time, choose a primary metric before you start, size the test for enough conversions to be readable, and evaluate it over a window long enough to capture renewal — not just Day 1 conversion. Most paywall tests fail to settle anything because one of those four is skipped.
The repeatable sequence:
- Pick one structural variable. Test placement, trial structure, plan duration, hard-versus-soft, or local price — one of these, not a full redesign. A redesign that changes five things at once tells you the bundle won or lost, never why.
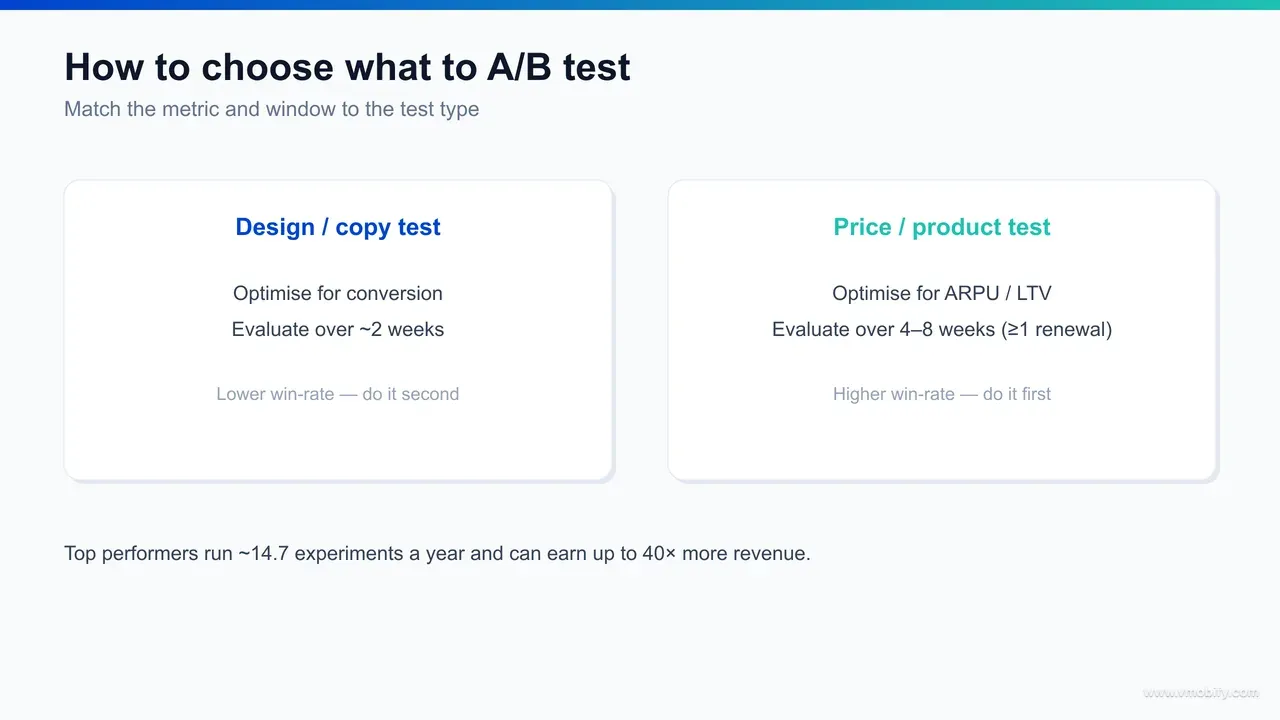
- Choose the primary metric up front. For a placement or trial test, conversion to paid is reasonable. For a hard-versus-soft or pricing test, the primary metric should be revenue per user or LTV, because conversion alone will mislead you. Decide before you look at data, so you cannot rationalise the result you wanted.
- Match the evaluation window to the test type. A trial-start or placement change can be read in days. A hard-versus-soft or pricing change must run at least one full renewal cycle — typically a month for monthly plans, longer for annual — because the LTV difference only appears after the first renewal. Killing an LTV test on Day 1 data is the classic error.
- Size it so the result is readable. Low-traffic apps need to be honest that a small test will not reach significance quickly; pick the highest-win-rate variable (localisation, trial structure) to maximise the odds the effect is large enough to see, and let it run rather than peeking and stopping early.
The discipline that separates a decisive test from a debate is committing to the metric and the window before launch. In our portfolio, the most expensive mistakes are not lost tests — they are "won" tests on Day 1 conversion that shipped a lower-LTV paywall, because nobody agreed up front to judge on retained revenue. Tooling from the major subscription platforms reports the same hierarchy of what matters; RevenueCat's 2025 State of Subscription Apps is a useful cross-check on conversion and trial benchmarks alongside Adapty's paywall data.
How many paywall experiments should you run a year?
The apps that monetise best treat experimentation as a habit: top performers run about 14.7 experiments a year, and apps that run experiments at all can earn up to 40 times more revenue than those that do not, per Adapty. The takeaway is not the exact count — it is that paywall optimisation is continuous, not a one-time redesign.
Roughly fifteen experiments a year is about one structural test a month with a little room for follow-ups. That cadence is achievable for most subscription teams because the highest-win-rate tests — localisation, trial structure, plan duration — are configuration changes, not engineering projects. You do not need to rebuild the paywall to test which plan is the default or whether a market gets a localised price.
The 40x figure deserves a careful reading. It is a comparison between apps that experiment and apps that do not, across a large dataset — so it reflects the compounding of a testing culture and everything that correlates with it, not a guaranteed return from any single test. Read it directionally: the gap between teams that systematically test their monetisation and teams that ship a paywall and forget it is enormous, and it widens over time as the testers stack small structural wins.
If you want a starting cadence, run localisation and trial-structure tests first (the 62.3% and 59.6% win rates make them the highest-expected-value use of a slot), then plan duration, then hard-versus-soft once you have an LTV read, and only then cosmetics. That sequence puts your highest-win-rate, highest-impact tests at the front of the queue.
Standing this up — instrumenting the paywall, sequencing the tests, and judging them on LTV rather than Day 1 conversion — is exactly the monetisation work we run for India-focused subscription apps. If you want it built and measured properly rather than launched and forgotten, our app monetisation team can help, and you can talk to us directly about your paywall.
Frequently Asked Questions
What is a good paywall conversion rate?+
It depends entirely on placement and type. As a calibration point, an onboarding paywall shown with a free trial converts at about 1.35% — the highest placement — while soft paywalls convert at roughly 4.85% and hard paywalls at 3.34% in Adapty’s 2026 data. Compare against your own placement and type, not a single global number.
Hard vs soft paywall — which earns more?+
Soft paywalls convert about 50% better (4.85% versus 3.34%), but hard paywalls produce around 21% higher one-year lifetime value — a median $41.90 against $20.00. Pick by goal: soft for reach and a large free base, hard for revenue per subscriber and durable LTV.
What percentage of trials start on day one?+
Adapty reports that roughly 90% of trial starts happen on Day 0. RevenueCat’s 2025 dataset reports a directionally similar figure of around 82% same-day on its own population — the two are measured differently, so cite whichever source you are using rather than blending them.
Where should the paywall go — onboarding or in-app?+
The highest-converting anchor is an onboarding paywall shown with a free trial, because almost all trial starts happen on Day 0. The strongest setups pair that with contextual in-app paywalls triggered when users hit premium features, rather than choosing one and leaving the other unused.
Should you test paywall copy or structure first?+
Structure first. Localisation, trial-structure and plan-duration tests win roughly 58–62% of the time, while visual and copy tests win only about 34.6%. Settle the structural decisions, then treat colours and wording as polish.
Which paywall test has the highest win rate?+
Localisation — pricing and language adapted by market — wins about 62.3% of the time, the highest of any paywall test, followed by trial structure at 59.6% and plan duration at 58.7%. For a global or India-facing app, correct local pricing is often the cheapest reliable lift.
How many paywall experiments should you run per year?+
Top performers run about 14.7 experiments a year — roughly one structural test a month. Apps that experiment can earn up to 40 times more revenue than those that do not, so treat paywall optimisation as a continuous habit rather than a one-off redesign.
Sources
- Adapty — High-Performing Paywall Report 2026 — Placement conversion (onboarding-with-trial 1.35%), hard vs soft (3.34% vs 4.85%; LTV $20.00 vs $41.90), test win rates and 90% Day-0 trial starts
- RevenueCat — State of Subscription Apps 2025 — Cross-check on conversion and trial benchmarks; ~82% same-day trial starts on its own dataset
- Adapty — Trial conversion rates for in-app subscriptions — Trial-to-paid conversion by model, supporting the trial-structure lever
- Adapty — ARPPU glossary — Revenue-per-user framing for judging tests on LTV rather than conversion alone
- RevenueCat — Ad monetisation for subscription apps — Context on soft paywalls and free-base monetisation choices
- Apple — Implementing a paywall in your app — Official guidance on subscription offers and free trials that paywalls present
About the author
Amol Pomane — Founder, Vmobify
Amol leads Vmobify, a mobile app growth agency that has driven 30M+ downloads and ranked 54K+ keywords across 300+ apps since 2013. He writes about ASO, paid user acquisition, retention, and the operational reality of scaling mobile apps in India and global markets.
Free Growth Audit
See exactly how to scale your app with 13+ years of expertise behind you.
Get My Strategy

