Dating App Marketing: Scaling a Dating App to 500K Users in India
Dating apps live or die on gender balance and geographic density. Here is how we helped a regional app reach 500K users with a 60/40 ratio, 42% D7 retention, and stronger city density in 12 months.
On this page
- What does the India dating app market actually look like?
- What was the challenge when we picked up this app?
- What strategy fixes a broken gender ratio?
- How did we execute female-first acquisition and vernacular ASO?
- What results did the app deliver in 12 months?
- What are the key learnings for any dating app in India?
- How do you run this playbook step by step?
- What goes wrong in dating app growth, and how do you spot it early?
- What does dating app growth actually cost in India?
- Is a female-first budget split worth the slower install growth?
- How does Vmobify run dating app growth?
- Frequently Asked Questions
What does the India dating app market actually look like?
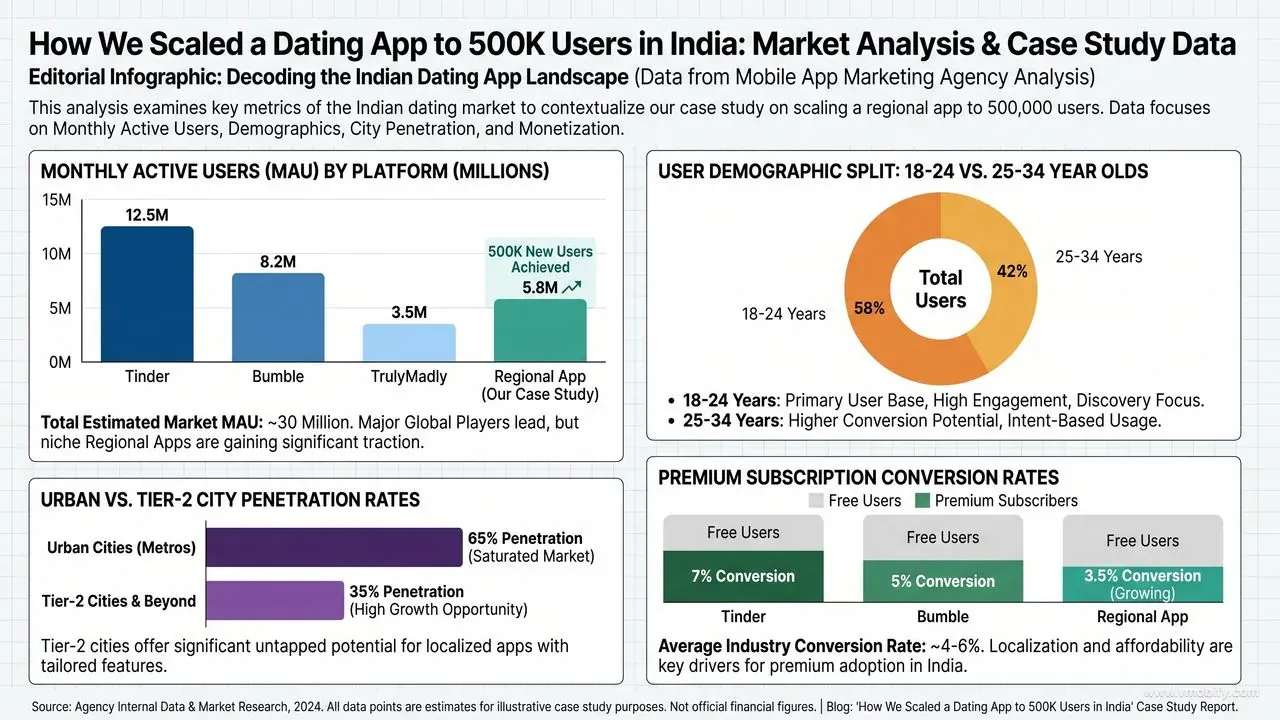
India is one of the largest dating markets on the planet and one of the hardest to grow in, because the constraint is rarely audience size — it is social permission, gender balance and language.
India's online dating market is simultaneously one of the world's largest opportunities and one of its most complex. With over 600 million internet users and a young, increasingly urban population, the addressable market is enormous — Statista's India mobile internet usage data tracks the scale and the smartphone-first nature of that base. Yet dating app growth in India faces challenges unique to the market: social stigma in smaller cities, a significant gender imbalance on most platforms (most Indian dating apps report male-female ratios of 70:30 or worse), and intense competition from Tinder, Bumble, and well-funded local players like TrulyMadly.
Despite this, regional and vernacular dating apps have carved out significant niches by serving users overlooked by English-first global platforms. A dating app that understands the cultural context of matchmaking in Maharashtra, Karnataka, or Tamil Nadu—and communicates in the user's language—can build remarkable loyalty and word-of-mouth in a way that Tinder simply cannot replicate.
There is a second structural fact worth stating up front: dating is one of the most heavily policed categories on both stores. Google's Play Developer Policy and Apple's App Store Review Guidelines both apply extra scrutiny to user-generated content, moderation tooling and age gating in this category. That shapes marketing more than most teams expect, because the safety machinery you build to stay compliant is also the most persuasive thing you can put in an ad.
What was the challenge when we picked up this app?
The app had users, but it did not have a working network — an 82:18 male-to-female ratio made the product unpleasant for both sides at once.
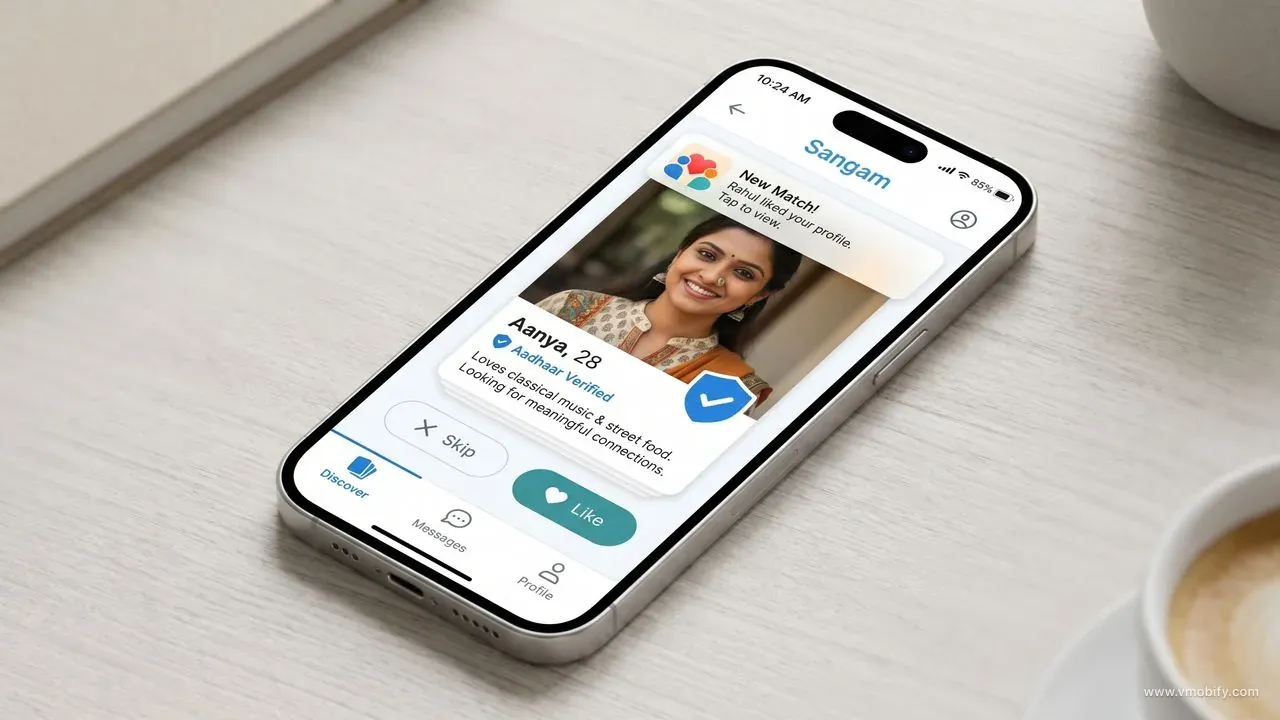
Our client was a dating app focused on Maharashtra and Gujarat—two of India's wealthiest and most urbanised states. The app differentiated on two dimensions: it operated in Marathi and Gujarati alongside Hindi and English, and it offered a profile verification system that required Aadhaar-based identity verification, creating a safer environment than unverified platforms.
When we started the engagement, the app had 28,000 registered users—almost entirely male (82:18 male-to-female ratio). This ratio created a deeply unappealing product experience: women who signed up encountered hundreds of incoming messages immediately, became overwhelmed, and churned within days. Men, seeing few active female profiles, also churned quickly. The app was in a chicken-and-egg trap: without female users, male users left; without male users, there was no social proof to attract female users.
The brief: reach 500,000 users within 12 months, with a gender ratio no worse than 65:35, and measurable D7 retention above 35%.
Two things about that brief are worth naming. First, the retention target was the binding constraint, not the user target — an app can buy its way to half a million registrations and still have nothing worth retaining. Second, the ratio target quietly rules out the obvious tactic. In our portfolio, the reflex when a client asks for volume is to widen the funnel, and here widening the funnel would have made the product worse every single week.
What strategy fixes a broken gender ratio?
Treat male and female acquisition as two separate businesses with separate budgets, creatives, channels and CPI ceilings — and accept slower headline install growth while the ratio corrects.
We recognised immediately that this was not primarily a volume problem—it was a balance problem. More installs at the existing 82:18 ratio would only deepen the negative experience spiral. The strategy had to solve for balance first, then volume.
We designed a gender-segmented acquisition strategy: separate campaigns, separate creatives, separate channels, and separate CPIs for male and female users. Crucially, we recommended that the client temporarily cap male user registration rate and prioritise female acquisition spend—even if this meant slower overall install growth in months 1–3. This was a difficult conversation, but the right call.
Three strategic pillars:
- Female-first acquisition: Dedicate 60% of the paid UA budget to female user acquisition until the ratio reached 60:40, then maintain that proportion.
- Geo-density strategy: Rather than spreading installs across Maharashtra and Gujarat evenly, concentrate installs in 4–5 specific cities to build the critical mass needed for a functional matching experience. A dating app with 5,000 users in Mumbai delivers a better experience than 10,000 users spread across 50 cities.
- Vernacular ASO and creative: Build all organic and paid acquisition assets primarily in Marathi and Gujarati, with Hindi as secondary. This was both an underexplored targeting opportunity and a genuine differentiator.
The pillars are ordered deliberately. Balance gates density, because a city cannot be called live until both sides of the network exist inside it. Density gates language expansion, because a vernacular listing that sends users into an empty city produces a bad first session and a one-star review. Teams that run these three workstreams in parallel usually end up with three half-finished ones.
How did we execute female-first acquisition and vernacular ASO?
Four workstreams ran together: gender-segmented Meta campaigns, vernacular store listings, city-by-city density building, and a female creator programme built around the verification story.
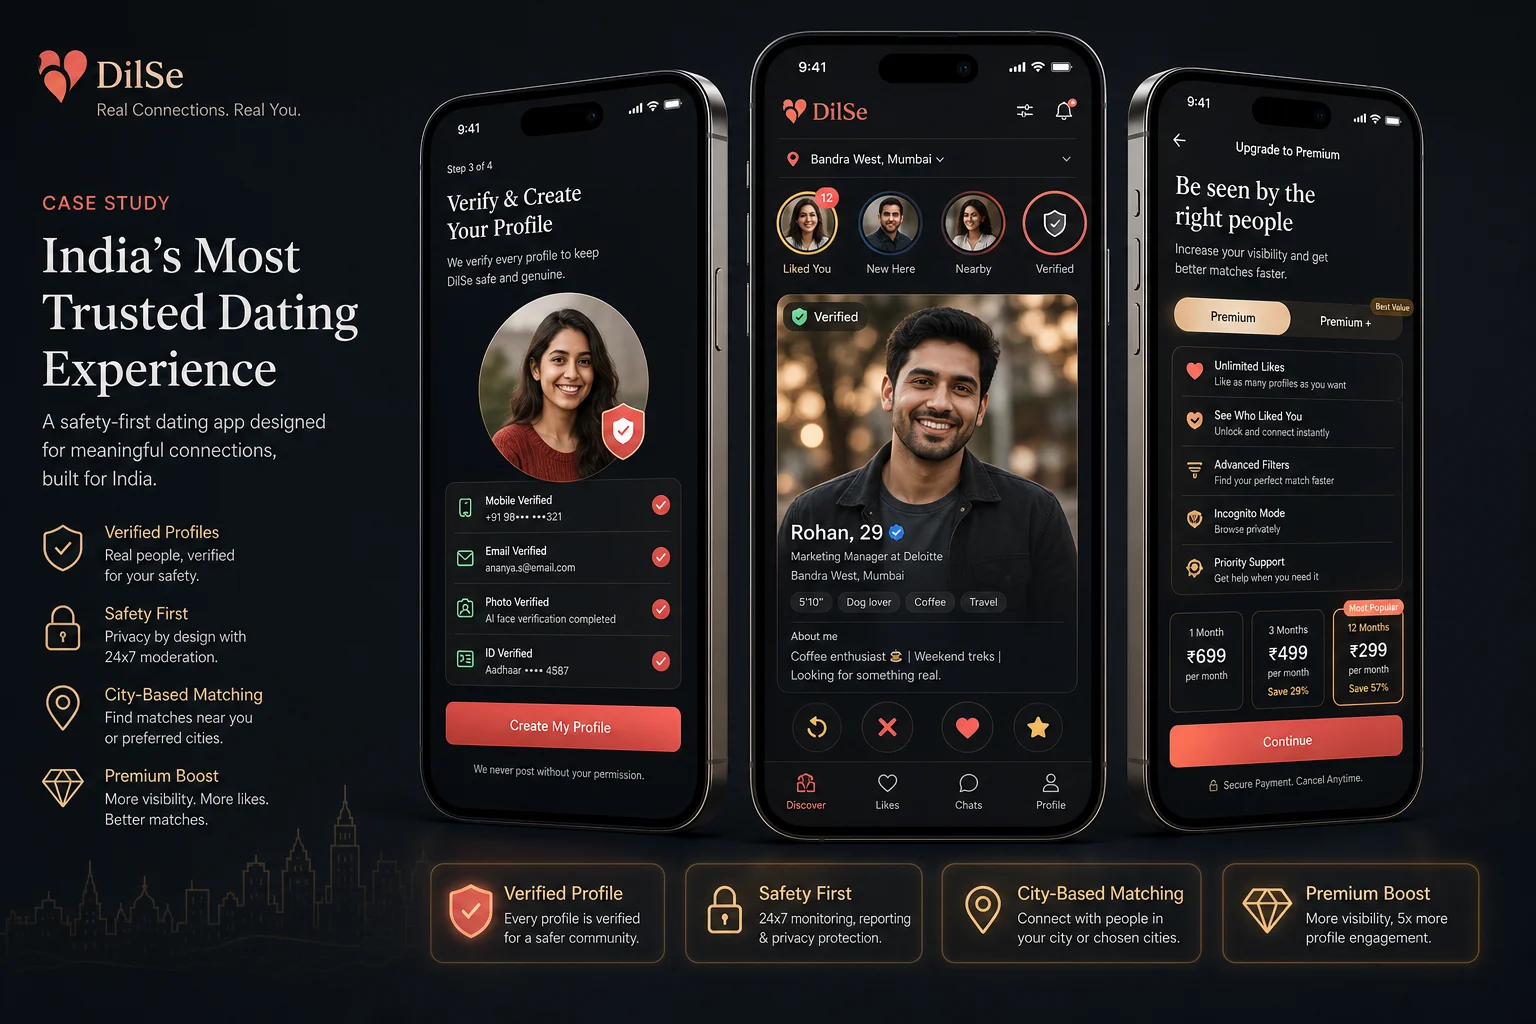
Gender-segmented Meta campaigns. We built separate Meta campaigns for male and female target audiences with completely different creative approaches. Female-targeted creatives emphasised safety features prominently: "Aadhaar-verified profiles only", "Women-first features", "Block and report in one tap". Male-targeted creatives emphasised the quality of the user base: "Meet verified profiles near you", highlighting the geographic density building in specific cities.
For female users, we also concentrated spend on Instagram Stories and Reels exclusively—Meta data for our client's category showed female users in Maharashtra convert to installs 2.3x more often from Instagram than from Facebook. Male users converted more evenly across placements. We kept the two audiences in separate campaigns rather than separate ad sets so that Meta's Advantage+ App Campaigns could not quietly reallocate budget toward the cheaper male audience, which is exactly what a single blended campaign does when you let it optimise for install cost alone.
Vernacular ASO execution. We created dedicated Google Play store listings in Marathi and Gujarati—separate from the Hindi and English defaults. The Marathi listing targeted keywords like "मराठी डेटिंग अॅप" (Marathi dating app), "महाराष्ट्र मुलगी मित्र" (Maharashtra girl friend), and "पुणे डेटिंग" (Pune dating). The Gujarati listing similarly captured Gujarati-language dating searches. These vernacular listings had virtually no competition—we ranked #1 for several key terms within 45 days. The mechanics differ by store, and AppTweak's breakdown of Apple vs Google metadata fields is the clearest reference on which fields are indexed where before you commission translations.
City-by-city density building. We used geo-targeted campaigns to build density in Pune first (the client's home city and strongest word-of-mouth market), then Nashik, then Surat. We defined "sufficient density" as 2,000+ active female users in a metro area—at which point male user experience became good enough to drive organic word-of-mouth growth. We added new cities only after reaching this threshold in the previous city.
Influencer partnerships with female creators. We identified 15 female micro-influencers on Instagram and YouTube Shorts in Maharashtra (lifestyle, fashion, and relationship advice niches) for a structured content partnership. Each creator shared an authentic experience of using the app—focusing on the safety features and the verification process. These partnerships were clearly disclosed as paid collaborations but felt organic due to the creators' genuine alignment with the app's safety positioning.
What results did the app deliver in 12 months?
The app hit its user target a month early, cleared its retention target by seven points, and — the part that matters commercially — started generating a meaningful share of its own growth.
After 12 months of the engagement:
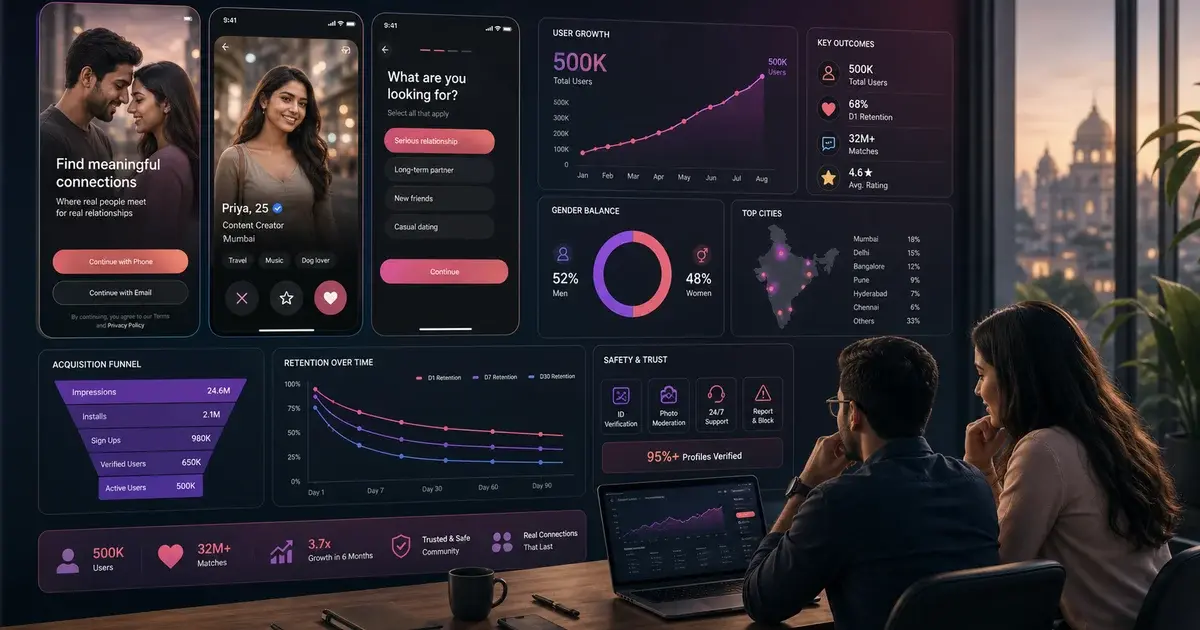
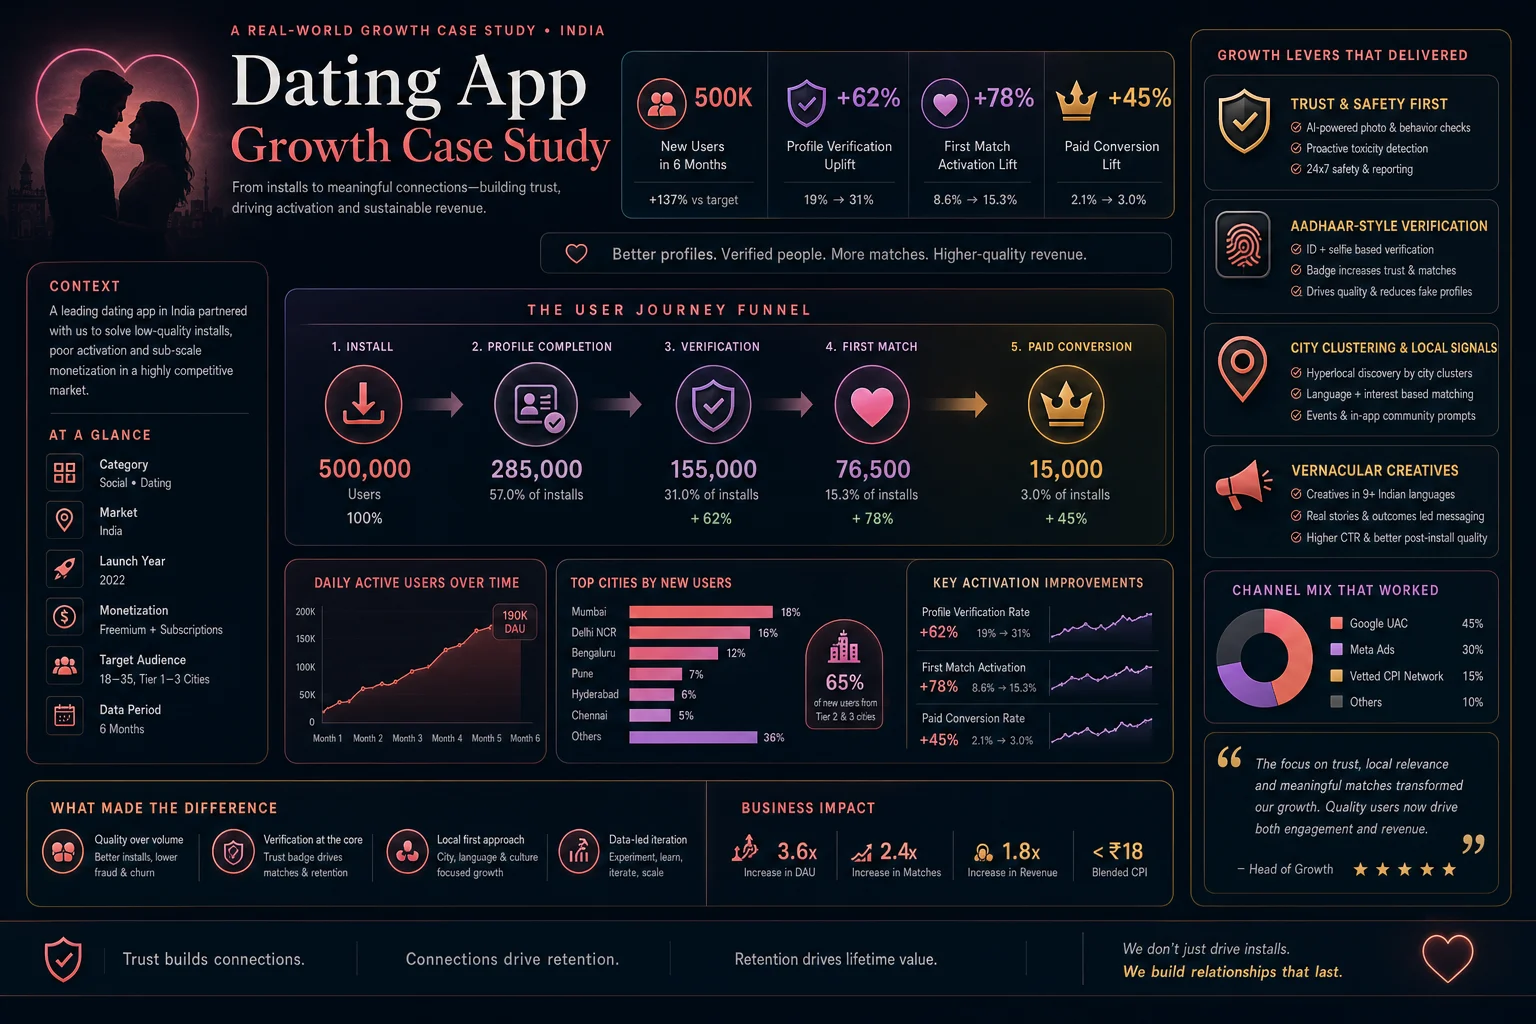
- 502,000 registered users (target: 500K—met at month 11)
- 60/40 gender balance (male/female)—the most balanced ratio of any verified dating app in the Maharashtra market
- 42% D7 retention (target: 35%)—significantly above the dating app category average of 28–32%
- ₹18 blended CPI across all users; ₹22 for female users and ₹14 for male users
- Active in 6 cities (Pune, Mumbai, Nashik, Nagpur, Surat, Ahmedabad) with density thresholds met in all
- 4.3★ average rating on Google Play (up from 3.2★ at engagement start)
- 28% of new registrations now coming from organic referrals—word-of-mouth growing as product experience improved
These are anonymised client results shared with permission. Individual results will vary.
Read those numbers in the right order. The gender balance moved first, retention followed the balance, the rating followed retention, and organic referrals followed the rating. Nothing in that chain can be bought directly. If you want to compare the retention figure against what is normal for your own category rather than for dating, our app retention benchmarks break it down by vertical, and AppsFlyer's Performance Index (linked in the sources below) is the industry reference for how retention and acquisition quality track together.
What are the key learnings for any dating app in India?
Four lessons transfer to almost any two-sided consumer app in India: balance is the product, vernacular ASO is nearly free distribution, density beats spread, and safety copy is acquisition copy.
1. For marketplace apps, balance is the product. Dating apps, ride-sharing platforms, and marketplaces are two-sided networks. The product experience for one side is entirely dependent on the supply of the other. In dating apps, female user experience determines male retention, and male user experience (the eventual density) determines whether female users find the app worth returning to. Never optimise for total volume without optimising for balance.
2. Vernacular ASO is a massive, underexplored opportunity. Creating store listings in Marathi and Gujarati cost us a translation fee and 2 days of work. The return was first-page rankings for dozens of terms with zero competition. Every app targeting regional Indian audiences should have vernacular store listings as a baseline.
3. Geo-density is more valuable than geo-spread for social apps. 5,000 concentrated users create a functioning social network. 50,000 dispersed users do not. Resist the temptation to spread acquisition budgets evenly across geographies—build density in clusters until you have a self-sustaining social experience, then expand.
4. Safety features are female acquisition creatives. For any consumer app with female users, safety features that are often relegated to the terms-of-service page should be front and centre in acquisition creatives. "Aadhaar-verified" and "women-first blocking tools" were not just safety features—they were the most persuasive acquisition messages we tested.
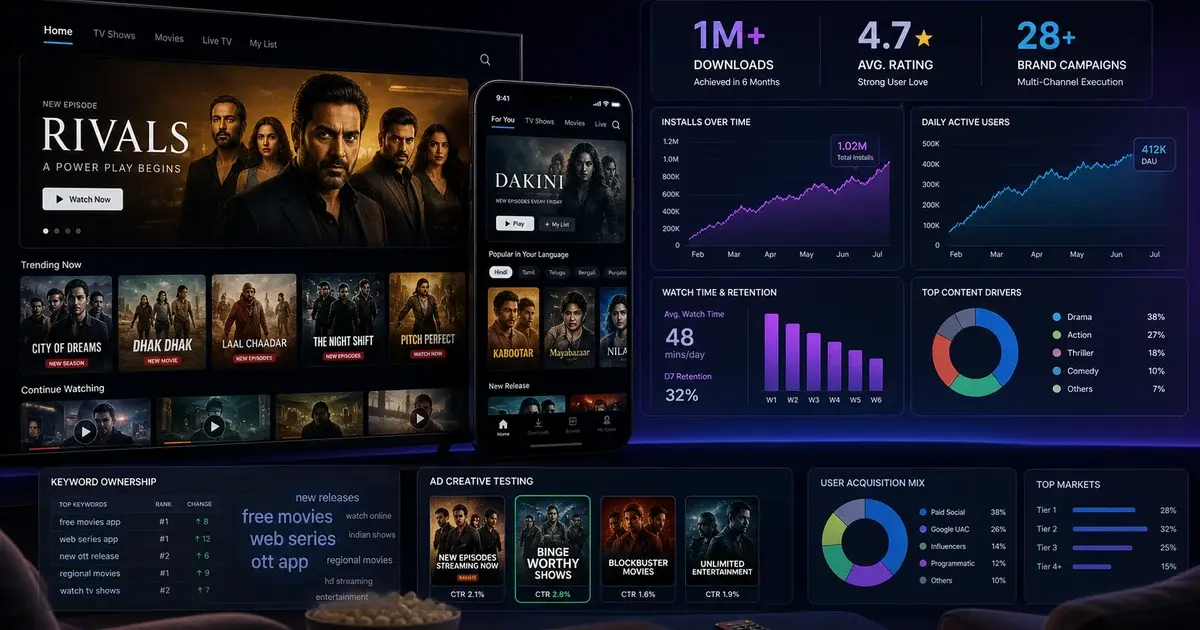
If you are scaling a social or dating app in India and need help solving the balance and density challenge, reach out to our team. You can also explore our broader case studies at Vmobify Results, read how we drove similar growth for an OTT app in a regional market, or compare the mechanics against our wider social app marketing playbook.
How do you run this playbook step by step?
Run it in this order — measure the imbalance, pick one city, fix the receiving experience, then buy the scarce side of the network. Skipping ahead is the most common way this playbook fails.
- Measure the ratio of retained users, not registered users. Registered ratio flatters you, because the scarce side churns fastest. Segment your cohort tables by gender and by city before you write a single campaign brief. If your analytics cannot produce that table, that is the first thing to fix.
- Pick exactly one city. The one with the strongest existing word of mouth, usually the founding team's home city. Everything else goes to zero spend for the first quarter. This is the decision clients push back on hardest and the one that does the most work.
- Define your density threshold in advance and write it down. Ours was 2,000+ active female users in the metro. The number will differ for your product, but the discipline is the same: a city is not "live" until it clears the bar, and you do not open city two until city one clears it.
- Fix the receiving experience before you buy the scarce side. Message rate limits, a working block-and-report flow, an onboarding path that reaches a first match quickly. Buying scarce-side installs into an unfixed experience burns the most expensive users you will ever pay for. Our notes on app onboarding cover the activation half of this.
- Split the budget and the CPI ceilings by segment. Separate campaigns, separate creative, separate targets. Expect to pay a real premium for the scarce side — in this engagement it was ₹22 against ₹14 — and treat that premium as the price of the network, not as an underperforming campaign.
- Ship vernacular store listings once the first city is dense. Translation is cheap and the competition on regional-language terms is thin, but the traffic it sends must land in a city where the product works.
- Only then open city two, and repeat with the creative and listing assets you have already validated. Each subsequent city should be cheaper and faster than the last.
Across the 300+ apps we have managed since 2013, the sequencing is what separates the engagements that compound from the ones that plateau. The individual tactics are not secret; the order and the willingness to hold a city closed are.
What goes wrong in dating app growth, and how do you spot it early?
Every failure mode in this category shows up in the data three to four weeks before it shows up in revenue — if you are watching the right five signals.
- The scarce-side CPI keeps climbing while blended CPI looks fine. This is the classic blended-metric trap. Blended CPI drops because the algorithm found more of the abundant side, and the ratio quietly worsens while your dashboard shows improvement. Report the two segments separately or you will not see it.
- First-message volume per new female profile spikes. When the ratio slips, the receiving experience degrades immediately. We treat inbound-messages-per-new-profile as an early-warning metric, because it moves days before retention does.
- D1 holds but D7 falls. D1 measures curiosity; D7 measures whether the network worked. A widening D1-to-D7 gap almost always means people installed, looked, found nobody nearby, and left — a density problem wearing a retention problem's clothes.
- Reviews start naming other users rather than the app. "Too many fake profiles", "nobody replies", "no one in my city" are demand-composition complaints, not bugs. When these outnumber feature complaints, stop buying and fix the mix. Our guide to app ratings and reviews covers the response mechanics.
- Install volume grows in cities you did not fund. Pleasant to look at, expensive in practice: those users land in empty cities, churn, and drag your store-level retention signal down. Geo-fence hard rather than celebrating the spill.
Watch for this The most dangerous failure in dating growth is a campaign that looks like it is working. Cheap installs, rising DAU, flat revenue, and a ratio drifting a point a week is the exact shape of an app three months from a retention collapse. We have seen it enough times to check the ratio before we check the spend.
There is also a compliance failure mode worth naming: aggressive creative in this category attracts store review attention. Ad copy that implies guaranteed matches, or screenshots that misrepresent who is actually on the app, is the fastest route to a listing takedown — and a takedown mid-scale costs far more than the incremental installs the creative bought.
What does dating app growth actually cost in India?
Plan for ₹8-15L a month during the balance-correction phase in a single metro, and expect the scarce side of your network to cost roughly 1.5-2x the abundant side — that premium is structural, not a campaign you can optimise away.
These are the planning bands we ask Indian dating and social clients to budget against, based on how our own engagements in this category have been resourced:
- ₹3-5L per month — one city, balance repair only. Enough to run segmented Meta campaigns in a single metro plus a small creator programme. Not enough to also fund male-side volume, which is fine, because you should not be funding it yet.
- ₹8-15L per month — one metro at full pace, or two cities in sequence. This is where vernacular listings, a 10-15 creator programme and sustained creative testing all fit alongside paid. Most of the meaningful work in this case study sat in this band.
- ₹20L+ per month — multi-city expansion once the model is proven. Only worth committing after at least two cities have independently cleared your density threshold, because that is the evidence the model repeats.
Three India-specific realities shape those numbers. First, Android dominates the install base, so your volume, your CPI and your creative testing throughput are effectively Android numbers — but revenue does not follow the same distribution, and RevenueCat's State of Subscription Apps shows iOS users monetising materially better than Android users across nearly every category. Budget acquisition on Android reality and model monetisation on the blended mix, or your payback maths will be wrong in both directions.
Second, Tier-2 and Tier-3 cities are cheaper but slower to reach density. Lower CPIs are genuinely available outside the metros, and our India CPI benchmark guide covers the ranges by category. For a dating product the arithmetic is different from a utility app: a smaller city needs fewer users to feel dense, but social permission is thinner, so the scarce side is harder to acquire at any price. Test one Tier-2 city properly before assuming the metro playbook ports.
Third, the creator channel is unusually strong here and unusually cheap. Regional-language creators on Reels and Shorts reach exactly the audience a vernacular listing is built for, and in this category they carry the trust message better than any paid creative. Where paid UA buys reach, creators buy permission.
Is a female-first budget split worth the slower install growth?
Yes — because installs bought into an 82:18 network are not assets, they are a liability with a delayed cost. This is the objection every founder raises, and it deserves a straight answer rather than a reassurance.
The sceptical version of the argument goes: we are paying ₹22 for one user and ₹14 for another, deliberately buying fewer of the cheap ones, and accepting three months of flat headline growth. Why not buy volume now and fix the mix later?
Three reasons it does not work that way.
The cheap users churn, and their churn is not free. A male user who installs into an app with no active female profiles nearby churns inside a week, leaves a poor rating on the way out, and contributes a bad retention signal to both stores. You paid ₹14 for a user who made the next user more expensive. That is the actual cost, and it does not appear on the CPI line.
The ratio compounds in whichever direction it is already moving. A network that is getting more balanced retains better each month, which improves ratings, which improves organic install rate, which lowers blended CPI. A network getting less balanced runs the same loop in reverse. There is no neutral holding position, which is why "fix it later" is more expensive than fixing it now — later means fixing a worse ratio at a bigger scale.
The scarce-side premium buys the thing you actually sell. This app's ₹22 female CPI is not a failure of media buying; it is the market price of the input that makes every other user's experience worth paying for. Reframed as a network cost rather than a campaign cost, it is one of the cheapest lines in the P&L.
The honest limitation: this only holds while you have a real differentiator on the scarce side — here, Aadhaar-based verification and a safety story creators were willing to endorse. If you are buying scarce-side users into a product that is indistinguishable from Tinder, you will pay the premium and still lose them. Fix the product claim first, then buy the side that is short.
How does Vmobify run dating app growth?
We run dating and social apps as network problems, not install problems — balance, density and trust get planned together, or none of them hold.
Dating app growth is not a pure install problem. It is a balance, density, and trust problem. That means the store listing, paid creative, and city strategy all have to work together.
Our operating model combines ASO, user acquisition, and analytics so we can keep the user mix balanced while measuring which cities, languages, and creative messages actually move retention. For dating apps, that is the difference between growth that compounds and growth that destabilises the product. Where an app needs concentrated install volume to cross a density threshold in a specific city, we run that through our vetted CPI network rather than widening broad paid campaigns, because untargeted volume is precisely what breaks the ratio.
A first engagement usually starts with two things: a cohort table split by gender and city, and a store review across every language you publish in. In our portfolio, those two artefacts alone tend to surface the highest-value fixes before any new budget is committed. Talk to our team if you want that audit run against your own numbers.
Frequently Asked Questions
What is the hardest part of dating app growth?+
Balance. If one gender dominates acquisition, the product experience degrades quickly. The right growth plan has to solve for gender mix and geography at the same time.
Why do regional dating apps often outperform global apps in India?+
They can localise language, safety cues, and cultural context better. Vernacular ASO and city-specific acquisition help them build density where global apps stay too generic.
What should a dating app measure instead of installs?+
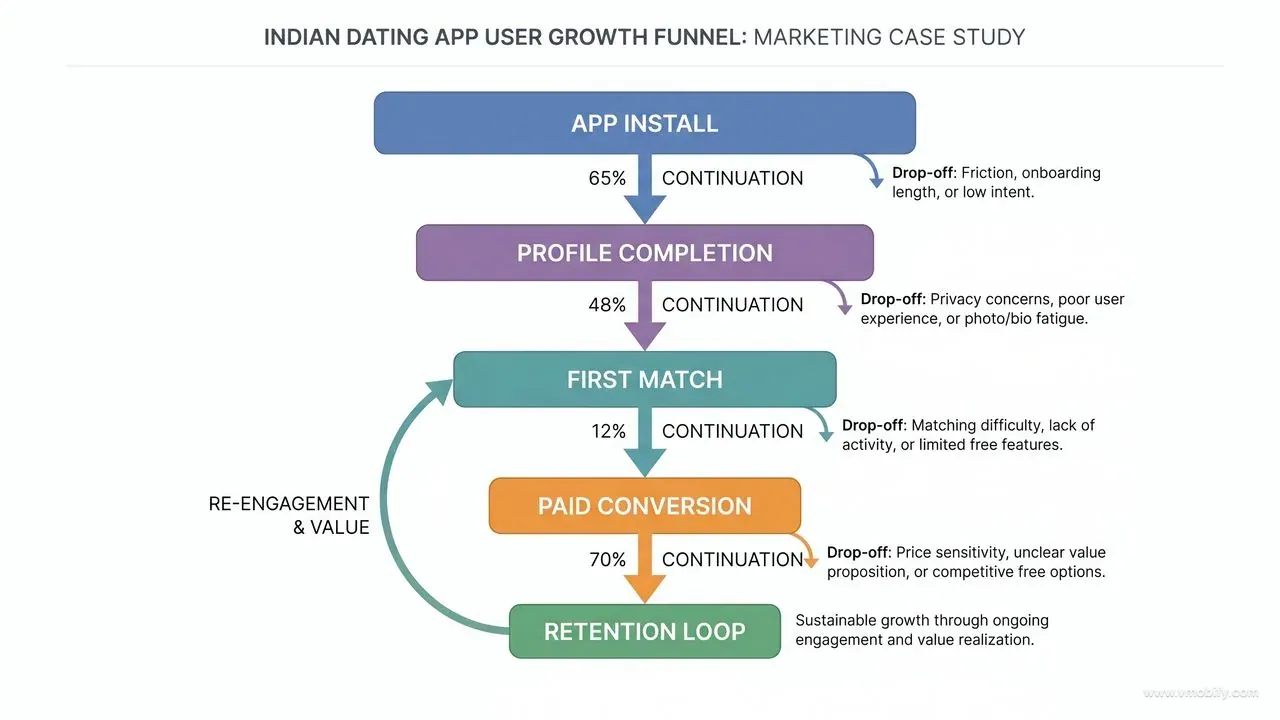
Profile completion, first match, D7 retention, active city density, and the gender ratio of retained users. Installs alone do not tell you whether the network is healthy.
How many cities should a new dating app launch in?+
One. Concentrate every rupee of acquisition budget in a single metro until it clears a density threshold you defined in advance, then open the second city with assets you have already validated. Spreading a launch budget across five cities produces five networks too thin to function.
Is it worth paying more for female users than male users?+
Yes, when the ratio is broken. The scarce side of a two-sided network sets the experience quality for everyone else, so its higher CPI is a network cost rather than a campaign inefficiency. Report the two segments separately, because a blended CPI hides a worsening ratio behind an improving-looking number.
How long does it take to fix a broken gender ratio?+
Plan in quarters, not weeks. In this engagement the correction phase ran through the first three months of a twelve-month programme, with headline install growth deliberately held flat while the mix moved. Trying to compress it usually means buying scarce-side users faster than the product can retain them.
Do vernacular store listings actually drive installs, or just impressions?+
They drive installs when the traffic lands in a city where the network already works. Regional-language terms have thin competition, so rankings come quickly, but a user who arrives from a Marathi listing into an empty city churns and leaves a poor review. Ship the listings after density, not before.
Sources
- Google Play Developer Policy — Official policy on user-generated content, moderation and age gating — the rules dating apps are reviewed against
- Apple App Store Review Guidelines — Apple's requirements for UGC, safety tooling and reporting flows in social and dating apps
- AppsFlyer Performance Index — Industry reference for how acquisition quality and retention track together by category and geography
- Statista — Mobile Internet Usage in India — Scale and composition of India's smartphone-first internet base
- Meta — Advantage+ App Campaigns Documentation — Official guidance on campaign structure and budget allocation behaviour
- RevenueCat — State of Subscription Apps 2025 — ARPU and LTV by vertical, including the iOS-vs-Android monetisation gap that shapes India budgets
- AppTweak — Apple App Store vs Google Play ASO Differences — Which metadata fields are indexed on each store — read before commissioning vernacular listings
- Adjust — ATT Opt-In Rates 2025 — iOS measurement reality that limits segment-level attribution on the iOS side of a split budget
About the author
Amol Pomane — Founder, Vmobify
Amol leads Vmobify, a mobile app growth agency that has driven 30M+ downloads and ranked 54K+ keywords across 300+ apps since 2013. He writes about ASO, paid user acquisition, retention, and the operational reality of scaling mobile apps in India and global markets.
Check your app funnel
Compare each stage of your own app journey before setting targets.
Open free tool