India UA Specialist

User Acquisition Agency in India

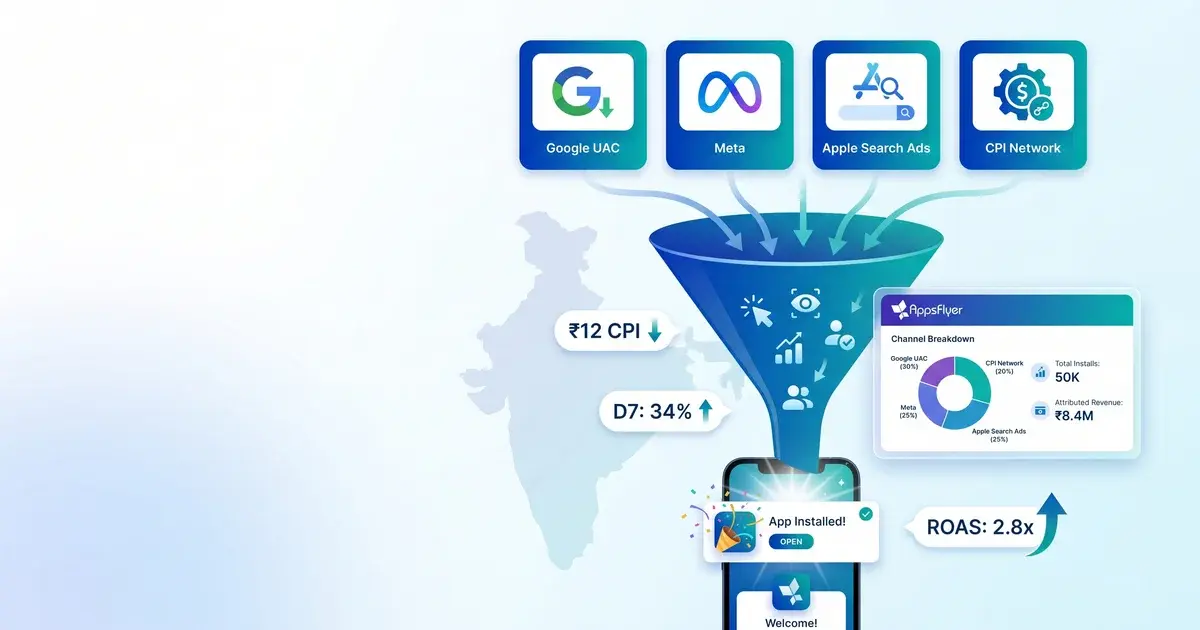
100M+ installs delivered across Google UAC, Meta App Install, Apple Search Ads, and CPI networks — managed as one system with independent MMP attribution. No channel silos. No network-reported install counts.

300+ Apps · 13+ Years · India-First UA Strategy
100M+
Client installs delivered
30–60%
Lower CPIs vs Western markets
User acquisition agency India — multi-channel funnel with MMP attribution

Every UA Channel for Indian Apps

India UA is not a single channel problem. We manage the full channel stack — each one configured for India's Android-dominant, price-sensitive, vernacular-diverse market.

Google App Campaigns (UAC)

Highest volume channel for Android-heavy India. We manage learning phase budgets, feed creative assets across Search, Play Store, YouTube, and Display, and optimise toward quality conversion events — not raw install counts.

Highest Android volume

Meta App Install Campaigns

Facebook and Instagram campaigns with demographic targeting and lookalike audiences built from your best-retained users — D30 cohorts, not just installer lists.

Lookalike from LTV cohorts

Apple Search Ads

iOS UA with intent-based search targeting on the App Store. Full SKAdNetwork configuration, conversion value map setup, and SKAN-compatible optimisation strategies.

Full SKAdNetwork setup

CPI Networks

Burst campaigns for ranking velocity using a curated, fraud-vetted publisher pool. D1 retention quality thresholds enforced — publishers with anomalous patterns are blacklisted immediately.

Fraud-vetted publishers

Programmatic DSP

InMobi, ironSource, and AppLovin for additional scale beyond search and social. Programmatic adds reach across mid-tier audiences where Google and Meta CPIs are higher.

InMobi · ironSource · AppLovin

India UA Benchmarks

Real performance data from operating 300+ apps in India — not industry reports. These are the benchmarks we use to set targets before any spend is committed.

₹8–₹25
Android gaming CPI range in India

Highly competitive category; creative quality and bid strategy determine where you land

₹40–₹120
Fintech app CPI range in India

Higher CPI reflects higher user LTV; quality-adjusted economics often superior to gaming

30–60%
Lower CPIs vs Western markets

India budget goes significantly further — but quality-gating is essential

2–4 weeks
Google UAC learning phase duration

Requires consistent budget and no major campaign changes during this window

MMP Attribution Is Not Optional

Every network will tell you it delivered more installs than the others. Independent MMP attribution (AppsFlyer or Adjust) is the only way to know which channels actually drove installs — and which ones are double-counting.

For iOS, SKAdNetwork (SKAN) eliminates user-level data entirely. We configure your conversion value maps, align campaign events with SKAN measurement windows, and build reporting frameworks that work with aggregated — not user-level — attribution data.

AppsFlyer and Adjust configuration and validation
SKAdNetwork conversion value map setup for iOS
Cohort tracking by channel, creative, and campaign
LTV vs. CPI unit economics — not just install volume
Cross-channel deduplication and fraud filtering
Weekly cohort reporting connected to actual revenue

Why LTV Beats CPI

A channel with ₹15 CPI and 20% D7 retention is worth less than a channel with ₹40 CPI and 60% D7 retention — if your ARPU is high enough. We model unit economics before scaling any channel.

D1 Retention
First signal of user quality by channel
D7 Retention
Primary quality gate for scaling decisions
D30 Retention
Cohort baseline for LTV modelling
ARPU by Cohort
Revenue per install by channel and creative

How We Run UA for Indian Apps

From audit to scalable, predictable installs — a five-stage process built around India's specific market dynamics.

1

UA Audit

Day 1–3

Full audit of existing paid channels, attribution setup, creative library, and CPI benchmarks vs. India category norms.

2

Strategy

Week 1

Channel mix recommendation by vertical, target CPI, and audience profile. India-specific — not a generic global playbook.

3

Setup (MMP + Campaigns)

Week 2–3

MMP attribution configured and validated, SKAdNetwork set up for iOS, conversion events mapped, campaign infrastructure built before spend.

4

Launch & Learn

Week 3–6

Campaigns go live across active channels. Google UAC exits learning phase. Initial creative performance data drives first optimisation decisions.

5

Scale

Month 2+

Channel mix validated, winning creatives identified, budget scales with confidence. Monthly reporting connects performance to LTV — not just install counts.

Real Campaign Performance Data

Click on any performance data to view the full image and campaign details.

ASO Performance Dashboard
ASO
View Case Study
ASO

ASO Performance Dashboard

Real ASO optimization results showing keyword rankings, organic traffic growth, and conversion improvements.

300% Organic Growth
54K+ Keywords Ranked
65% Conversion Rate Boost
Click to view full image
CPI Campaign Performance - Part 1
CPI
View Case Study
CPI

CPI Campaign Performance - Part 1

Cost Per Install campaign results showing efficient user acquisition and scaling capabilities.

60% Lower CPI
100M+ Installs
300% Higher ROAS
Click to view full image
Google Ads Performance
User Acquisition
View Case Study
User Acquisition

Google Ads Performance

Google Ads campaign results showing UAC optimization, targeting precision, and conversion tracking.

Precision Targeting
UAC Optimization
Higher Quality Installs
Click to view full image
Meta Ads Install Results
User Acquisition
View Case Study
User Acquisition

Meta Ads Install Results

Facebook and Instagram advertising performance focused on app installs and user engagement.

Meta Ads Optimization
Social Media Targeting
Engaged User Base
Click to view full image
Vmobify Advertising Results
User Acquisition
View Case Study
User Acquisition

Vmobify Advertising Results

Our own advertising performance showcasing the effectiveness of our growth strategies.

Proven Strategies
Real Results
Self-Validated Success
Click to view full image

Showing 5 performance data examples

Get Your Performance Analysis
Client app logo 1
Client app logo 2
Client app logo 3
Client app logo 4
Client app logo 5
Client app logo 6
Client app logo 7
Client app logo 8
Client app logo 9
Client app logo 10
Client app logo 11
Client app logo 12
Client app logo 13
Client app logo 14
Client app logo 15
Client app logo 16
Client app logo 17
Client app logo 18
Client app logo 19
Client app logo 20
Client app logo 1
Client app logo 2
Client app logo 3
Client app logo 4
Client app logo 5
Client app logo 6
Client app logo 7
Client app logo 8
Client app logo 9
Client app logo 10
Client app logo 11
Client app logo 12
Client app logo 13
Client app logo 14
Client app logo 15
Client app logo 16
Client app logo 17
Client app logo 18
Client app logo 19
Client app logo 20

Trusted by 300+ mobile apps

Frequently Asked Questions

Common questions about mobile app user acquisition in India.

What user acquisition channels do you manage for Indian apps?
We manage Google App Campaigns (UAC) for Android, Meta App Install campaigns (Facebook and Instagram) for demographic targeting, Apple Search Ads for iOS intent-based acquisition, CPI network campaigns for burst install volume, and programmatic DSPs including InMobi and AppLovin for additional scale. Channel mix is determined by your vertical, target CPI, and audience profile — there is no one-size-fits-all India UA strategy.
What are realistic CPI benchmarks for India?
India CPI benchmarks vary significantly by vertical and platform. Android gaming: ₹8–₹25 CPI. Android fintech: ₹40–₹120. Android utility: ₹15–₹60. Android edtech: ₹25–₹80. iOS CPIs are typically 3–5x higher than Android in India. These are install-level CPIs; quality-adjusted CPIs accounting for D7 retention are higher. We establish your category-specific benchmark before setting targets.
How does Google App Campaigns (UAC) work for India?
Google UAC is a fully automated campaign type that uses machine learning to find users likely to install your app across Search, Play Store, YouTube, and the Display Network. You provide creative assets (images, videos, headlines), set a target CPI or target action, and Google optimises delivery. For India's Android-dominant market, UAC typically delivers the highest volume of installs of any single channel. The learning phase (2–4 weeks) requires consistent budget and no major campaign changes.
How do you handle attribution for iOS user acquisition under SKAdNetwork?
SKAdNetwork (SKAN) is Apple's privacy-preserving attribution framework for iOS 14.5+. It eliminates user-level attribution, introduces conversion value windows for event tracking, and delays attribution reports by 24–48 hours. Proper iOS UA under SKAN requires configuring conversion value maps in your MMP, aligning campaign events with SKAN measurement windows, and adjusting optimisation strategies for aggregated data. We handle full SKAN configuration as part of every iOS UA engagement.
What is the minimum budget to run effective UA campaigns in India?
For Google UAC to exit the learning phase and optimise effectively, you typically need ₹3L–₹5L/month minimum, ideally ₹8L+ for competitive categories. Meta can produce useful test data with ₹1L–₹2L/month, though at smaller budgets creative testing cycles are slow. Below these thresholds, algorithms lack sufficient conversion data and CPIs remain artificially high. We recommend realistic budget ranges based on your category benchmarks before you commit.
How do you prevent ad fraud in India UA campaigns?
Fraud is more prevalent in India than most markets due to the volume of low-quality inventory. Our approach: we mandate independent MMP attribution (AppsFlyer or Adjust) — never relying on network-reported install counts. We monitor install velocity anomalies, device ID patterns, and post-install event rates in real-time. For CPI network campaigns, we vet publishers individually and set D1 retention quality thresholds. Publishers with anomalous patterns are blacklisted immediately.
How do you measure UA campaign quality beyond install volume?
Install count is the entry metric, not the success metric. We track D1, D7, and D30 retention rates by channel, creative, and campaign; install-to-registration and install-to-purchase conversion rates; ARPU and LTV by cohort; and blended CPI vs. CPE (cost per engagement). A channel with 50% lower CPI but 80% lower retention may have 3x worse unit economics. We track through to LTV, not just installs.
What creative formats work best for app install campaigns in India?
For Google UAC: portrait and landscape video (15s, 30s), playable ads for gaming, and native-style images. For Meta: vertical video (9:16) performs best on Instagram Reels and Stories; carousel ads work well for feature-rich apps. Vernacular creatives (Hindi, Tamil) consistently outperform English-only creatives for tier-2 and tier-3 Indian audiences. We test creative formats systematically rather than relying on intuition.
How do you target the right users for Indian apps?
For Meta: we start with broad demographic targeting + interest stacks, then build lookalike audiences from your best-retained users (D30 retained, high-LTV cohorts). For Google UAC: the algorithm targets automatically, but quality conversion events matter — we ensure your in-app events are passed back to Google for optimisation. For all channels: vernacular creative adaptation for tier-2/3 audiences is often the single highest-leverage targeting improvement.
How long does it take to see stable UA performance?
Week 1: campaigns launch, initial data collection. Weeks 2–4: Google UAC exits learning phase, initial creative performance data emerges. Month 2: systematic creative testing identifies winning variants, CPI stabilises toward target. Month 3+: channel mix is validated, budget can be scaled confidently. Full channel optimisation — predictable CPIs, stable LTV, reliable scale — typically requires 90 days of continuous management.